CRLA reading hotspots, places where high shares of struggling readers sit next to each other, gather in a few parts of the country rather than being scattered at random. Across 1,639 municipalities and cities, the estimated share of learners in Grades 1–3 who were struggling readers at the end of SY 2025-26 runs from 0.2% to 68.0%. Neighboring places resemble each other strongly, with a Moran’s I of 0.65. After a correction for testing many places at once, 64 municipalities form high-high clusters, in BARMM (38), Region XII (15), Region IX (10), Region XI (1).
Those high-high places hold 9.6% of the country’s struggling readers but only 3.5% of its assessed learners. At the other end, 151 municipalities form low-low clusters, with the largest numbers in Bohol (41), Leyte (27), Batangas (14), Mountain Province (9), Capiz (9), Southern Leyte (9). The shares come from the CRLA results published on the EDCOM II early-childhood dashboard.
Key findings
- The estimated share of struggling readers ranges from 0.2% to 68.0% across 1,639 municipalities and cities; the darkest class on the map (15.3–68.0%) is led by BARMM (68), Region XII (31), Region V (25).
- Neighboring municipalities have similar shares: Moran’s I is 0.65 (permutation p = 0.0001, z = 37.5), and the version built for rates gives the same 0.65.
- After Benjamini–Hochberg control at FDR 5%, 64 municipalities are high-high, 151 low-low, 2 high-low and 3 low-high; without the correction, 425 would have been flagged.
- The high-high clusters are in BARMM (38), Region XII (15), Region IX (10), Region XI (1), and the provinces with the most are Maguindanao del Sur (12), Maguindanao del Norte (12), Sulu (10), Cotabato (North Cotabato) (7), Tawi-Tawi (7), Sultan Kudarat (5).
- The high-high places hold 49,374 struggling readers, 9.6% of the national total, with 3.5% of assessed learners; their pooled share is 27.3%, against 4.3% in the low-low places.
- The provinces with the most low-low municipalities are Bohol (41), Leyte (27), Batangas (14), Mountain Province (9), Capiz (9), Southern Leyte (9).
- A second test, Getis-Ord Gi*, finds 66 hot spots and 153 cold spots, and 100.0% of the high-high municipalities are also Gi* hot spots.
A map of struggling readers by municipality and city
The Comprehensive Rapid Literacy Assessment (CRLA) is a reading screen that teachers give to learners in the early grades. The results here are from the end of SY 2025-26, as of 10 May 2026, for public schools. Each learner is counted once: Grade 1 in the Mother Tongue, Grade 2 in Filipino and Grade 3 in English. A struggling reader is a learner at the Low Emerging or High Emerging level, the two lowest of the CRLA’s five levels.
Nationally, 511,753 of 5,127,670 assessed learners, or 10.0%, were struggling readers. Because the CRLA covers almost every learner, national and regional shares are population counts, not survey estimates.
The first map colors each municipality or city by its estimated share of struggling readers. The places are split into seven classes with the same number of places in each, so each shade covers about a seventh of the places. The darkest class spans 15.3–68.0%, and the regions with the most places in it are BARMM (68), Region XII (31), Region V (25).
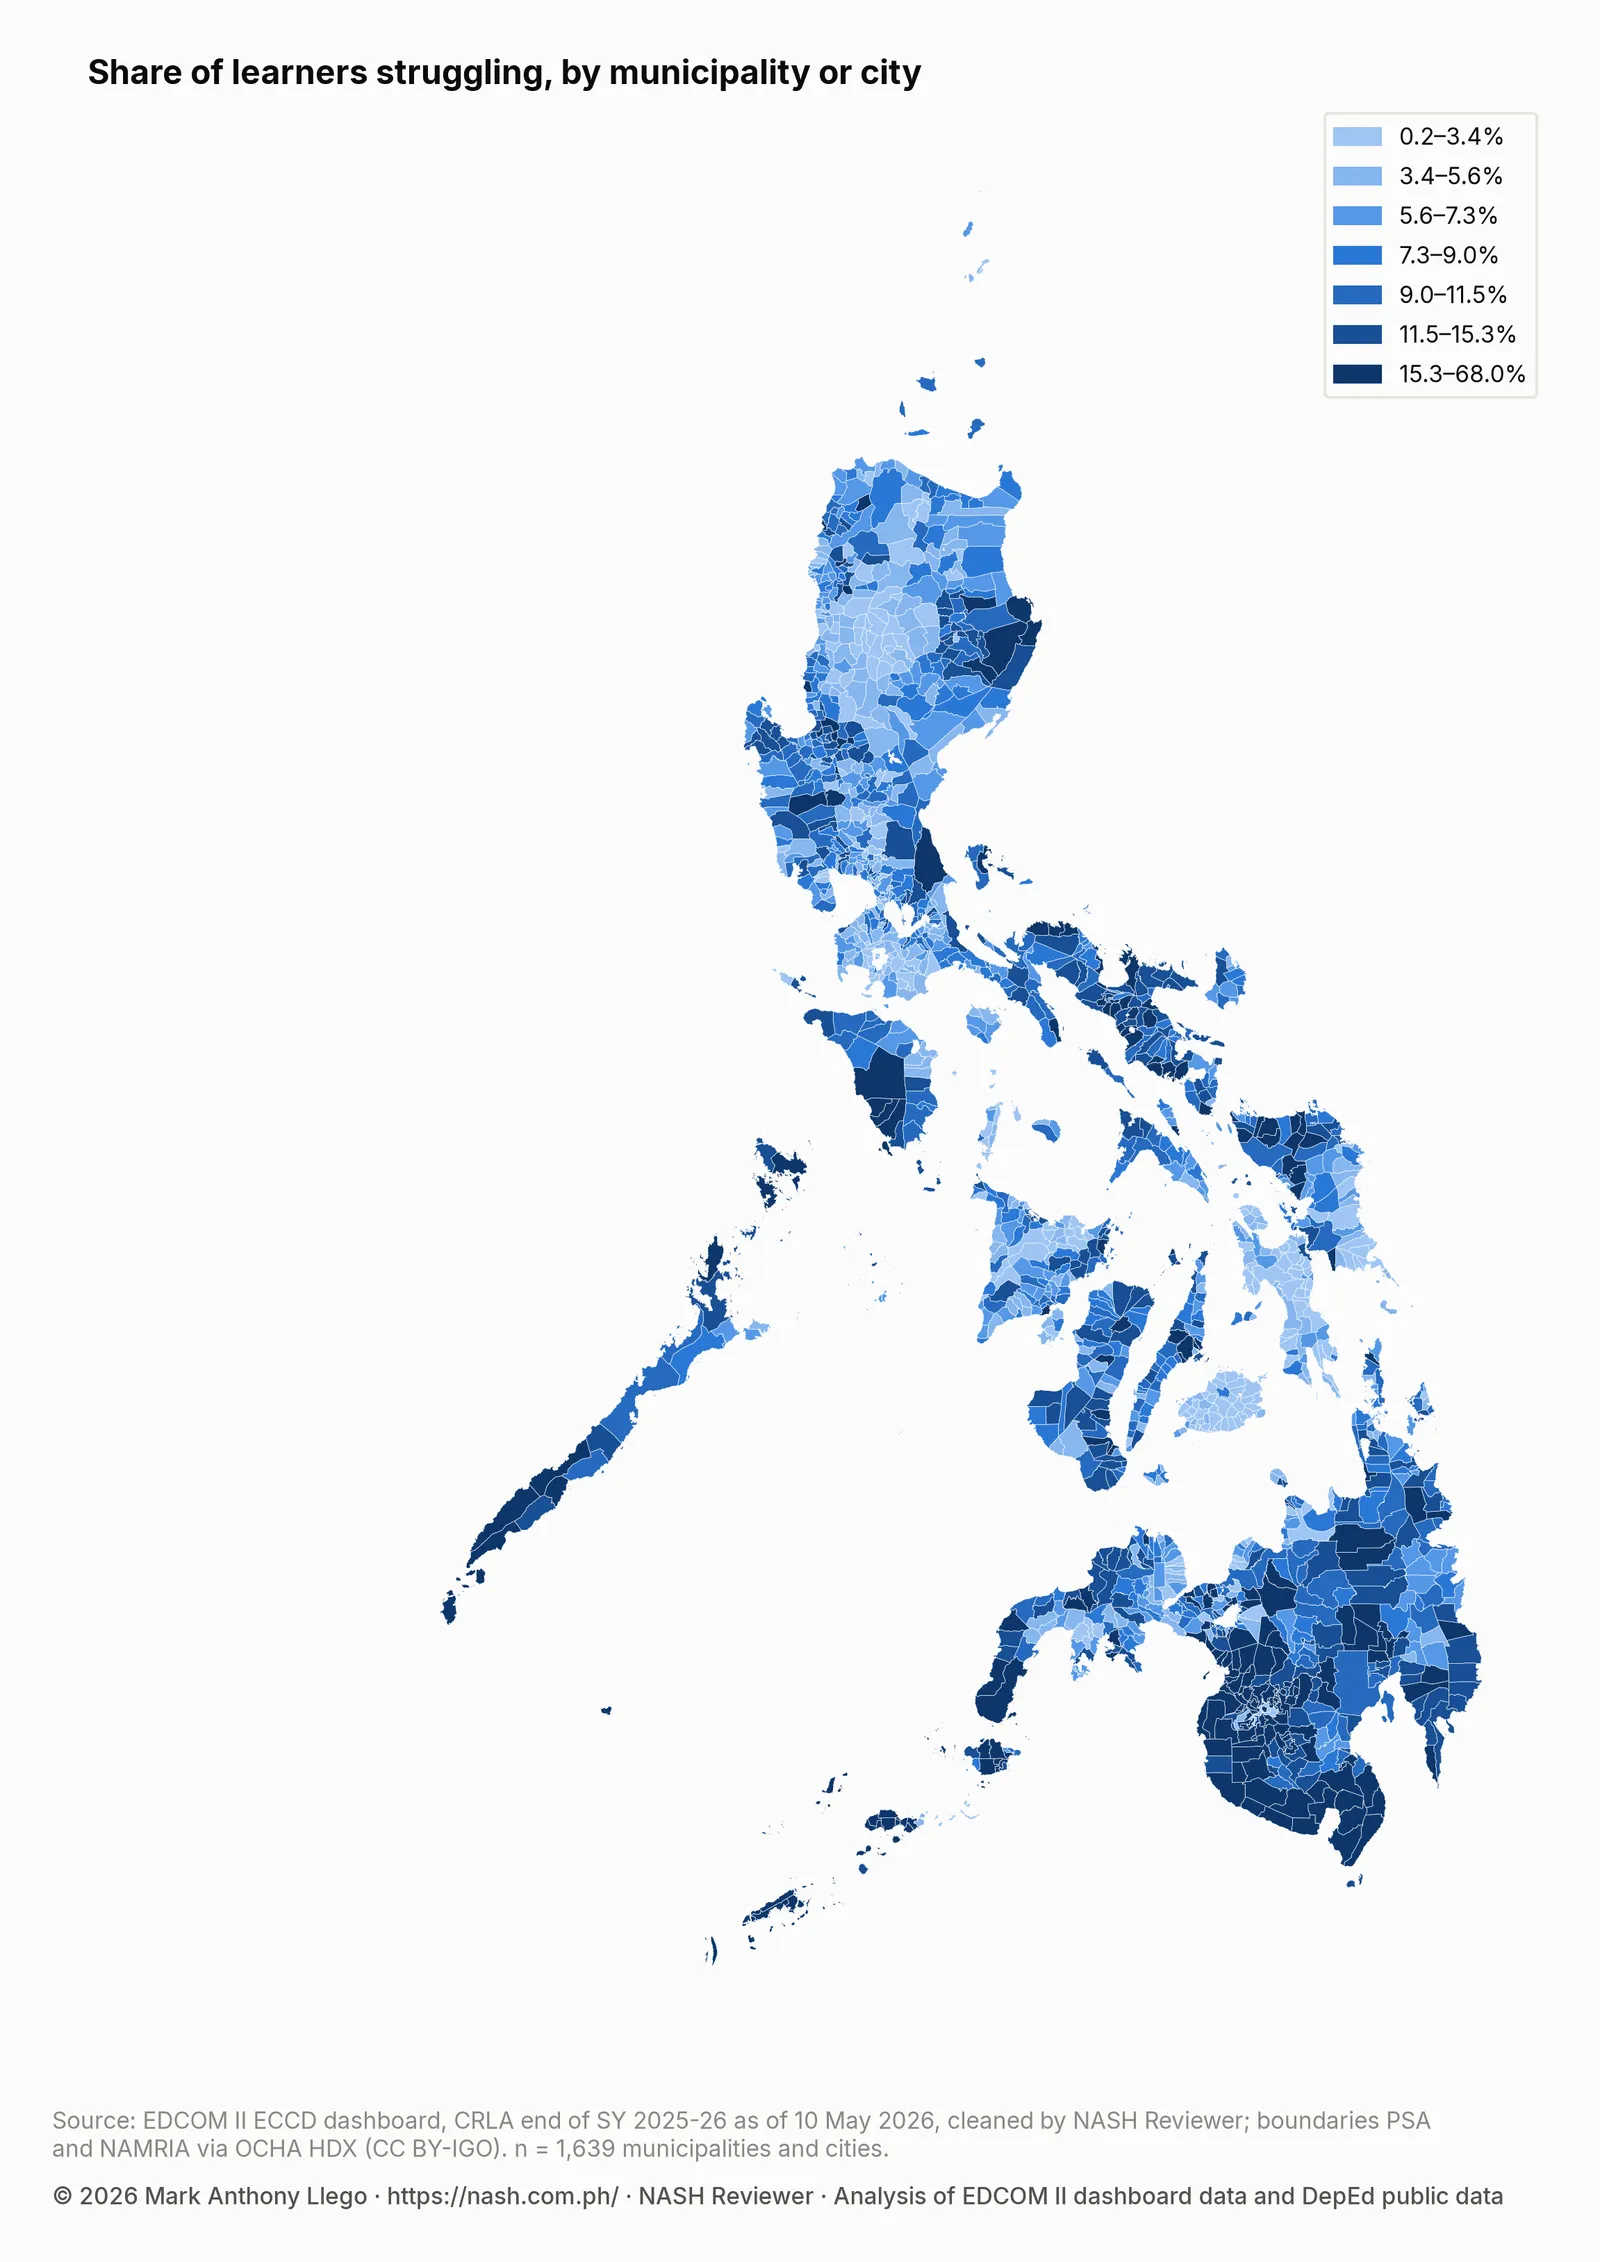
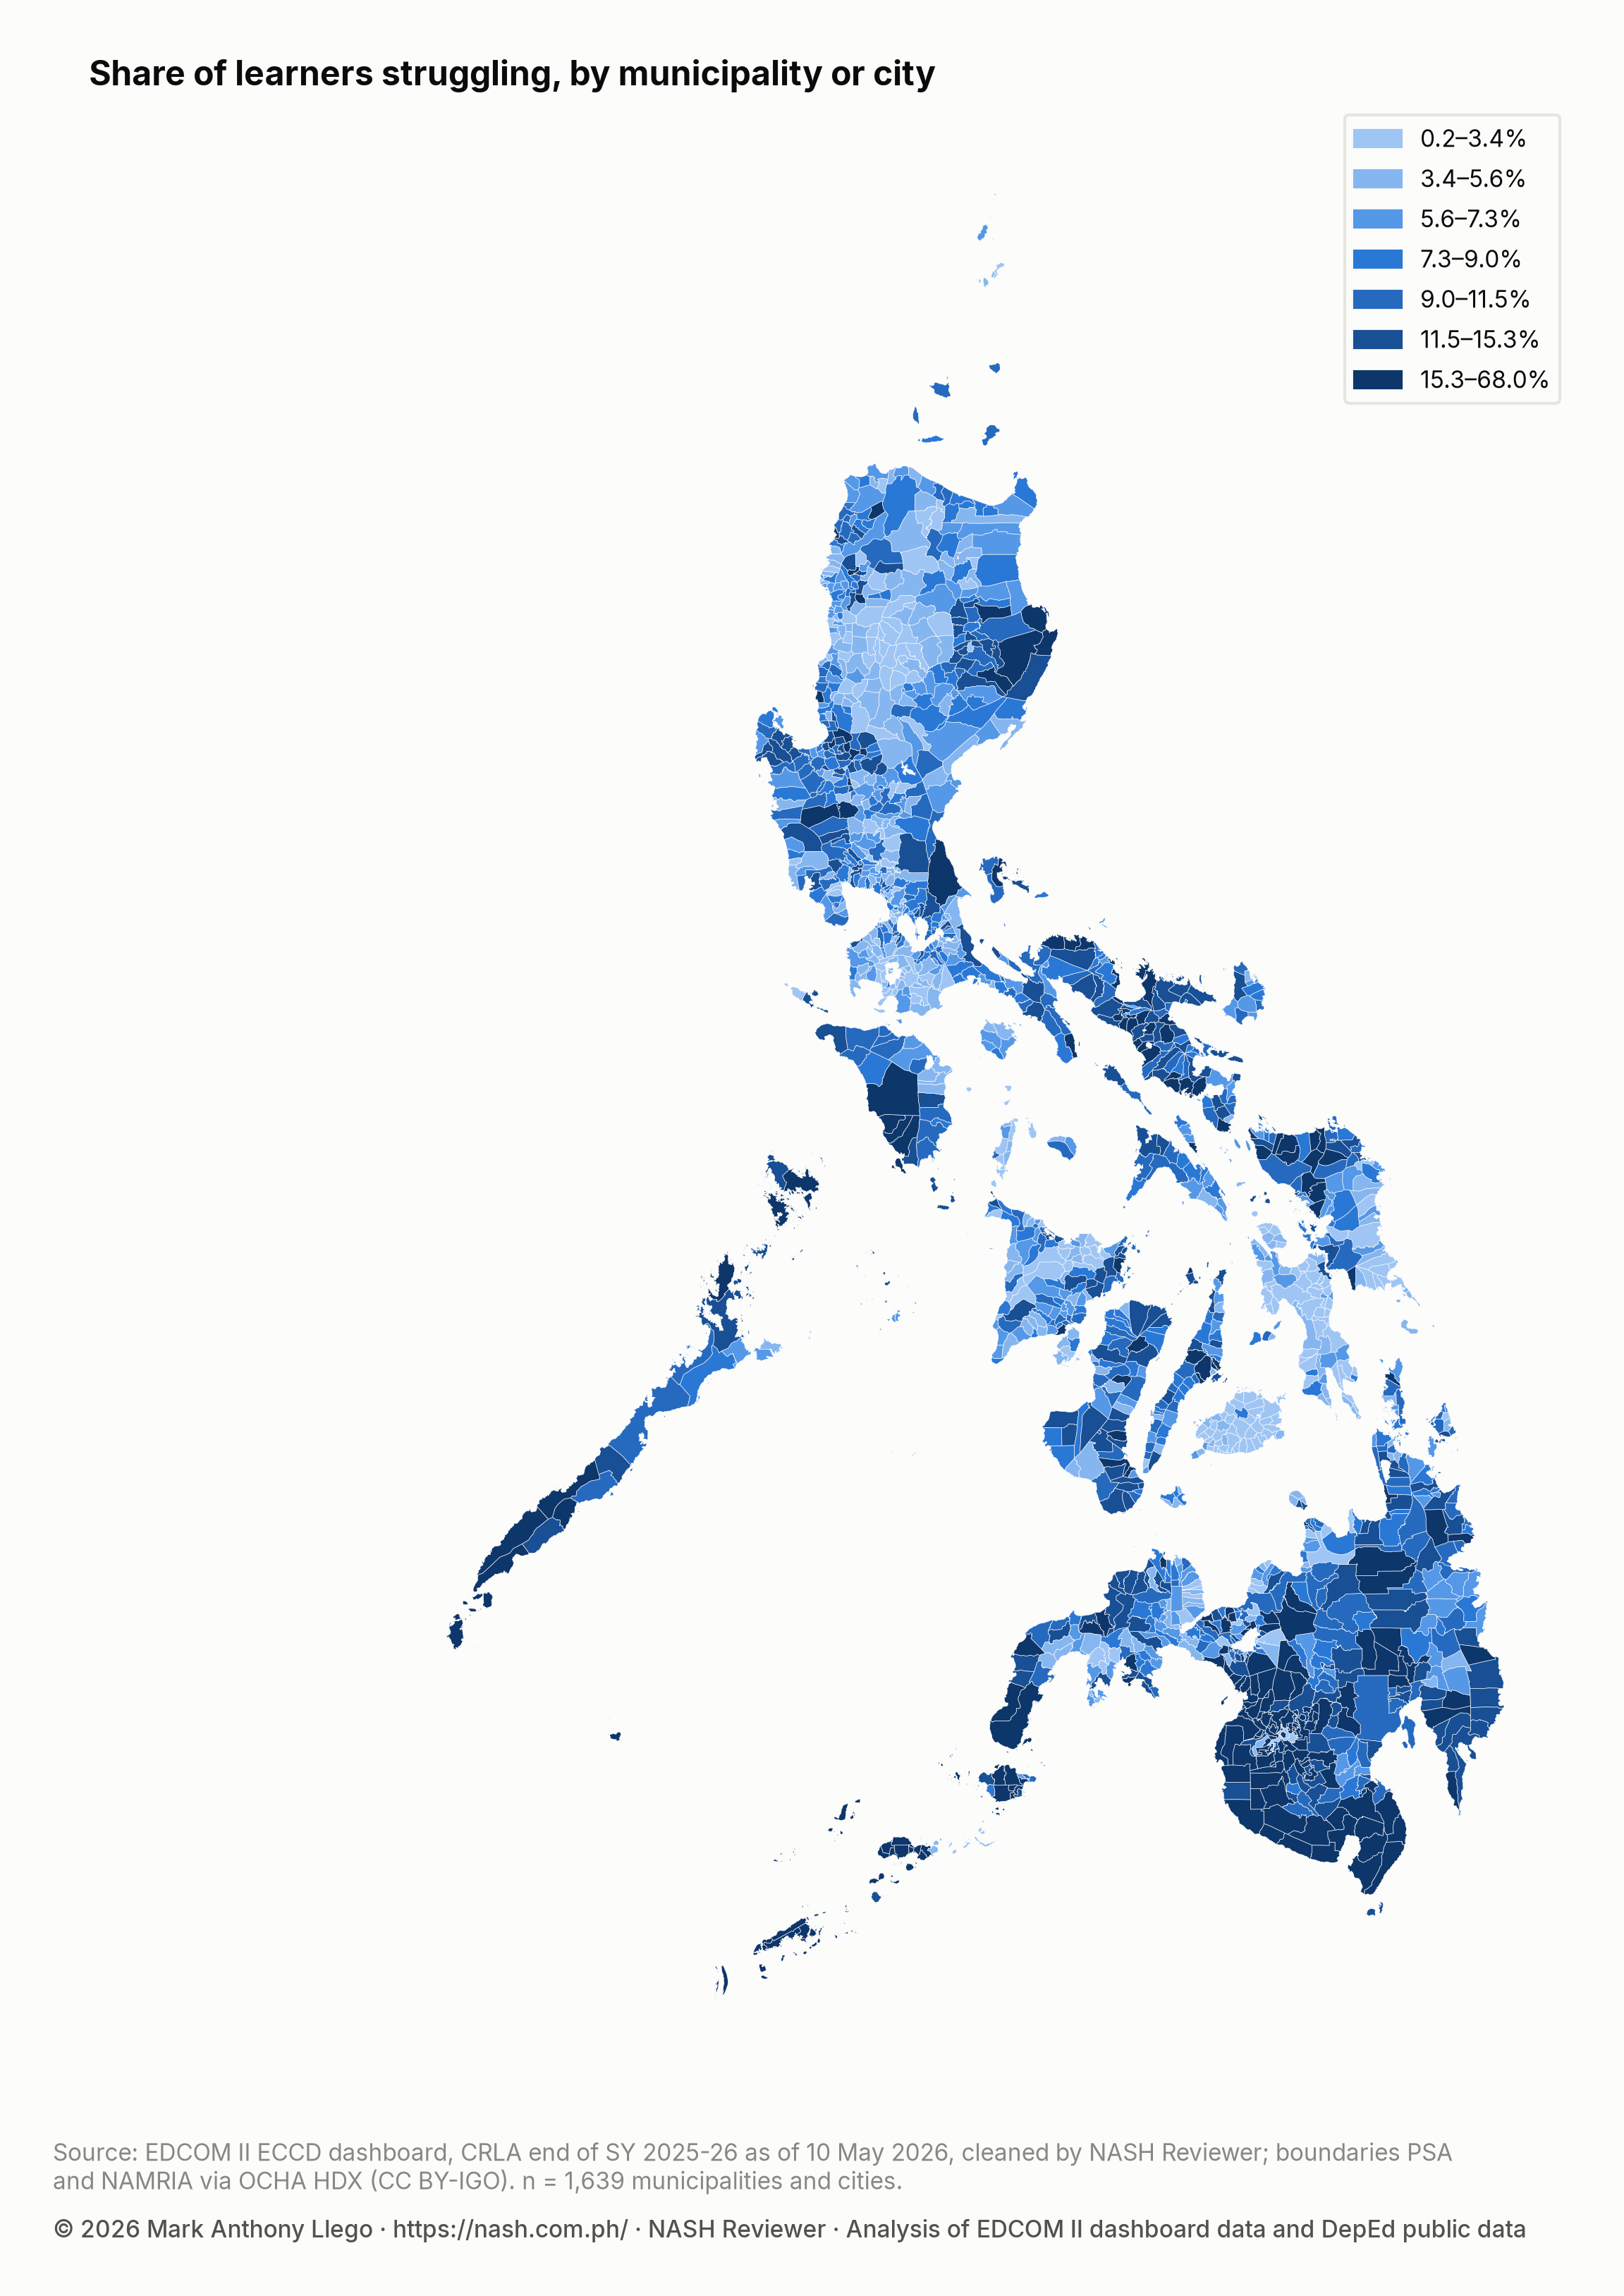
The darker shades gather in Mindanao, above all in its central and southern parts and the island provinces to the southwest, with smaller groups in Bicol, Northern Samar and Palawan. The lighter shades gather in the Cordillera and in parts of the Visayas and southern Luzon.
Why the map shows estimates instead of raw shares
A municipality with a few dozen assessed learners can show a very high or very low raw share by chance, because two or three learners more or fewer move its share a great deal. On a map, such places would stand out as patches that mean little, and they could create false clusters or hide real ones.
The estimates use empirical Bayes, a method that pulls each raw share toward the national share by an amount that depends on how many learners stand behind it. Here the pull is as strong as adding about 18.2 learners at the national rate to each place’s own count. A city with thousands of learners keeps almost exactly its raw share, while a small island municipality is pulled further toward the national figure. Real differences stay, and chance swings in the smallest places are damped. Most places have enough assessed learners that their estimates stay close to their raw shares. The same idea is behind the school estimates in How to Read a School’s CRLA Results Fairly.
How much neighboring municipalities resemble each other
Moran’s I is the standard measure of spatial autocorrelation, a technical name for how much neighbors resemble each other. It compares each municipality’s estimated share with the average share of its neighbors, across the whole map at once. On this scale, zero means no pattern: neighbors are no more alike than any two places picked at random. A value of 1 means strong clustering, with neighbors nearly as alike as they can be.
Moran’s I for the estimated shares is 0.65, a strong pattern. To check that it is not a fluke, the shares were shuffled at random across the municipalities in 9,999 permutations, and Moran’s I was computed for each shuffled map. The permutation p-value is 0.0001, the smallest that 9,999 permutations can give, so no shuffled map was as clustered as the real one. The observed value sits 37.5 standard deviations above the average of the shuffled maps (its z-score).
As a check, a version of Moran’s I built for rates works from the raw counts of struggling readers and learners and allows for the different sizes of places (the Assunção–Reis adjustment). It gives 0.65, the same as the first measure, so the clustering does not come from the way the estimates were made.
Where the CRLA reading hotspots are
Moran’s I says that clustering exists, but not where. To find the places, the analysis uses local Moran’s I, also called LISA (local indicators of spatial association). For each municipality, LISA asks whether the place’s own share, taken together with the average of its neighbors, is more unusual than chance would produce. If it is, the place falls into one of four types:
- High-high: a high share surrounded by high shares, the core of a hotspot.
- Low-low: a low share surrounded by low shares, the core of a cold spot.
- High-low: a high share among neighbors with low shares.
- Low-high: a low share among neighbors with high shares.
“High” and “low” are relative to the average across all municipalities. Testing every municipality one at a time raises a problem: with 1,639 separate tests, dozens of places would look unusual by chance alone. The analysis therefore applies the Benjamini–Hochberg procedure at FDR 5% (q = 0.05) across all municipalities. One caution about that setting: each local test is one-sided, asking only whether a place is unusual in the direction its own share already points, which is the default in the GeoDa and PySAL software. Applied to one-sided tests, FDR 5% is a looser bar than the same setting on two-sided tests, roughly twice as loose, so read the flagged places as worth a closer look rather than as proven clusters. Without that correction, 425 places would have passed the local test.
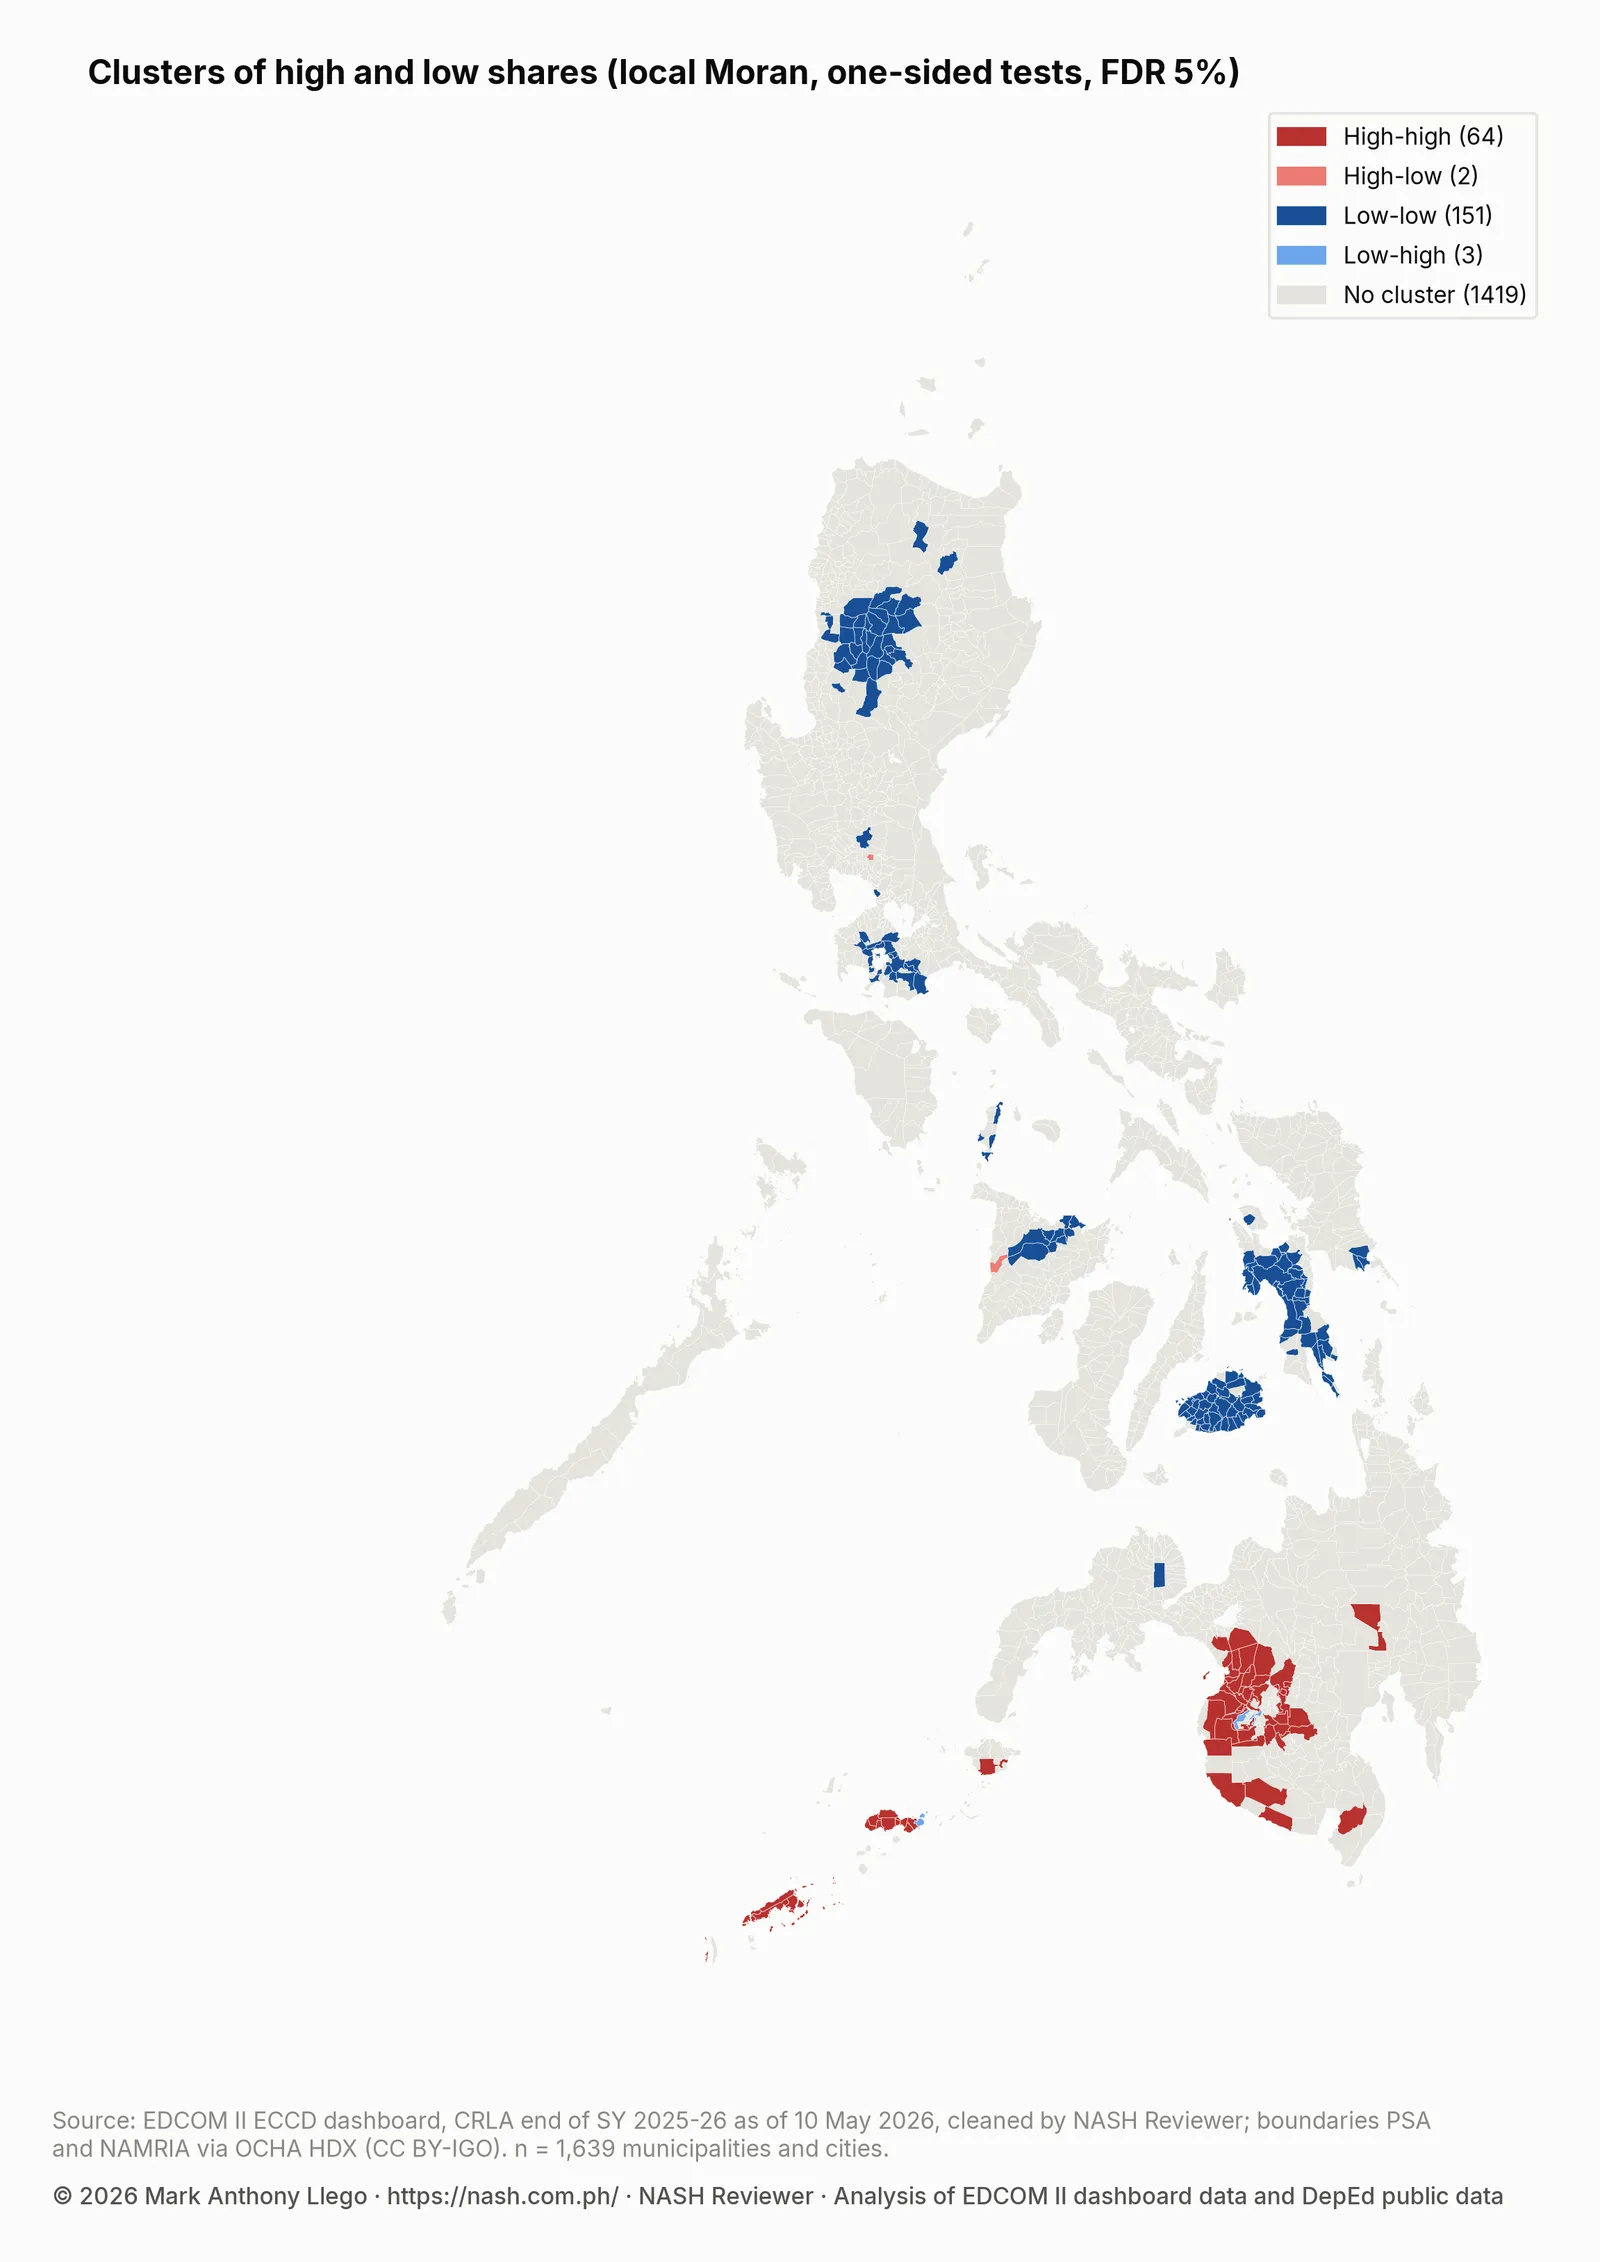
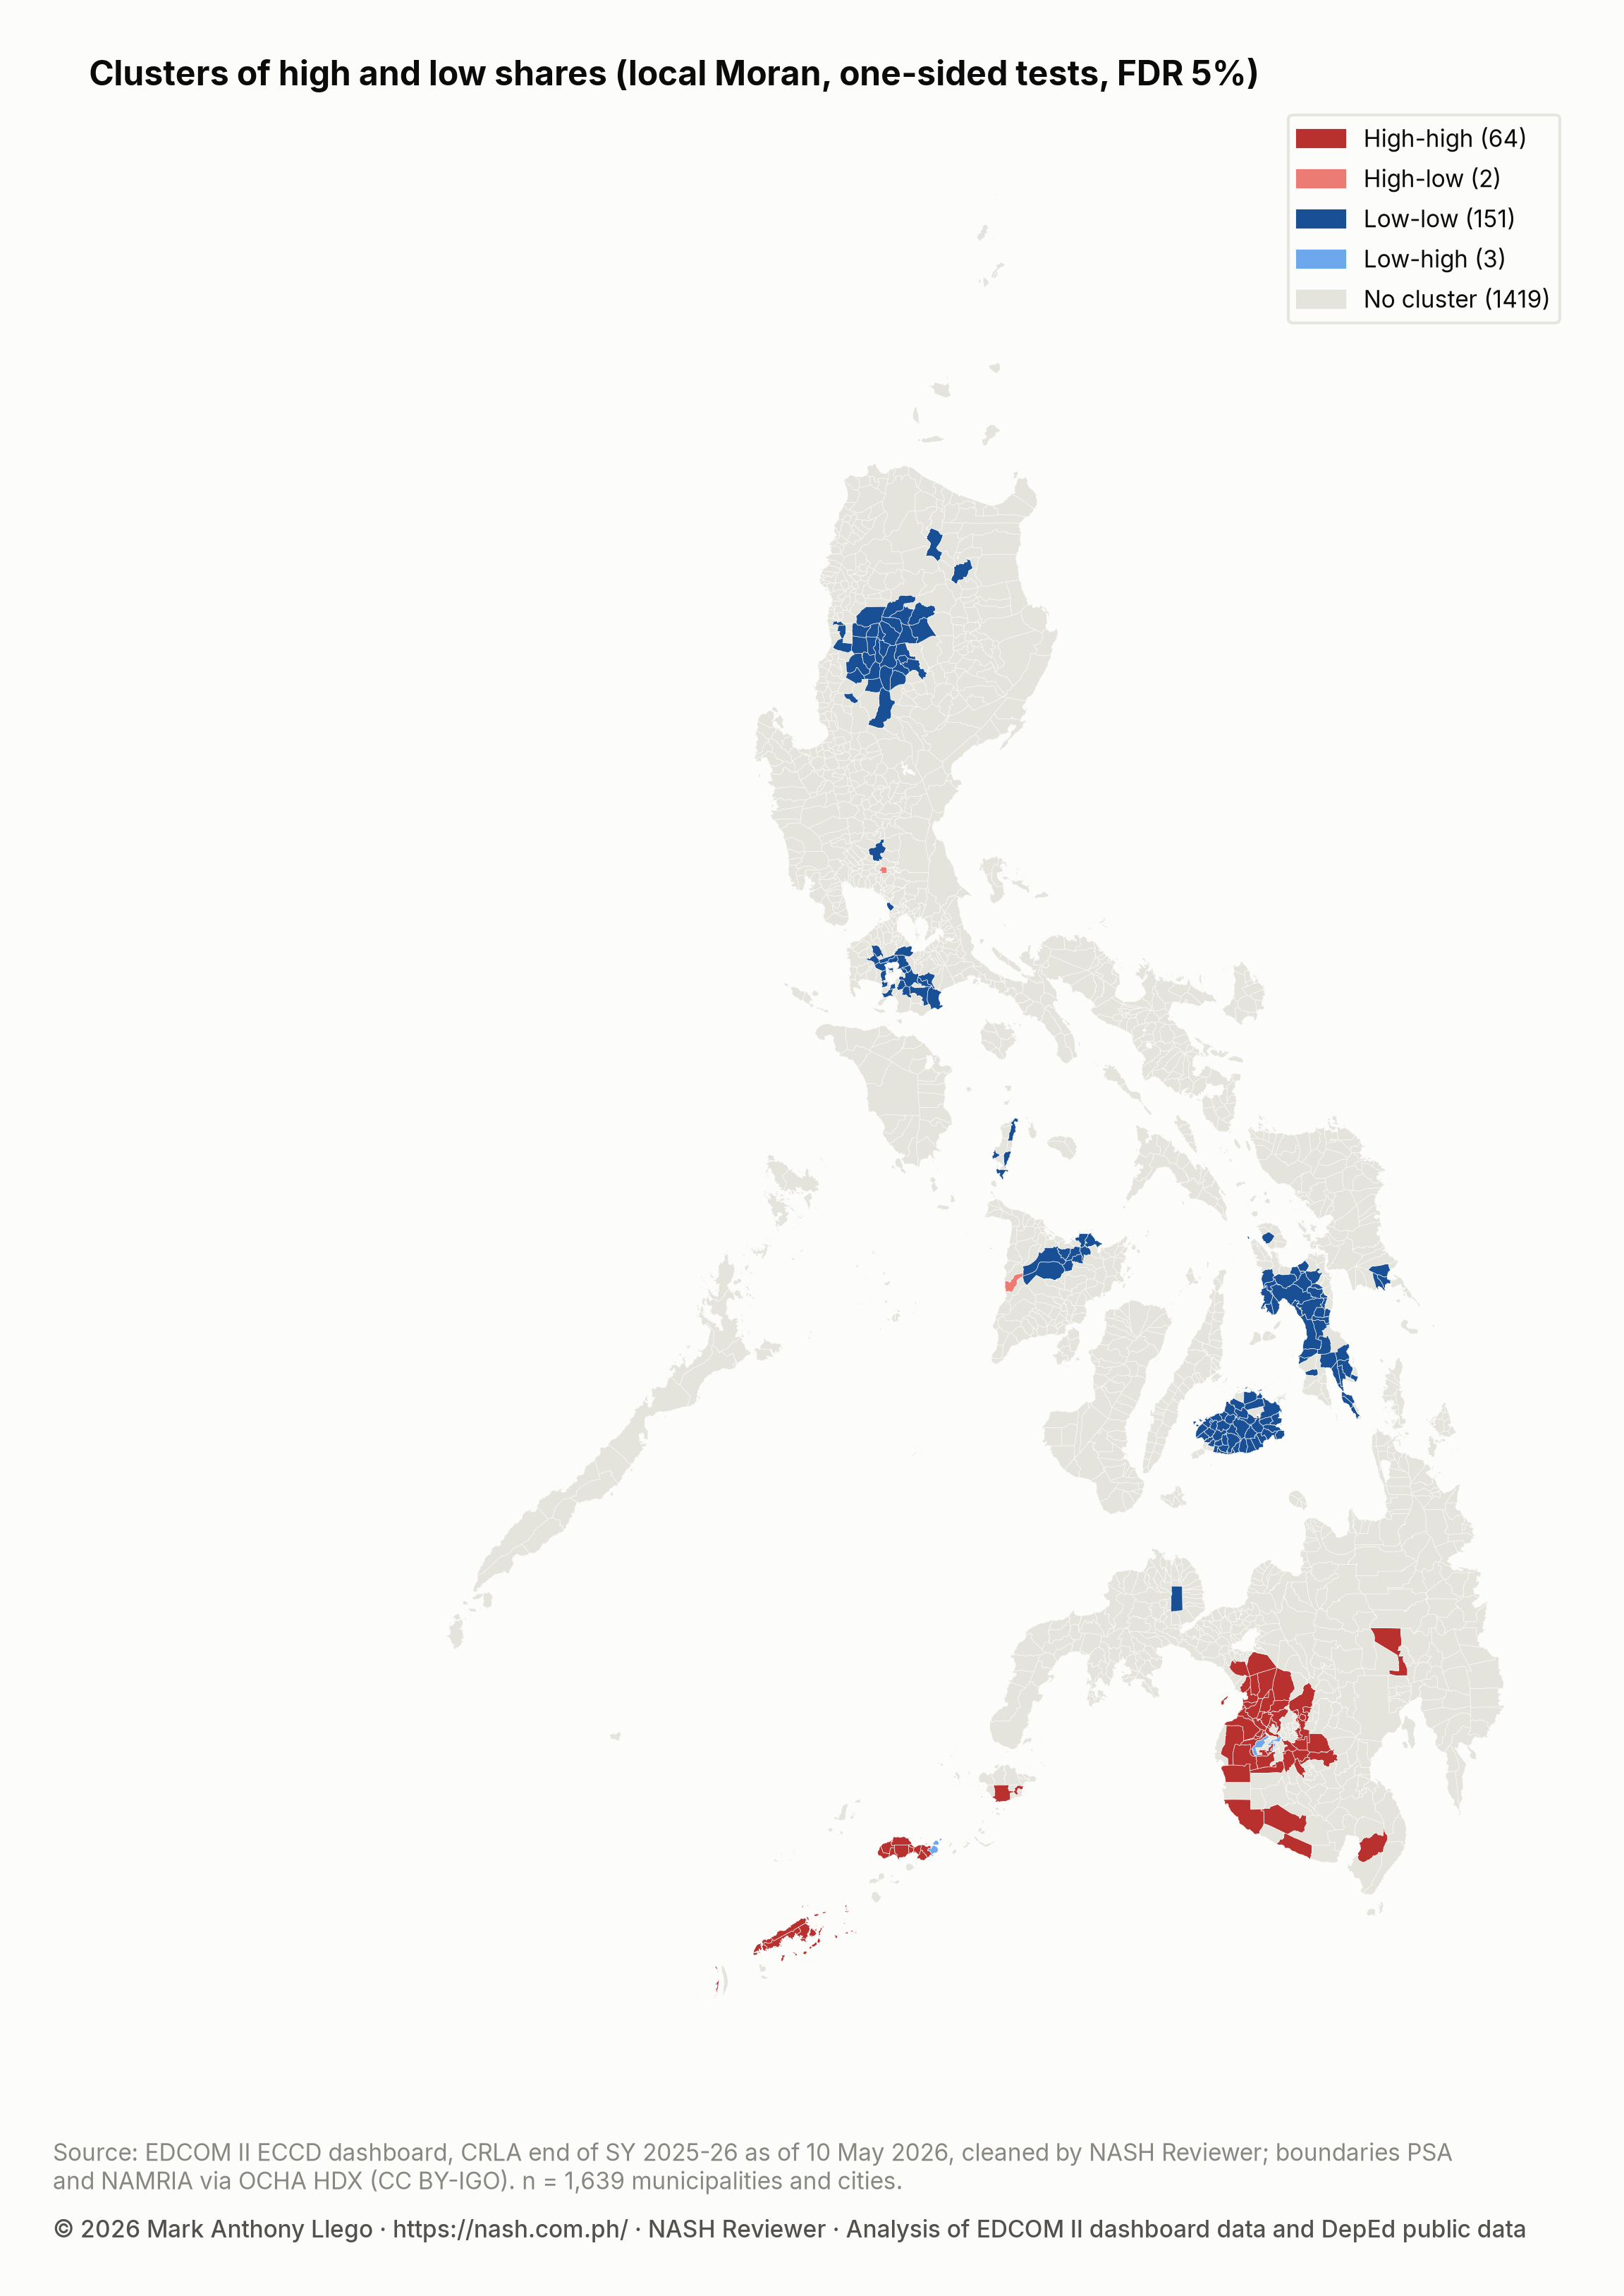
After the correction, 64 municipalities are high-high, 151 are low-low, 2 are high-low and 3 are low-high. The remaining 1,419 show no local pattern the test can separate from chance.
High-high clusters: where struggling readers concentrate
The high-high municipalities are in BARMM (38), Region XII (15), Region IX (10), Region XI (1). The provinces with the most are Maguindanao del Sur (12), Maguindanao del Norte (12), Sulu (10), Cotabato (North Cotabato) (7), Tawi-Tawi (7), Sultan Kudarat (5). Sulu is counted in Region IX, following the PSGC regions. On the map, the largest block covers central Mindanao and crosses the border between BARMM and Region XII, and smaller groups sit on the islands of Basilan, Sulu and Tawi-Tawi and along the southern coast of Region XII.
Together these places have 49,374 struggling readers, 9.6% of the national total, although they hold only 3.5% of assessed learners. Pooling their learners, 27.3% are struggling readers, against 4.3% in the low-low places and 10.0% nationally. Regionally, the highest share is in BARMM (23.4%), and Region XII stands at 17.7%. The cluster map adds that within these regions the high shares sit together in particular areas rather than evenly. The regional reports for BARMM, Region XII and Region IX cover these regions in more detail.
Low-low clusters: where shares are low together
The 151 low-low municipalities are spread over more of the country. The provinces with the most are Bohol (41), Leyte (27), Batangas (14), Mountain Province (9), Capiz (9), Southern Leyte (9). On the map they form large blocks in Bohol, in Leyte and Southern Leyte, in the Cordillera, in Batangas and in Capiz. The reports for Region VII, Region VIII, CAR and Region IV-A cover these areas.
Places that differ from their neighbors
Only 2 municipalities are high-low and 3 are low-high. The low-high places sit inside the high-high areas in BARMM and Region IX. They are worth a closer look, both for what their schools may be doing and as a data check, since an unusually low share can also reflect how the screen was given or recorded.
A second test: Getis-Ord Gi* hot spots and cold spots
Getis-Ord Gi* is a different hotspot test. It takes each municipality together with its neighbors as one group and asks whether the group’s average share is unusually high (a hot spot) or unusually low (a cold spot). It cannot pick out places that differ from their neighbors, but it is a useful check on LISA. With the same Benjamini–Hochberg correction, Gi* finds 66 hot spots and 153 cold spots, close to the LISA counts, and 100.0% of the high-high municipalities are also Gi* hot spots.
The table counts each cluster type and the Gi* hot spots by region, with the regions that have the most high-high places first.
| Region | Municipalities and cities | High-high | Low-low | High-low | Low-high | Gi* hot spots |
|---|---|---|---|---|---|---|
| BARMM | 107 | 38 | 0 | 0 | 2 | 40 |
| Region XII | 49 | 15 | 0 | 0 | 0 | 15 |
| Region IX | 89 | 10 | 0 | 0 | 1 | 10 |
| Region XI | 49 | 1 | 0 | 0 | 0 | 1 |
| CAR | 77 | 0 | 26 | 0 | 0 | 0 |
| MIMAROPA | 73 | 0 | 4 | 0 | 0 | 0 |
| Region I | 125 | 0 | 5 | 0 | 0 | 0 |
| Region II | 93 | 0 | 3 | 0 | 0 | 0 |
| NIR | 63 | 0 | 0 | 0 | 0 | 0 |
| NCR | 17 | 0 | 1 | 0 | 0 | 0 |
| Region IV-A | 142 | 0 | 20 | 0 | 0 | 0 |
| Region III | 130 | 0 | 1 | 1 | 0 | 0 |
| Region V | 114 | 0 | 0 | 0 | 0 | 0 |
| Region VI | 101 | 0 | 9 | 1 | 0 | 0 |
| Region VIII | 143 | 0 | 40 | 0 | 0 | 0 |
| Region VII | 101 | 0 | 41 | 0 | 0 | 0 |
| Region X | 93 | 0 | 1 | 0 | 0 | 0 |
| Caraga | 73 | 0 | 0 | 0 | 0 | 0 |
The table and the first map together show why a dark shade is not the same as a hotspot. Region V has many municipalities in the darkest class of the rate map but no high-high cluster. A place is high-high only when its own share and its neighbors’ shares are both high enough to pass the corrected test; high places scattered among middling neighbors are not.
What this means for school heads
Clusters point to shared conditions that cross municipal and division borders. When high shares sit together across several municipalities, and in central Mindanao across two regions, the reasons are unlikely to lie in any one school. They may include the languages learners speak at home, household poverty, child health and nutrition, distance to school, or how teachers are trained and supported. The map does not say which. Stunting, Day Care Centers and Early Reading looks at two of these, comparing the same municipal shares with stunting among young children and with barangays that have no child development center.
A school head in a high-high area can read the school’s results as part of a wider pattern, not as a school problem alone. It helps to compare notes with schools across the municipal and division line that face the same conditions. Shared learning action cells and common reading materials in the learners’ home language are the kinds of responses a cluster invites.
For division planners, a cluster that spans several divisions calls for a coordinated response rather than separate plans. Divisions in the same cluster can set common reading targets, share coaches and materials, and work with the LGUs whose local school boards fund programs in the same places. Where a cluster crosses a regional boundary, as in central Mindanao, the coordination has to cross regional offices too.
Neighboring divisions with low shares, as in Bohol and Leyte, are natural places to learn from, though a low share can also reflect how the screen was given and is worth checking before a practice is copied.
The map is a starting point, not a verdict. It shows where to look first; it does not grade a municipality, a division or a school. Pair it with the school and division figures in Where Struggling Readers Are Concentrated, on how struggling readers are spread across schools and divisions, and with what teachers know about their own learners.
How these numbers were made
The CRLA counts come from the EDCOM II early-childhood dashboard. Municipal and city boundaries are the PSA and NAMRIA polygons distributed through OCHA’s Humanitarian Data Exchange (HDX) under a CC BY-IGO license. Of the 1,642 polygons, 3 have no assessed school and are left out, which leaves 1,639 places on the map.
Each school was placed in its municipality’s polygon through its municipality code, and 100.00% of assessed learners are in a matched place. The City of Manila is a single polygon, so the schools of its districts are pooled into one place.
Two places count as neighbors when they share a border or a corner, and each place’s neighbors count equally in its neighbor average. 47 island municipalities share no border with any other place, so each was joined to its nearest neighbor and every place has at least one. On average a place has 4.7 neighbors.
Moran’s I, its rate-adjusted version, LISA and Gi* were computed with the PySAL spatial statistics libraries, each with 9,999 permutations. For LISA and Gi*, each pseudo p-value counts the permutations at least as extreme as the observed value on its own side (the folded, one-sided convention of GeoDa and PySAL), and the Benjamini–Hochberg procedure at FDR 5% was applied to those p-values across all municipalities at once, not region by region.
Limits
The results are about places, not children. A high-high municipality has many learners who read well, and a low-low one has struggling readers too. This comparison between places is called ecological, and its patterns do not carry over to a particular child or school.
Boundaries shape the result. Municipal borders are administrative lines, and the same data grouped by barangay, district or division could show clusters of a different size or shape. Schools are placed where they stand, so learners who cross a border to attend school count in the school’s municipality.
The map shows one school year, SY 2025-26, and cannot tell whether the clusters were there before or will persist. Because teachers give the CRLA and divisions train and supervise them, a cluster that follows a division line may partly reflect how the screen was given; such patterns call for a data check, not a conclusion.
The cluster test depends on the neighbor definition. Neighbors defined by distance, or by a fixed number of nearest places, could move municipalities at the edge of a cluster in or out, and the island links are a choice. The false discovery rate control limits false alarms on average, so a few flagged places may still be chance, and places that were not flagged are not shown to be typical.
Frequently asked questions
What is a CRLA reading hotspot?
Here, a hotspot is a municipality or city with a high estimated share of struggling readers whose neighbors also have high shares, a combination the local Moran test finds unlikely to be chance after correction for testing many places. There are 64 such high-high places.
Which provinces have the most clusters of struggling readers?
The provinces with the most high-high municipalities are Maguindanao del Sur (12), Maguindanao del Norte (12), Sulu (10), Cotabato (North Cotabato) (7), Tawi-Tawi (7), Sultan Kudarat (5). The regions are BARMM (38), Region XII (15), Region IX (10), Region XI (1). For low-low clusters, the provinces with the most are Bohol (41), Leyte (27), Batangas (14), Mountain Province (9), Capiz (9), Southern Leyte (9).
What does Moran’s I mean for reading results?
Moran’s I measures how much neighboring places resemble each other, where zero means no pattern and 1 means strong clustering. For the CRLA shares of struggling readers it is 0.65: a municipality’s share says a good deal about the shares next door.
Why is my municipality dark on the map but not a hotspot?
The first map shows each place’s own estimate, while the cluster test also needs the neighbors to be high and the pattern to survive the correction for multiple tests. A dark municipality with middling neighbors is not flagged, which is why Region V has many dark places but no high-high cluster.
Where can I find the estimate for my municipality?
The municipal table in the download below lists every municipality and city with its learners, struggling readers, estimate, and LISA and Gi* results. The estimate describes the place, not any one school.
Download the data
The cleaned EDCOM II dashboard data behind this series are free to download for personal study; to reuse them, email support@nash.com.ph for written permission first. How the EDCOM Dashboard Data Was Cleaned explains every table and cleaning rule. The files are at data.nash.com.ph: start with the README, then the school table with CRLA results and school inputs (Parquet), the school estimates (CSV), the division estimates (CSV) and the municipal table (CSV). The DepEd school files used for school inputs are described in Download Cleaned DepEd School Data.
Every file, with its rows, columns and checksum, is listed on the EDCOM II CRLA data page. To cite the data: Llego, M. A. (2026). EDCOM II early-childhood dashboard data, cleaned, version 1. NASH Reviewer. https://nash.com.ph/edcom-data
More in this series
- CRLA End-of-Year Results SY 2025-26: All 18 Regions
- CRLA Start vs End of SY 2025-26 in the Same Schools
- CRLA by Language: Mother Tongue, Filipino and English
- How to Read a School’s CRLA Results Fairly
- CRLA Variation: School, Division or Region?
- Where Struggling Readers Are Concentrated
- School Resources and CRLA Reading Results
- CRLA Results in Schools With and Without a Principal
- Action Research and Thesis Topics on Reading (CRLA)
- CRLA Reading Hotspots: A Map of Struggling Readers
- Stunting, Day Care Centers and Early Reading
- Literacy and Nutrition Programs Compared With Need
- CRLA Schools With No Struggling Readers: A Data Check
- How the EDCOM Dashboard Data Was Cleaned
- Regional reports: NCR, CAR, Region I, Region II, Region III, Region IV-A, MIMAROPA, Region V, Region VI, NIR, Region VII, Region VIII, Region IX, Region X, Region XI, Region XII, Caraga, BARMM
- Earlier reports: CRLA Results SY 2025-2026 (DepEd’s selected-school file), Do the Same DepEd Schools Lag on the ELLNA, NAT and CRLA?, DepEd School Inputs vs Test Results, EDCOM II Final Report: Guide for Aspiring School Heads, DepEd Data for Aspiring School Heads: Where to Start
Analysis and charts by Mark Anthony Llego for NASH Reviewer. Data: EDCOM II early-childhood dashboard and Department of Education public datasets. NASH Reviewer is not affiliated with EDCOM II or DepEd. Charts may be reused only with written permission from support@nash.com.ph.