In Region XI (Davao Region), the CRLA results for SY 2025-26 show a shortfall at the top of the reading scale more than at the bottom. At the end of the year, 42.1% of the 274,481 public school learners assessed in Grades 1–3 read at grade level, against 47.6% nationally, and every grade-and-language block trails the national share. The share of struggling readers, 11.7%, is nearer the national 10.0%. It amounts to 32,147 learners and places the region at number 14 of the 18 regions, counting from the fewest struggling readers.
The struggling readers are not spread evenly. Most divisions, Davao City among them, sit near the national share, while Davao del Norte and Davao Occidental are well above it. Davao Occidental also has the region’s highest stunting among young children, and Talaingod in Davao del Norte has the highest estimated municipal share.
Key findings
- 42.1% of the region’s learners read at grade level, against 47.6% nationally, and 11.7% were struggling readers, against 10.0%.
- Every block trails the national share at grade level, by the least in Grade 3 English (-3.9 points) and by the most in Grade 2 Filipino (-7.3 points).
- No division lies outside the national funnel’s 95% limits; those five or more points above the regional share are Davao Occidental (18.5%); Davao del Norte (21.0%).
- The most struggling readers are in Davao City (8,088 struggling readers), a division whose share is below the national figure.
- Kapalong, Davao del Norte is the region’s only municipality in a high-high cluster, and the highest estimated share is in Talaingod.
- Davao Occidental (10.8%) has the region’s highest stunting among children aged 0–2, while only 4.6% of the region’s barangays lack a child development center, against 10.9% nationally.
- Within divisions, more learners per teacher and per classroom and smaller enrollment go with more struggling readers; schools in urban barangays and schools with no functional toilet also had more, associations the national model does not show.
CRLA reading levels by grade and language in Region XI
The Comprehensive Rapid Literacy Assessment (CRLA) is the reading screen DepEd teachers use in Grades 1–3. Each learner lands at one of five levels; those at Low Emerging and High Emerging are the struggling readers. The table shows the share at each level for the five grade-and-language blocks, then for the region and the country.
| Grade and language | Learners | Low Emerging | High Emerging | Developing | Transitioning | At Grade Level | Struggling |
|---|---|---|---|---|---|---|---|
| Grade 1 Mother Tongue | 81,877 | 9.7% | 7.0% | 16.2% | 27.3% | 39.8% | 16.7% |
| Grade 2 Mother Tongue | 88,238 | 6.6% | 3.2% | 14.2% | 34.3% | 41.8% | 9.8% |
| Grade 2 Filipino | 93,403 | 6.6% | 3.2% | 14.2% | 36.2% | 39.7% | 9.8% |
| Grade 3 Filipino | 99,723 | 5.2% | 2.1% | 8.7% | 39.6% | 44.4% | 7.3% |
| Grade 3 English | 99,201 | 6.6% | 2.7% | 9.6% | 34.8% | 46.2% | 9.4% |
| Region XI, all learners | 274,481 | 7.5% | 4.2% | 13.2% | 33.0% | 42.1% | 11.7% |
| Philippines, all learners | 5,127,670 | 6.9% | 3.1% | 10.4% | 32.0% | 47.6% | 10.0% |
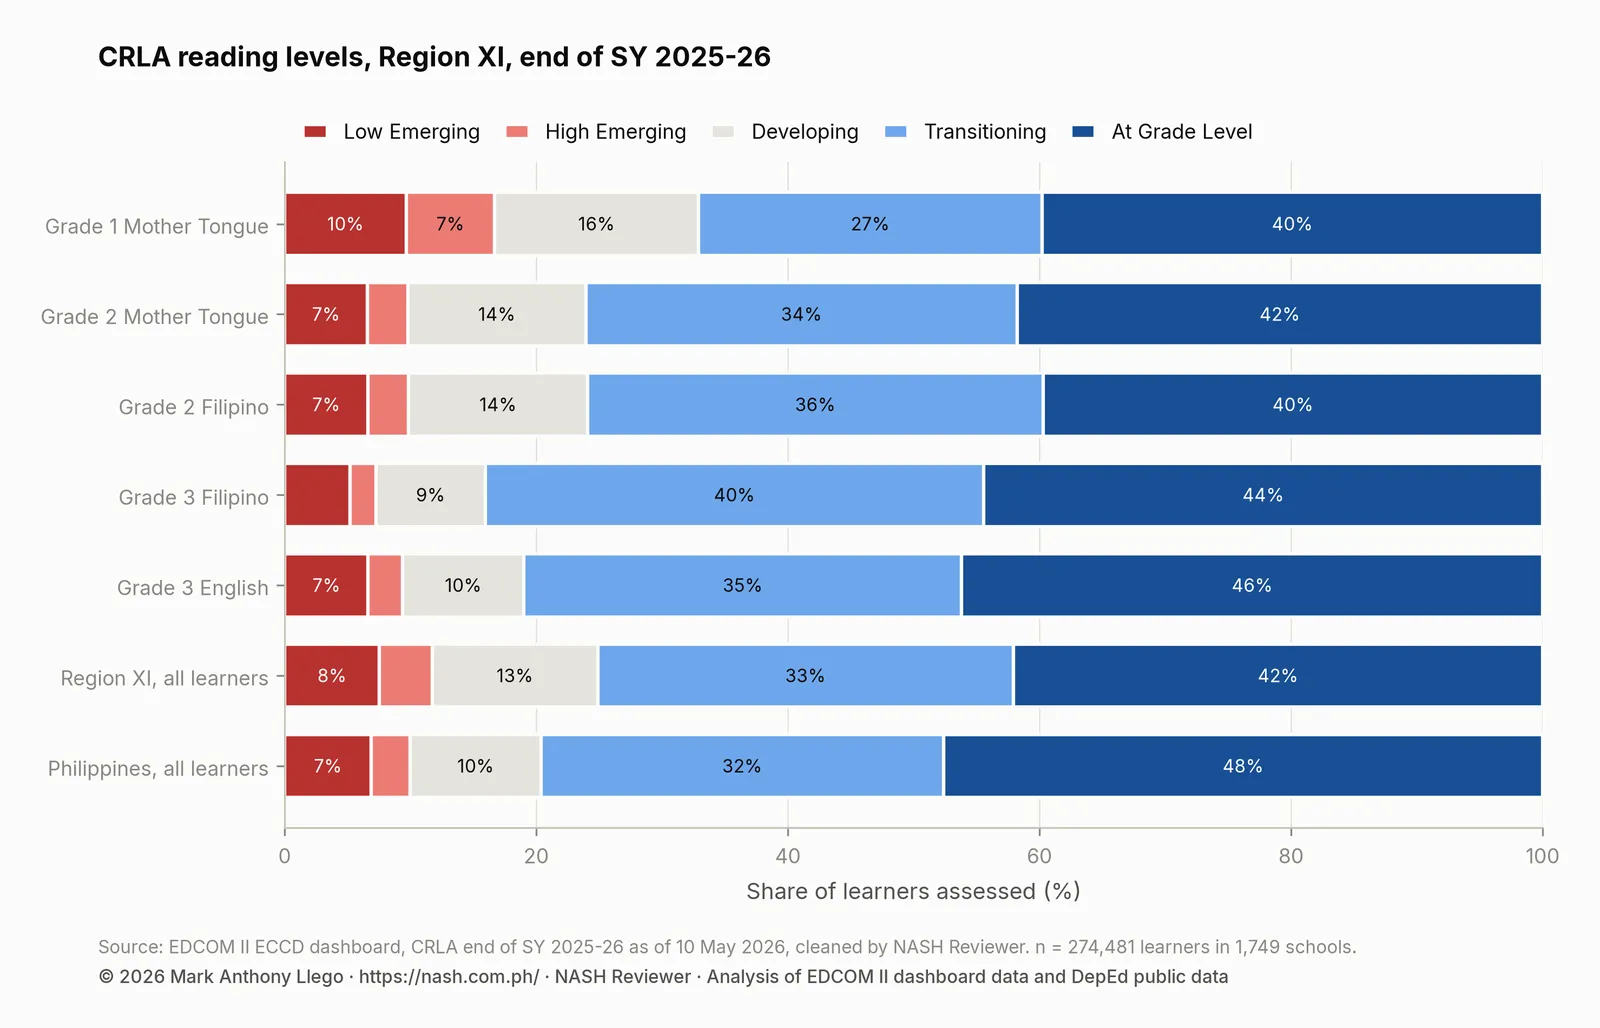
Compared with the country, Region XI has more learners at Developing and Transitioning, the two levels just short of grade level, and fewer at grade level itself. The block furthest behind is Grade 2 Filipino (-7.3 points): 39.7% at grade level, against 47.1% nationally. The closest is Grade 3 English (-3.9 points). In Grade 1 Mother Tongue, 16.7% are struggling readers, against 14.4% for the same block nationally.
Schools divisions in Region XI
The division table gives, for each of the region’s 11 divisions, the share struggling, an empirical Bayes estimate with its 95% interval, a national rank and the funnel result. The empirical Bayes estimate leans a small division’s share toward the national rate, since few learners make a share less reliable. The funnel’s limits show how far a division of a given size can usually sit from the national share.
| Division | Schools | Learners | Struggling readers | Share struggling | Estimate (95% interval) | National rank of 232 (95% interval) | National funnel |
|---|---|---|---|---|---|---|---|
| Davao City | 305 | 87,009 | 8,088 | 9.3% | 9.3% (9.1%–9.5%) | 134 (126–137) | within limits |
| Davao De Oro | 335 | 41,204 | 4,083 | 9.9% | 9.9% (9.6%–10.2%) | 147 (139–150) | within limits |
| Davao Occidental | 174 | 19,001 | 3,509 | 18.5% | 18.5% (17.9%–19.0%) | 218 (216–220) | within limits |
| Davao Oriental | 280 | 25,228 | 3,549 | 14.1% | 14.1% (13.6%–14.5%) | 197 (192–201) | within limits |
| Davao del Norte | 219 | 26,280 | 5,515 | 21.0% | 21.0% (20.5%–21.5%) | 223 (223–223) | within limits |
| Davao del Sur | 221 | 25,281 | 2,429 | 9.6% | 9.6% (9.3%–10.0%) | 138 (131–147) | within limits |
| Digos City | 36 | 10,046 | 920 | 9.2% | 9.2% (8.6%–9.7%) | 129 (112–142) | within limits |
| Island Garden City of Samal | 51 | 6,455 | 665 | 10.3% | 10.3% (9.6%–11.0%) | 151 (139–162) | within limits |
| Mati City | 54 | 8,713 | 1,008 | 11.6% | 11.6% (10.9%–12.2%) | 170 (160–180) | within limits |
| Panabo City | 45 | 10,934 | 1,016 | 9.3% | 9.3% (8.8%–9.9%) | 133 (117–145) | within limits |
| Tagum City | 29 | 14,330 | 1,365 | 9.5% | 9.5% (9.1%–10.0%) | 137 (125–147) | within limits |
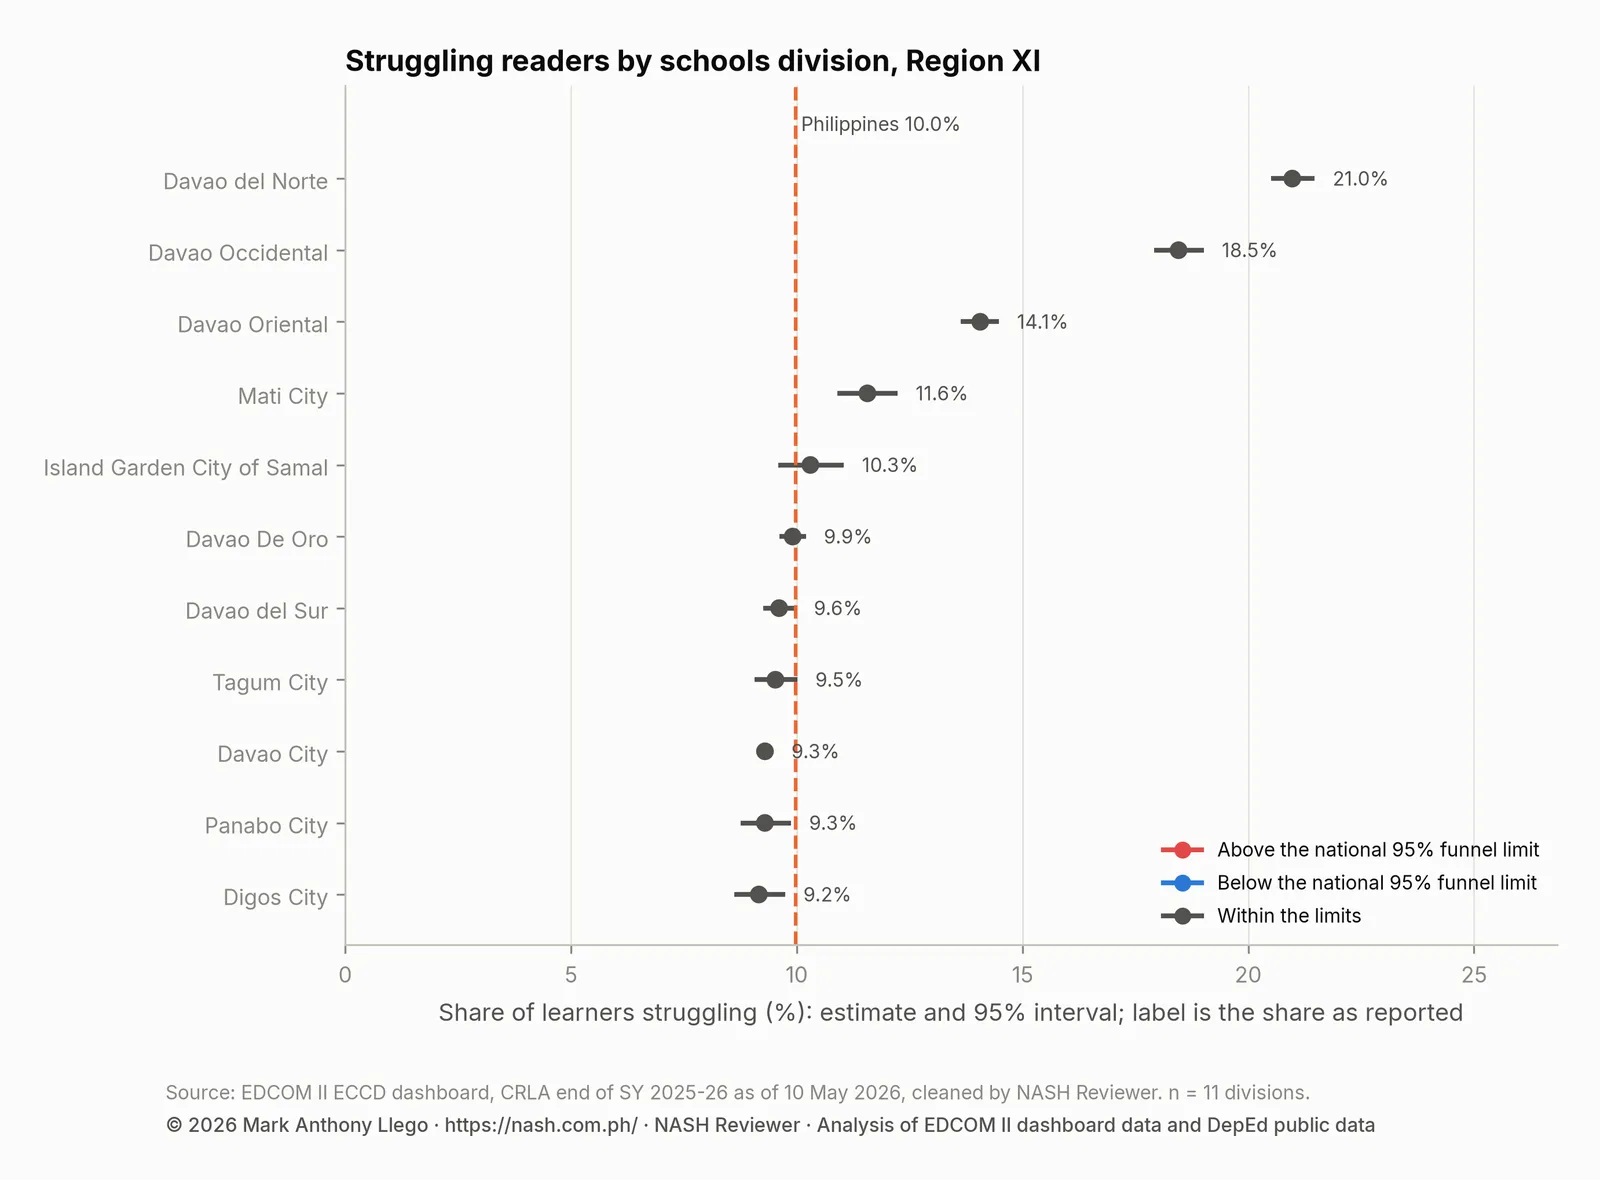
Most divisions, including Davao City, Davao de Oro, Davao del Sur, Panabo City and Tagum City, sit close to the national share, and the lowest, Digos City (9.2%), is only a little below it. The region’s excess sits in a few divisions: Davao del Norte (21.0%), Davao Occidental, Davao Oriental and Mati City. Davao del Norte’s rank interval places it among the divisions with the highest shares of struggling readers in the country, though it stays within the funnel limits.
Division and province figures differ here. The Davao del Norte division excludes Tagum City, Panabo City and the Island Garden City of Samal, which have their own divisions with lower shares, so the province figure in the early-childhood table below is lower than the division’s.
Languages of instruction
Nearly all schools teach in Sinugbuanong Binisaya (96% of schools). The table adds Tagalog and a small group of other languages.
| Language of instruction | Schools | Learners | Share struggling | At Grade Level |
|---|---|---|---|---|
| Sinugbuanong Binisaya | 1,673 | 262,198 | 11.6% | 42.2% |
| Tagalog | 53 | 9,149 | 13.2% | 41.9% |
| Other | 16 | 2,329 | 15.4% | 35.5% |
With so little variety, the Grade 2 comparison says more than the language table. Among learners tested in both languages, the share at grade level in Filipino minus the share in the Mother Tongue is -2.1 points in Region XI and -0.8 nationally. Grade 2 learners in the region did better in the Mother Tongue than in Filipino, by more than the national gap, which fits Grade 2 Filipino being the block furthest behind. Under RA 12027 of 2024, the mother tongue is no longer the medium of instruction in Kindergarten to Grade 3 outside monolingual classes that meet the law’s requirements; CRLA by Language covers the national language results.
Where struggling readers are concentrated in Region XI
The map covers the region’s 49 municipalities and cities, shaded by an estimated share of struggling readers that leans toward the national rate where enrollment is small. It shows places, not children; any one child’s reading can differ from the place’s figure.
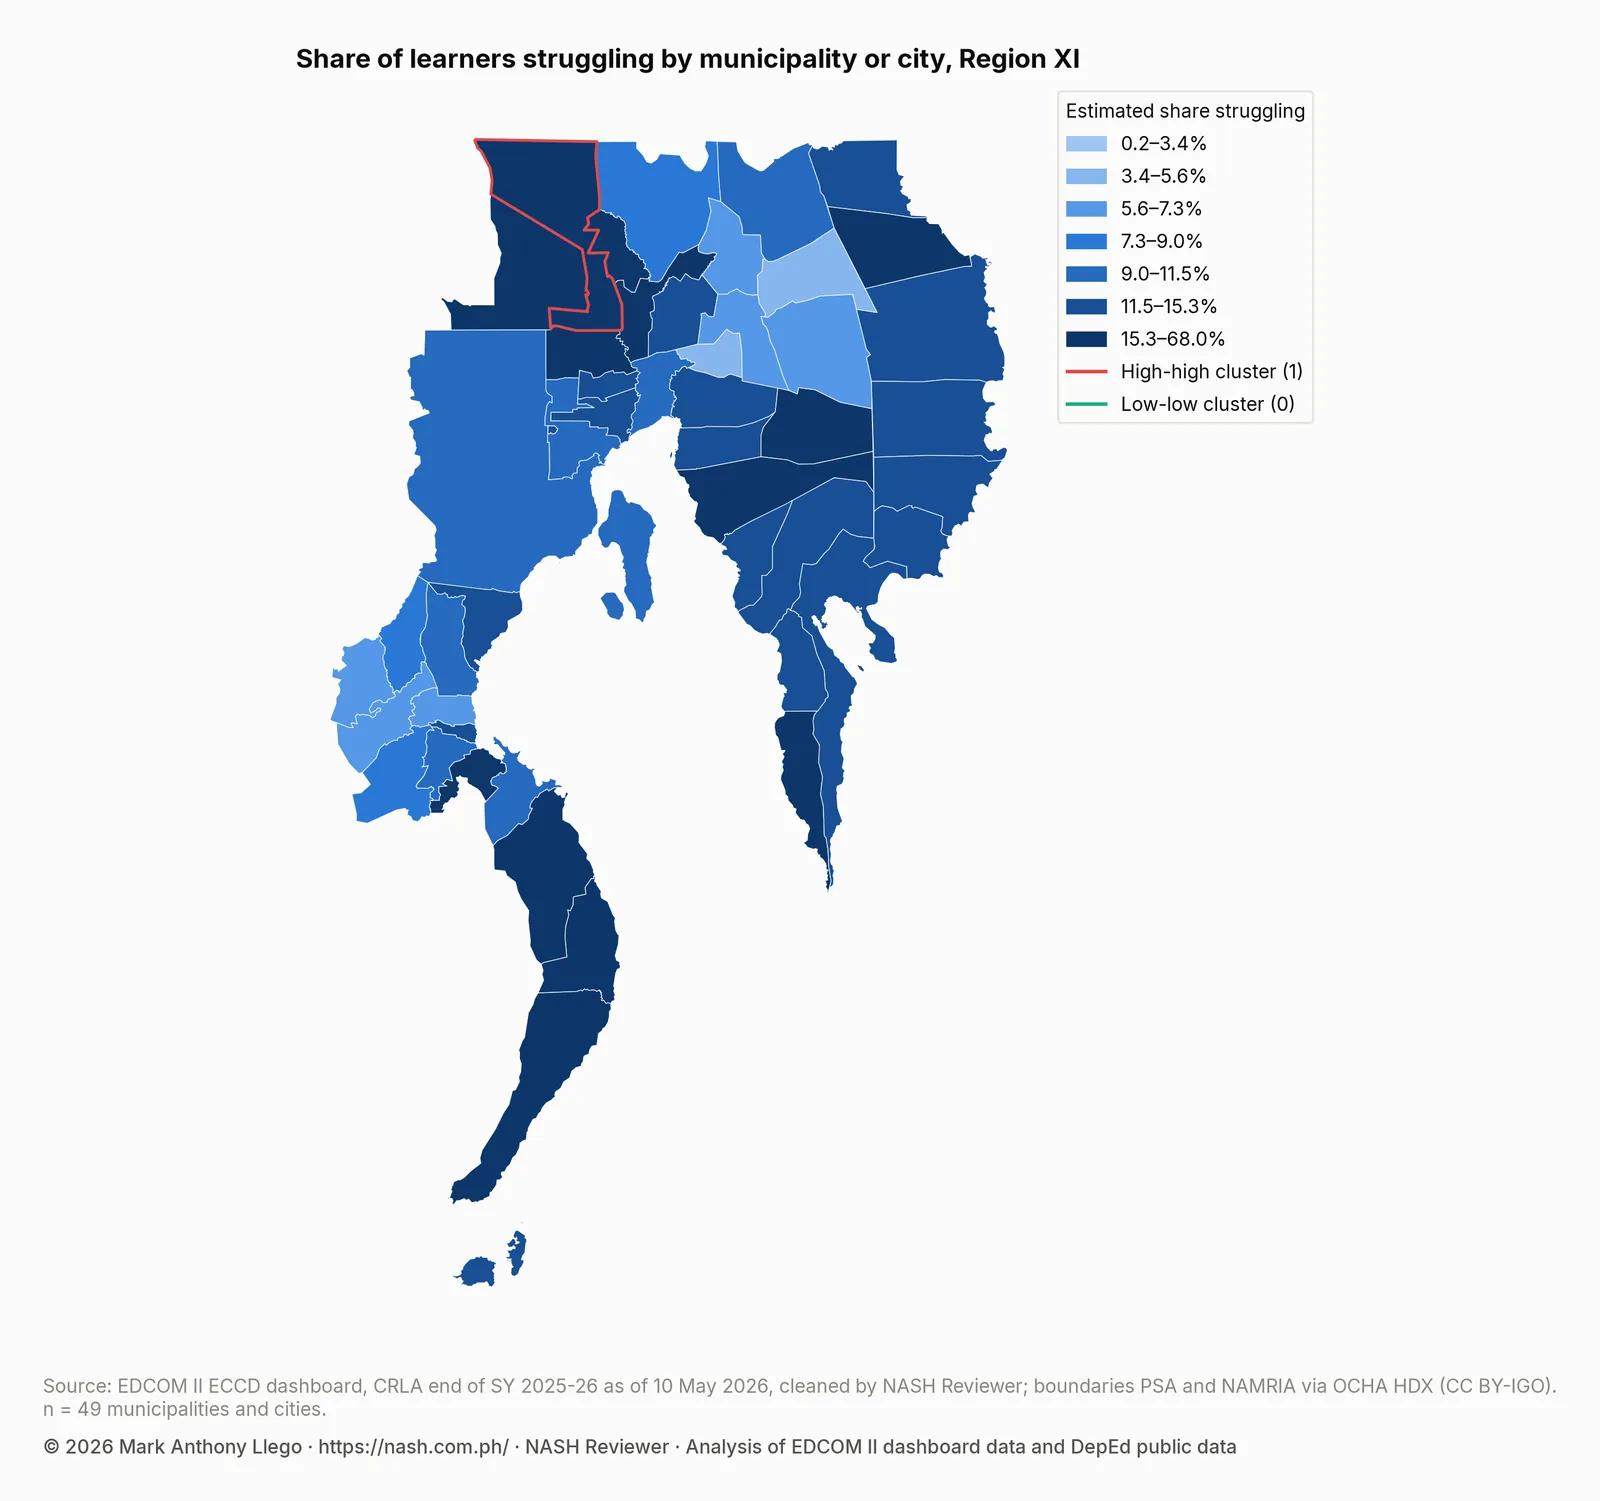
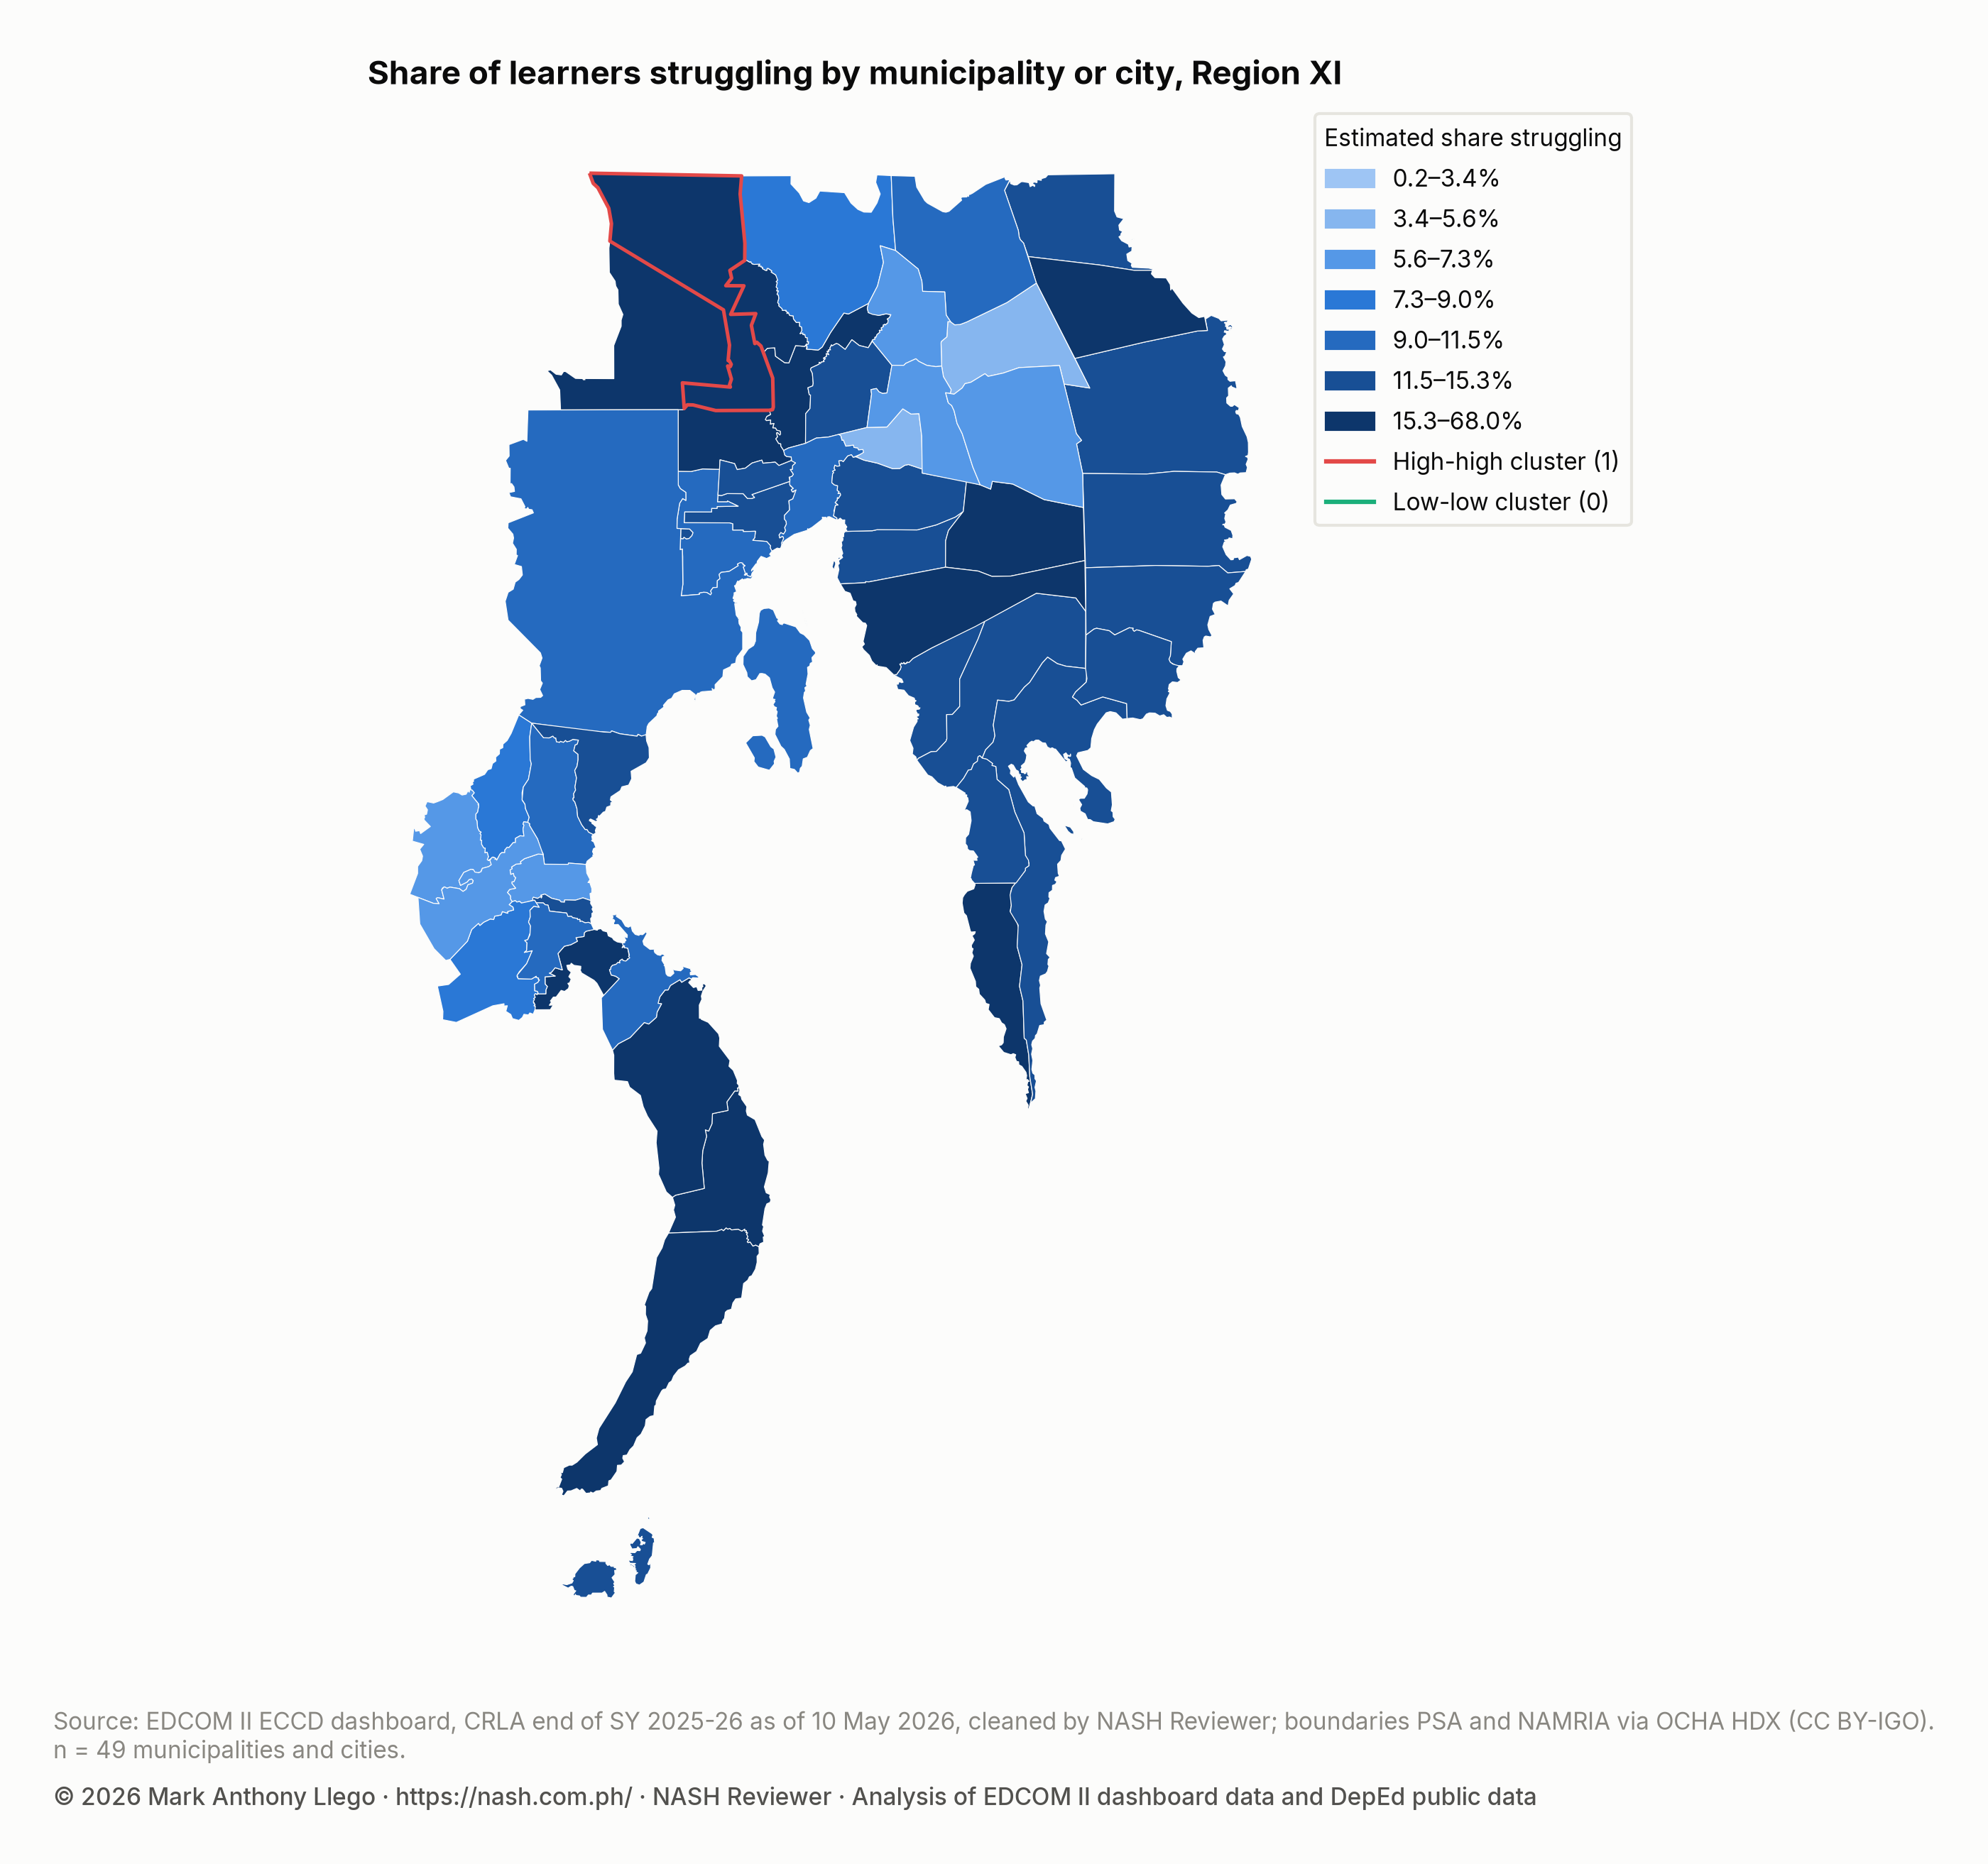
The table lists the municipalities and cities with the most struggling readers.
| Municipality or city | Province | Struggling readers | Learners | Estimated share struggling | Cluster |
|---|---|---|---|---|---|
| Davao City | Davao del Sur | 8,088 | 87,009 | 9.3% | No cluster |
| Malita | Davao Occidental | 1,511 | 7,022 | 21.5% | No cluster |
| City of Tagum (Capital) | Davao del Norte | 1,365 | 14,330 | 9.5% | No cluster |
| Kapalong | Davao del Norte | 1,192 | 5,177 | 23.0% | High-high |
| Talaingod | Davao del Norte | 1,184 | 2,386 | 49.3% | No cluster |
Davao City has the most struggling readers because it has by far the most learners, even with a share below the national one. The highest estimated shares are Talaingod, Davao del Norte (49.3%); San Isidro, Davao del Norte (23.1%); Kapalong, Davao del Norte (23.0%); Don Marcelino, Davao Occidental (22.5%); Malita, Davao Occidental (21.5%), all in Davao del Norte and Davao Occidental.
The cluster test flags places that sit among neighbors with similar shares more than chance would allow, after a correction for testing many places (FDR 5%). It flags Kapalong, Davao del Norte as high-high but not Talaingod, whose share is higher, a reminder that the test weighs the neighbors as well as the place. CRLA Reading Hotspots walks through the cluster test.
Early childhood: stunting and day care centers
The province table sets two early-childhood measures beside the share of struggling readers. Stunting is the share of children aged 0–2 who were too short for their age in Operation Timbang Plus 2025, reported to the National Nutrition Council. The second measure is the share of barangays without a child development center (CDC) on a DILG list.
| Province or highly urbanized city | Children 0–2 measured | Stunted | Barangays without a CDC | Learners struggling |
|---|---|---|---|---|
| Davao Occidental | 8,524 | 10.8% | 11 of 105 | 18.5% |
| Davao Oriental | 18,695 | 2.9% | 2 of 183 | 13.4% |
| Davao de Oro (Compostela Valley) | 22,053 | 3.8% | 8 of 237 | 9.9% |
| Davao del Norte | 33,097 | 2.2% | 6 of 223 | 14.8% |
| Davao del Sur | 66,505 | 4.1% | 26 of 414 | 9.3% |
Region XI’s stunting share, 3.9% of 148,874 children measured, is a little below the national 4.3%. Davao Occidental (10.8%) stands far above both, and its division also has one of the region’s highest shares of struggling readers. The two measures concern different children, those aged 0–2 in 2025 and those in Grades 1–3 in SY 2025-26, so the overlap describes a place, not a path from one child’s nutrition to that child’s reading.
CDCs are widespread: 53 of 1,162 barangays have none, or 4.6%, against 10.9% nationally, and Davao Occidental again has the largest proportion without one. Both measures are examined for the whole country in Stunting, Day Care Centers and Early Reading.
School resources
Figures in the inputs table come from DepEd’s SY 2023-24 school files, so they predate the CRLA by two school years. Its ratios describe the median school, and its other rows are shares of schools.
| School input (SY 2023-24) | Region XI | Philippines |
|---|---|---|
| Learners per teacher (elementary) | 24.9 | 22.8 |
| Learners per classroom (elementary) | 27.9 | 25.8 |
| Schools with internet | 71.0% | 76.3% |
| Schools with electricity | 97.4% | 97.6% |
| Schools with a water supply | 98.4% | 97.8% |
| Schools with no functional toilet | 2.5% | 2.3% |
| Schools with multigrade classes | 12.8% | 15.3% |
Region XI’s median school counts 24.9 learners per teacher and 27.9 per classroom; the national medians are 22.8 and 25.8. Fewer schools have internet (71.0%, against 76.3%) or multigrade classes, and water and electricity are close to national.
The region’s own model compares schools in the same division and gives each input an odds ratio: above 1 means more struggling readers, below 1 fewer. Because schools differ more than a plain binomial model allows, its intervals are quasi-binomial, with standard errors scaled up by that extra spread. Region XI’s model returns 6 terms with an interval that excludes 1: learners per teacher: odds ratio 1.23 (1.13–1.34); learners per classroom: odds ratio 1.07 (1.01–1.14); buildings needing major repair: odds ratio 0.95 (0.91–0.998); school size: odds ratio 0.71 (0.66–0.76); no functional toilet: odds ratio 1.48 (1.03–2.12); urban barangay: odds ratio 1.19 (1.07–1.32).
Crowding and size point the same way as nationally: more learners per teacher and per classroom went with more struggling readers, and larger schools with fewer. The region departs from the national model, where each of these intervals includes 1, on buildings needing major repair; no functional toilet; urban barangay. Schools in urban barangays and schools with no functional toilet had more struggling readers than others in their division, and schools with more buildings needing major repair had slightly fewer, with an upper limit just below 1; that last direction runs against expectation and is a pattern to check, not a finding about repairs. Region XI schools are also more crowded than the national median, but that pairing does not show that crowding produces the region’s results. The nationwide model, with its sensitivity checks, is in School Resources and CRLA Reading Results.
School heads
DepEd’s SY 2023-24 personnel file lists a School Principal position in 43.0% of Region XI schools, against 40.7% nationally; 23.3% have no head position. Unadjusted, schools with a principal had 10.3% of learners struggling, and schools without one 15.4%. Part of that gap probably reflects size, because principal positions sit mostly in larger schools. CRLA Results in Schools With and Without a Principal gives the comparison after adjustment.
Programs recorded in Region XI
Of the NGO and corporate programs on the EDCOM II dashboard’s list, 5 are in Region XI: Early Grade Reading Intervention (3); Supplementary Feeding (0-2yo) (1); Stunting Prevention Program (1). They make up 5.0% of the list, somewhat below the region’s 6.3% share of the country’s struggling readers. The list is what organizations reported, not a census, and it does not evaluate any program; Literacy and Nutrition Programs Compared With Need discusses it.
What this means for school heads in Region XI
In most of the region, the larger task is moving learners from Developing and Transitioning to grade level, and Grade 2 Filipino is where the region trails the country most. In the Davao del Norte and Davao Occidental divisions, and in places such as Talaingod and Kapalong, struggling readers are frequent enough that extra reading time may need to be part of the regular Grade 1 and Grade 2 schedule. Wherever a school is, compare it with similar schools in its own division and read each interval before any rank; How to Read a School’s CRLA Results Fairly explains how.
How these numbers were made
- CRLA data: public schools on the EDCOM II early-childhood (ECCD) dashboard, end of SY 2025-26 as of 10 May 2026, with each learner counted in one block only (Grade 1 Mother Tongue, Grade 2 Filipino or Grade 3 English).
- Shares and estimates: struggling readers are Low Emerging plus High Emerging; division and municipal shares are empirical Bayes estimates with 95% intervals, and clusters use 9,999 permutations at FDR 5%.
- School data: DepEd’s SY 2023-24 files, with a regional quasi-binomial regression that includes division indicators.
- Further reading: How to Read a School’s CRLA Results Fairly explains intervals and ranks, and CRLA End-of-Year Results SY 2025-26 the national methods.
Limits
Teachers administer the CRLA, and placement can vary between schools. Because much of the region’s gap lies between the middle levels and grade level, part of it could reflect how learners near that boundary were placed, which these data cannot check. School inputs and heads are from SY 2023-24, the regional model rests on 11 divisions, and every comparison is an association. Region XI is not in DepEd’s selected-school file, so no start-of-year comparison is possible.
Frequently asked questions
How does Region XI compare with the national CRLA results?
Region XI trails the country more at the top of the reading scale than at the bottom: 42.1% of its Grade 1–3 learners read at grade level at the end of SY 2025-26, against 47.6%, while 11.7% were struggling readers, against 10.0%.
Which Region XI division has the highest share of struggling readers?
Davao del Norte (21.0%) is highest, and Davao Occidental is also well above the regional share. The lowest is Digos City (9.2%). Davao City (8,088 struggling readers) has the largest number.
Which municipalities in Region XI have the highest shares of struggling readers?
By estimated share, the highest are Talaingod, Davao del Norte (49.3%); San Isidro, Davao del Norte (23.1%); Kapalong, Davao del Norte (23.0%); Don Marcelino, Davao Occidental (22.5%); Malita, Davao Occidental (21.5%). Kapalong is the only one in a high-high cluster. These figures describe places, not individual learners.
Download the data
The cleaned EDCOM II dashboard data behind this series are free to download for personal study; to reuse them, email support@nash.com.ph for written permission first. How the EDCOM Dashboard Data Was Cleaned explains every table and cleaning rule. The files are at data.nash.com.ph: start with the README, then the school table with CRLA results and school inputs (Parquet), the school estimates (CSV), the division estimates (CSV) and the municipal table (CSV). The DepEd school files used for school inputs are described in Download Cleaned DepEd School Data.
Every file, with its rows, columns and checksum, is listed on the EDCOM II CRLA data page. To cite the data: Llego, M. A. (2026). EDCOM II early-childhood dashboard data, cleaned, version 1. NASH Reviewer. https://nash.com.ph/edcom-data
More in this series
- CRLA End-of-Year Results SY 2025-26: All 18 Regions
- CRLA Start vs End of SY 2025-26 in the Same Schools
- CRLA by Language: Mother Tongue, Filipino and English
- How to Read a School’s CRLA Results Fairly
- CRLA Variation: School, Division or Region?
- Where Struggling Readers Are Concentrated
- School Resources and CRLA Reading Results
- CRLA Results in Schools With and Without a Principal
- Action Research and Thesis Topics on Reading (CRLA)
- CRLA Reading Hotspots: A Map of Struggling Readers
- Stunting, Day Care Centers and Early Reading
- Literacy and Nutrition Programs Compared With Need
- CRLA Schools With No Struggling Readers: A Data Check
- How the EDCOM Dashboard Data Was Cleaned
- Regional reports: NCR, CAR, Region I, Region II, Region III, Region IV-A, MIMAROPA, Region V, Region VI, NIR, Region VII, Region VIII, Region IX, Region X, Region XI, Region XII, Caraga, BARMM
- Earlier reports: CRLA Results SY 2025-2026 (DepEd’s selected-school file), Do the Same DepEd Schools Lag on the ELLNA, NAT and CRLA?, DepEd School Inputs vs Test Results, EDCOM II Final Report: Guide for Aspiring School Heads, DepEd Data for Aspiring School Heads: Where to Start
Analysis and charts by Mark Anthony Llego for NASH Reviewer. Data: EDCOM II early-childhood dashboard and Department of Education public datasets. NASH Reviewer is not affiliated with EDCOM II or DepEd. Charts may be reused only with written permission from support@nash.com.ph.