Reading the CRLA by language shows that, on average, results differ very little with the language of the test. When the same Grade 2 learners were assessed in their mother tongue and in Filipino at the end of SY 2025-26, 47.8% and 47.1% read at grade level, pooled across 34,895 public schools. When the same Grade 3 learners were assessed in Filipino and in English, the shares were 50.8% and 50.1% across 37,287 schools. The differences, -0.8 and -0.7 percentage points, are negligible by the usual effect-size measure.
The averages hide a wide spread between schools, in both directions: in Grade 3, 44.8% of schools have a lower share at grade level in English than in Filipino and 30.2% a higher one. Compared with Tagalog-medium schools in the same region and of the same size, 6 language-of-instruction groups are clearly above and 3 clearly below; since language is tied to place, these compare language communities, not languages. The results are end-of-year counts from the EDCOM II early-childhood (ECCD) dashboard as of 10 May 2026.
Key findings
- Of the same Grade 2 learners assessed in both languages, 47.8% read at grade level in the mother tongue and 47.1% in Filipino (-0.8 points, Cohen’s h of -0.02), and the struggling share is 7.9% in the mother tongue and 7.9% in Filipino.
- In Grade 3, 50.8% read at grade level in Filipino and 50.1% in English (-0.7 points, h = -0.01), but the struggling share is higher in English, 8.1% against 5.6% (+2.5 points, h = 0.10), a difference still below what is usually called small.
- In Grade 2, 60.9% of schools have the same share at grade level in both languages; in Grade 3 only 25.0% do, while 44.8% are lower in English and 30.2% higher, and the middle half of schools differ by -8.5 to +3.8 points.
- In Tagalog-medium schools, Grade 2 results in the mother tongue and in Filipino are almost identical (+0.1 points); across the 17 languages shown, the gap runs from Central Bikol (-2.8 points) to Ilocano (+3.0 points), and Filipino is higher in 9 of them.
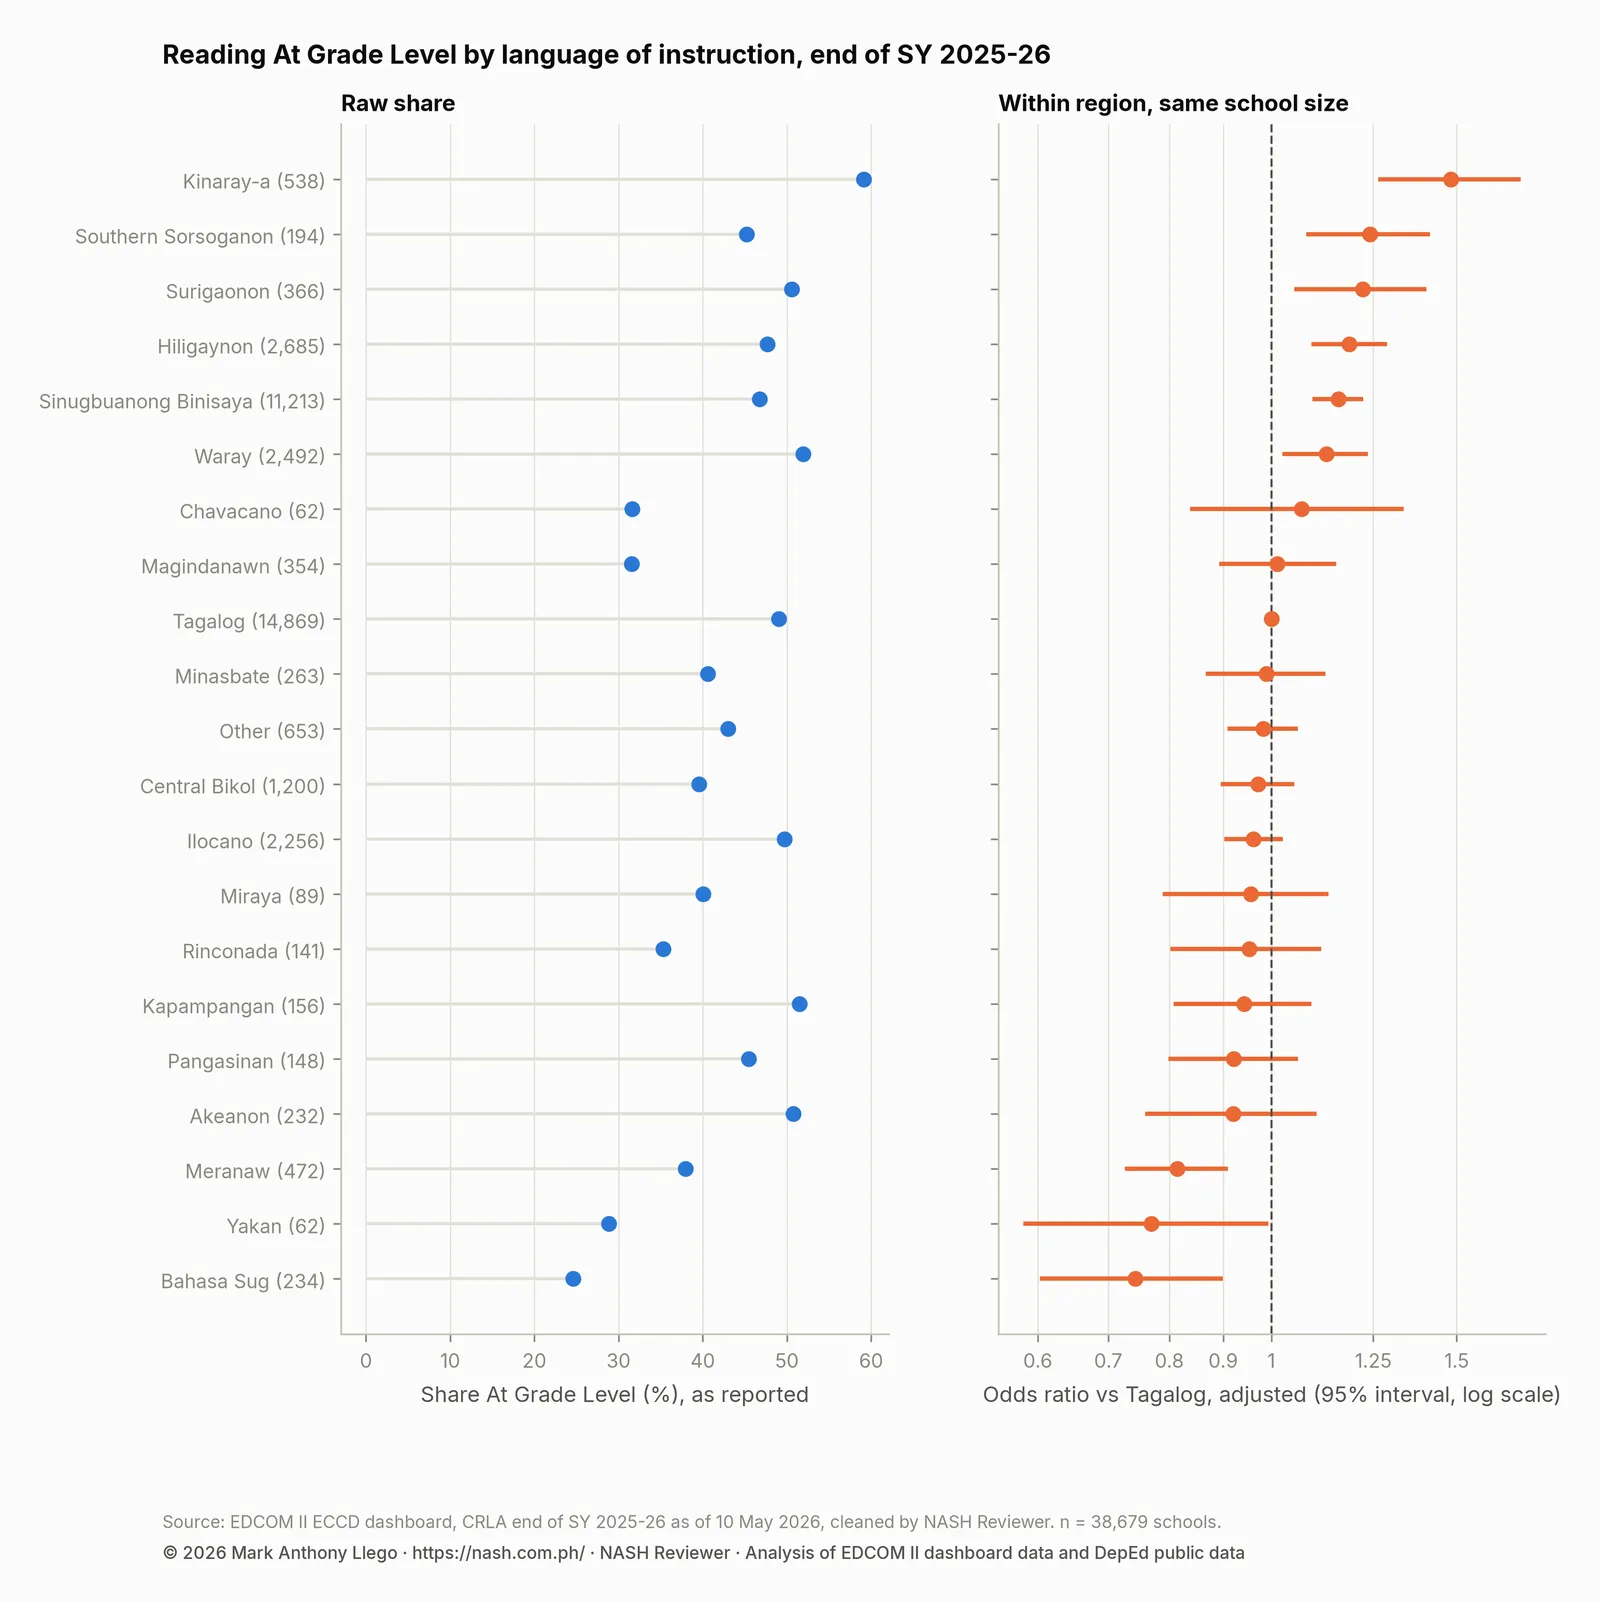
- Compared with Tagalog-medium schools in the same region and of the same size, 6 language groups have odds ratios with 95% intervals entirely above 1 (Kinaray-a, Southern Sorsoganon, Surigaonon, Hiligaynon, Sinugbuanong Binisaya, Waray) and 3 entirely below (Bahasa Sug, Yakan, Meranaw).
- Raw and adjusted results can point in opposite directions: Sinugbuanong Binisaya schools have 46.8% of learners at grade level against 49.0% in Tagalog-medium schools, yet an adjusted odds ratio of 1.16 (95% interval 1.09 to 1.22).
How the CRLA tests reading in three languages
The Comprehensive Rapid Literacy Assessment (CRLA) is DepEd’s teacher-administered reading screen for Grades 1–3. It places each learner at one of five levels: Low Emerging, High Emerging, Developing, Transitioning and At Grade Level. A struggling reader is a learner at either of the two Emerging levels.
The language of the assessment depends on the grade. Grade 1 learners are assessed in their mother tongue, Grade 2 learners in their mother tongue and in Filipino, and Grade 3 learners in Filipino and in English. The EDCOM II extract has no Grade 3 mother tongue block, so Grade 3 can be compared only between Filipino and English. The dashboard also records each school’s declared language of instruction, such as Tagalog or Ilocano: the school’s language, not each learner’s.
Republic Act No. 12027 of 2024 discontinued the mother tongue as the medium of instruction from Kindergarten to Grade 3 outside monolingual classes that meet the law’s requirements. SY 2025-26 is therefore a year of transition, and its CRLA still assessed Grades 1 and 2 in the mother tongue. These results describe where learners stood in each language during that transition; they cannot show what the law has done to reading. Mother Tongue After RA 12027 covers what the law changed, the evidence EDCOM II weighed and what DepEd now requires of schools.
Nationally, the share at grade level was 45.4% in Grade 1 Mother Tongue, 47.9% in Grade 2 Mother Tongue, 47.1% in Grade 2 Filipino, 50.8% in Grade 3 Filipino and 50.1% in Grade 3 English. The CRLA covers almost every Grade 1–3 learner in public schools, so these are population values with no sampling intervals; CRLA End-of-Year Results SY 2025-26 gives the full picture.
Mother tongue, Filipino and English: the same learners in two languages
Grade 2 and Grade 3 learners each take the CRLA twice, in two languages, so every school can be compared with itself. The number of learners assessed is identical in the two blocks in 96.8% of schools with both Grade 2 blocks and in 96.8% of schools with both Grade 3 blocks, which fits the same children being tested twice. A difference between the two blocks therefore reflects the language and the test, and only rarely who was tested.
The comparison uses the 34,895 schools with learners in both Grade 2 blocks and the 37,287 schools with learners in both Grade 3 blocks. The table gives both pairs’ pooled shares at grade level and struggling, their differences, Cohen’s h for the share at grade level, the median school difference and the shares of schools higher, the same and lower.
| Comparison | Schools | At Grade Level | Difference (points) | Cohen’s h | Struggling | Difference (points) | Median school difference | Schools higher / same / lower |
|---|---|---|---|---|---|---|---|---|
| Grade 2: Filipino vs Mother Tongue | 34,895 | 47.8% → 47.1% | -0.8 | -0.02 | 7.9% → 7.9% | -0 | 0 | 17% / 61% / 22% |
| Grade 3: English vs Filipino | 37,287 | 50.8% → 50.1% | -0.7 | -0.01 | 5.6% → 8.1% | 2.5 | 0 | 30% / 25% / 45% |
A percentage point is the plain difference between two shares. Cohen’s h is a standard effect size for proportions. By Cohen’s usual guide, two-tenths is small, one-half medium and eight-tenths large, and values near zero are negligible.
Grade 2: Filipino vs Mother Tongue
In Grade 2, 47.8% of learners read at grade level in the mother tongue and 47.1% in Filipino, a difference of -0.8 percentage points (h = -0.02). The struggling share is 7.9% in the mother tongue and 7.9% in Filipino, a difference that rounds to zero.
Grade 3: English vs Filipino
In Grade 3, 50.8% of learners read at grade level in Filipino and 50.1% in English (-0.7 points, h = -0.01). The bottom of the range differs more than the top. The struggling share is 5.6% in Filipino and 8.1% in English, +2.5 points higher (h = 0.10).
That is still below the two-tenths Cohen called small, but it has a clear shape. Nationally, 36.7% of Grade 3 learners are Transitioning, the level just below grade level, in Filipino and 33.4% in English, while 6.8% and 8.5% are Developing. In English, then, about as many learners reach grade level, but more of the rest sit at the Developing and Emerging levels instead of just below grade level.
How many schools differ, and in which direction
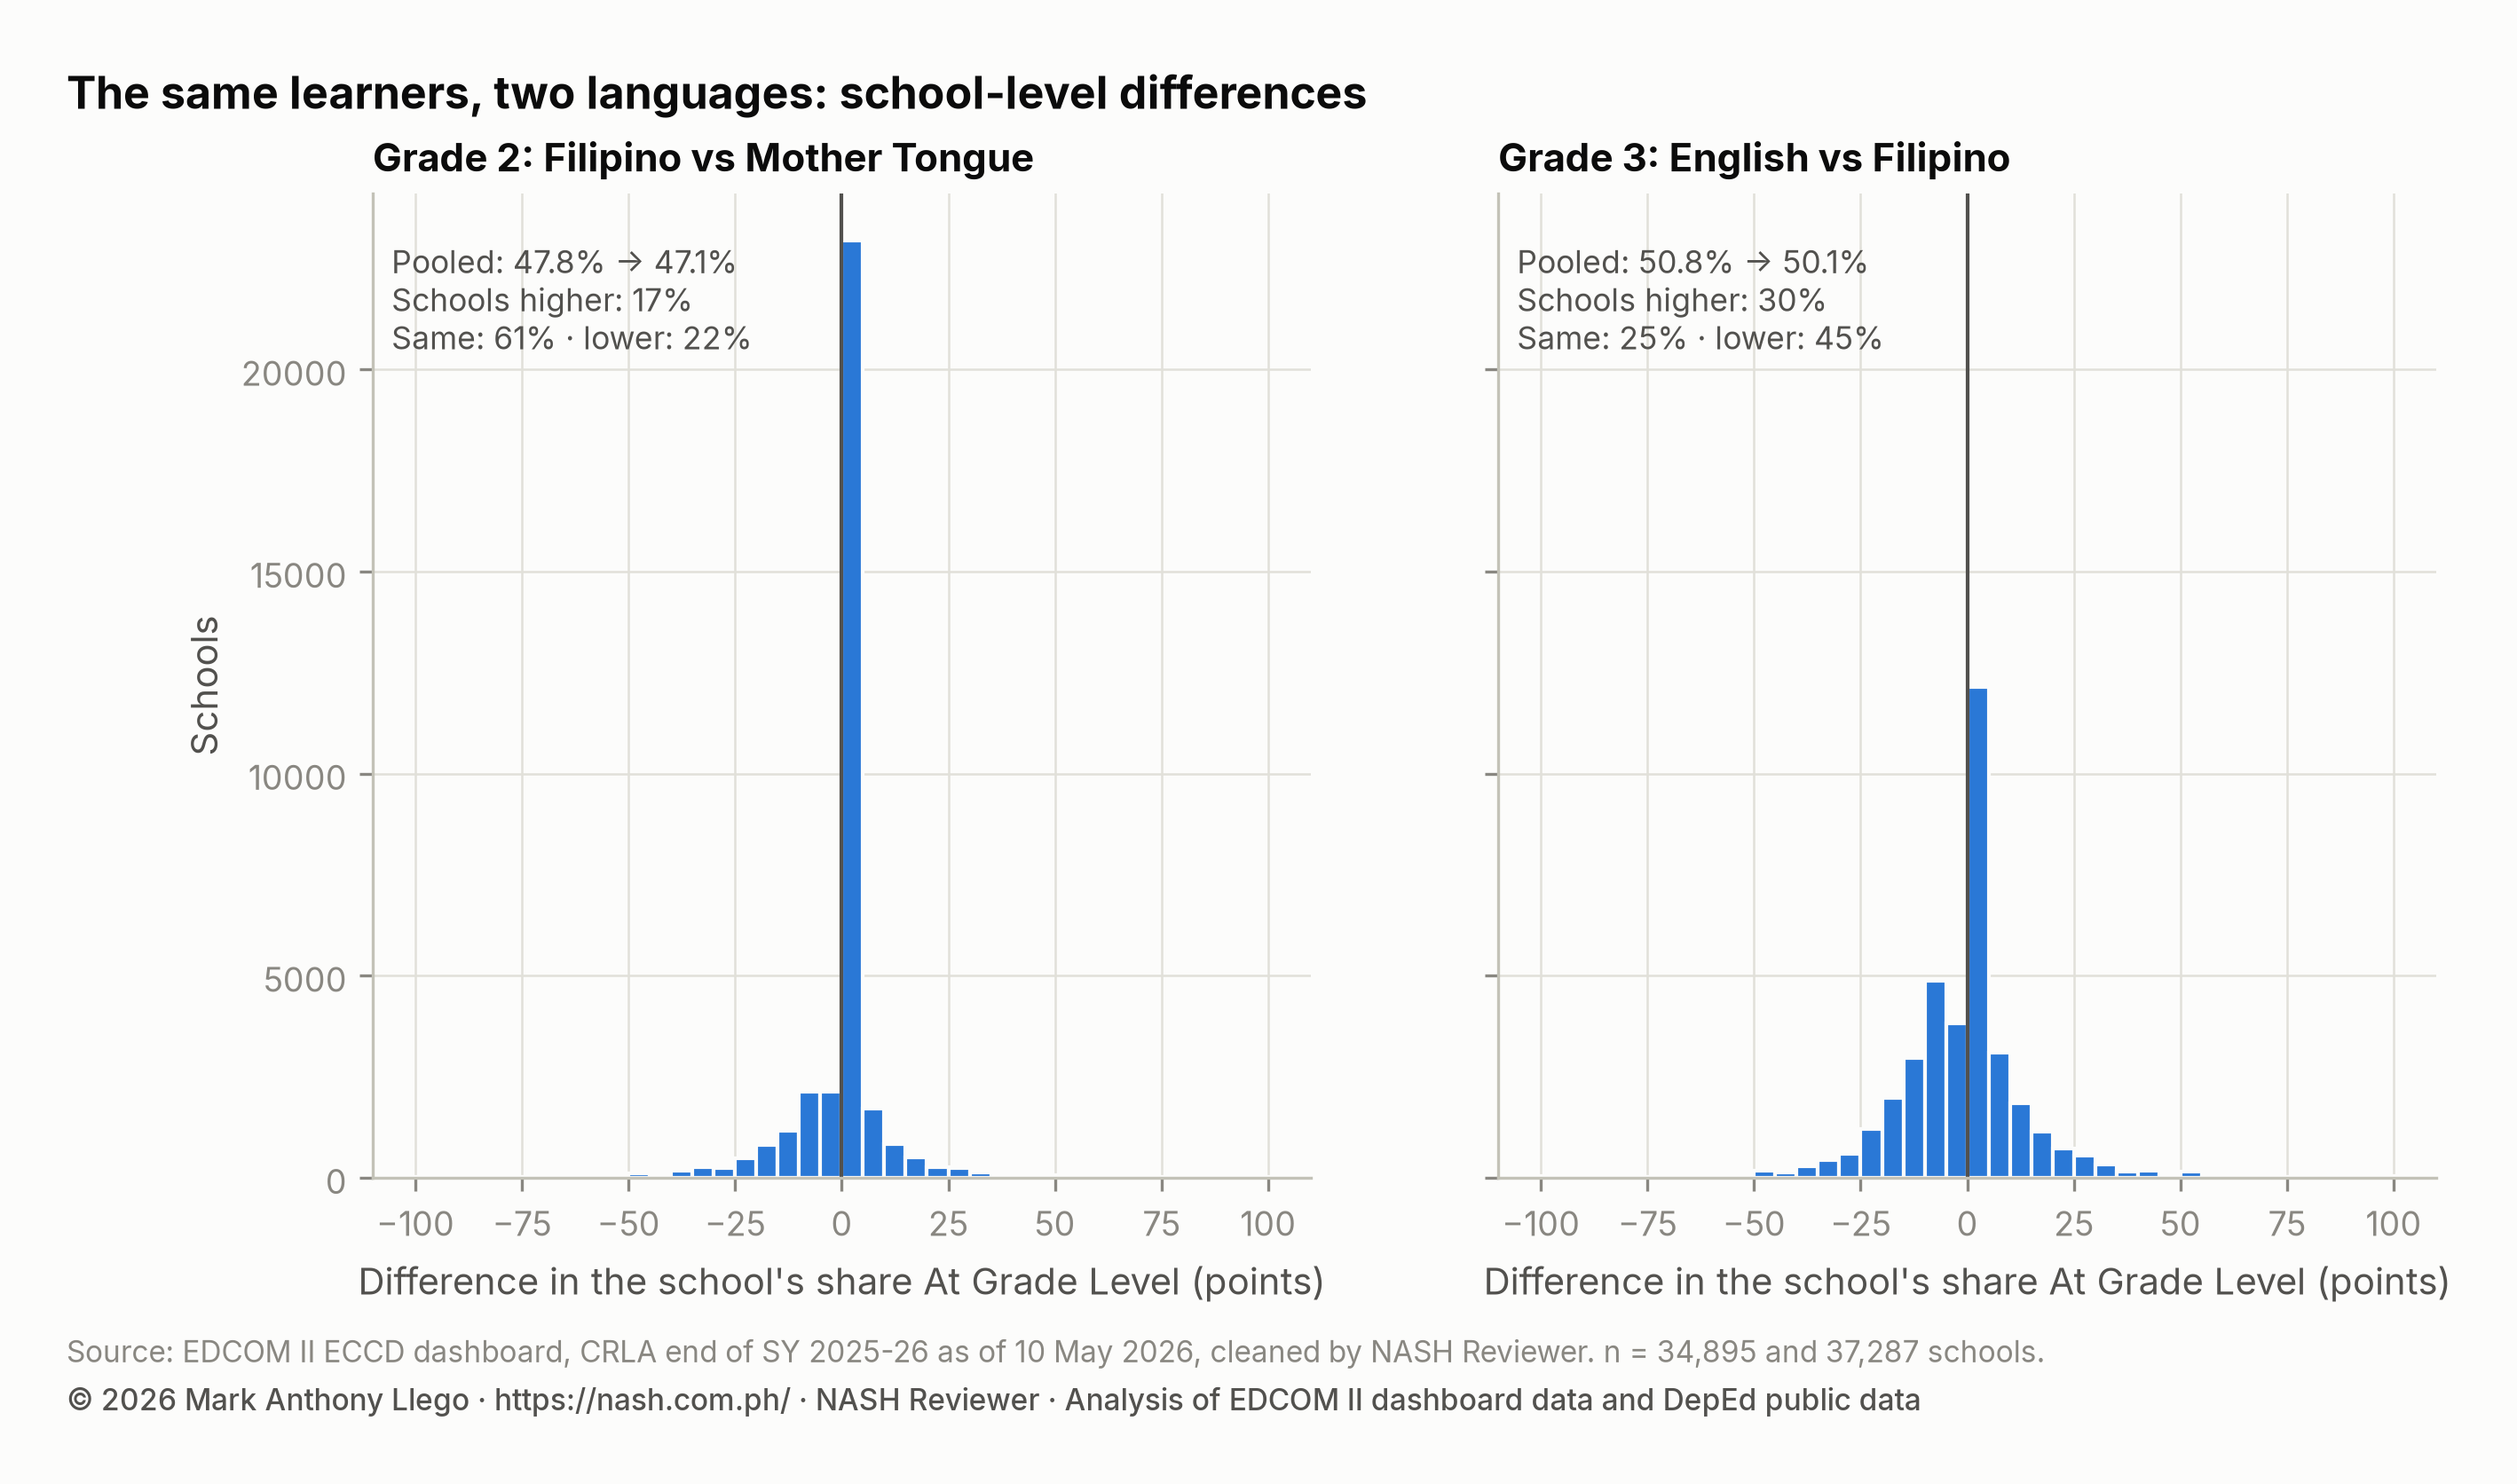
Pooled shares can hide schools that differ in opposite directions and cancel out. In Grade 2, 60.9% of schools have exactly the same share at grade level in both languages, 17.0% have a higher share in Filipino and 22.1% a lower one. The median school difference is +0.0 points, and the middle half of schools also shows none (from +0.0 to +0.0 points).
Grade 3 is more mixed. Only 25.0% of schools have the same share at grade level in Filipino and English, 44.8% are lower in English and 30.2% are higher. The median school difference is +0.0 points, but the middle half of schools runs from -8.5 to +3.8 points. While the national shares barely move, many schools see their two Grade 3 results differ by several points, in either direction.
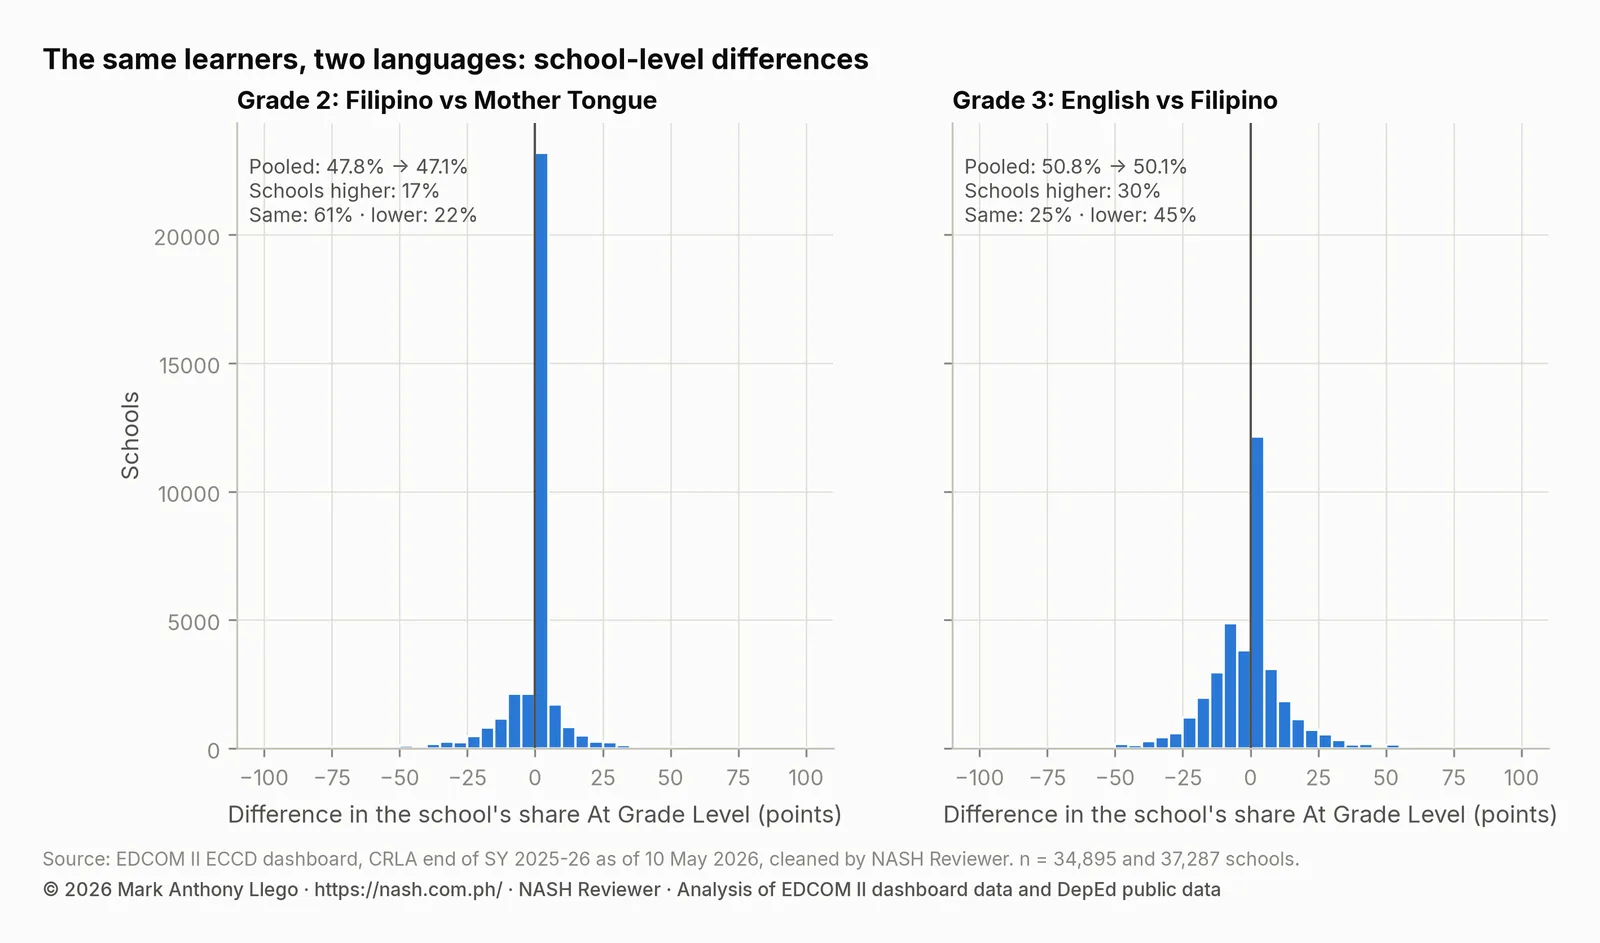
Identical results are easier to get in small schools, where a share can take only a few values, but in Grade 2 they are not limited to small schools. Among schools assessed in both Grade 2 languages with at least 10 learners in Grade 2 Mother Tongue, 49.8% report the same number of learners at every level in both languages, and 64.9% of those are Tagalog-medium schools, where the mother tongue and Filipino are closely related. As CRLA Schools With No Struggling Readers explains, identical results elsewhere are a data check, not a sign of a problem, but where one block was entered for both, the Grade 2 comparison would understate real differences between the two languages.
Grade 2 Mother Tongue vs Filipino by language of instruction
Splitting the Grade 2 comparison by the school’s language of instruction shows whether the near-zero national gap holds in each language. The table covers the 17 languages of instruction with at least a hundred schools that assessed both Grade 2 blocks. It is ordered from the largest drop in Filipino to the largest gain.
| Language of instruction | Schools | Grade 2 Mother Tongue | Grade 2 Filipino | Filipino minus Mother Tongue (points) |
|---|---|---|---|---|
| Central Bikol | 1,075 | 42.3% | 39.4% | -2.8 |
| Kinaray-a | 496 | 61.4% | 58.6% | -2.8 |
| Surigaonon | 351 | 50.3% | 47.7% | -2.6 |
| Sinugbuanong Binisaya | 10,507 | 47.2% | 44.6% | -2.6 |
| Hiligaynon | 2,579 | 46.5% | 45.0% | -1.5 |
| Akeanon | 162 | 49.2% | 47.7% | -1.5 |
| Minasbate | 221 | 43.0% | 42.1% | -0.9 |
| Waray | 2,405 | 49.8% | 49.6% | -0.1 |
| Tagalog | 12,901 | 49.5% | 49.6% | 0.1 |
| Southern Sorsoganon | 175 | 44.1% | 44.4% | 0.3 |
| Pangasinan | 130 | 48.1% | 48.5% | 0.3 |
| Meranaw | 368 | 37.2% | 37.8% | 0.6 |
| Magindanawn | 304 | 33.0% | 33.7% | 0.7 |
| Bahasa Sug | 208 | 23.1% | 24.4% | 1.3 |
| Kapampangan | 125 | 51.6% | 53.1% | 1.4 |
| Rinconada | 127 | 31.8% | 34.4% | 2.6 |
| Ilocano | 2,049 | 46.7% | 49.7% | 3 |
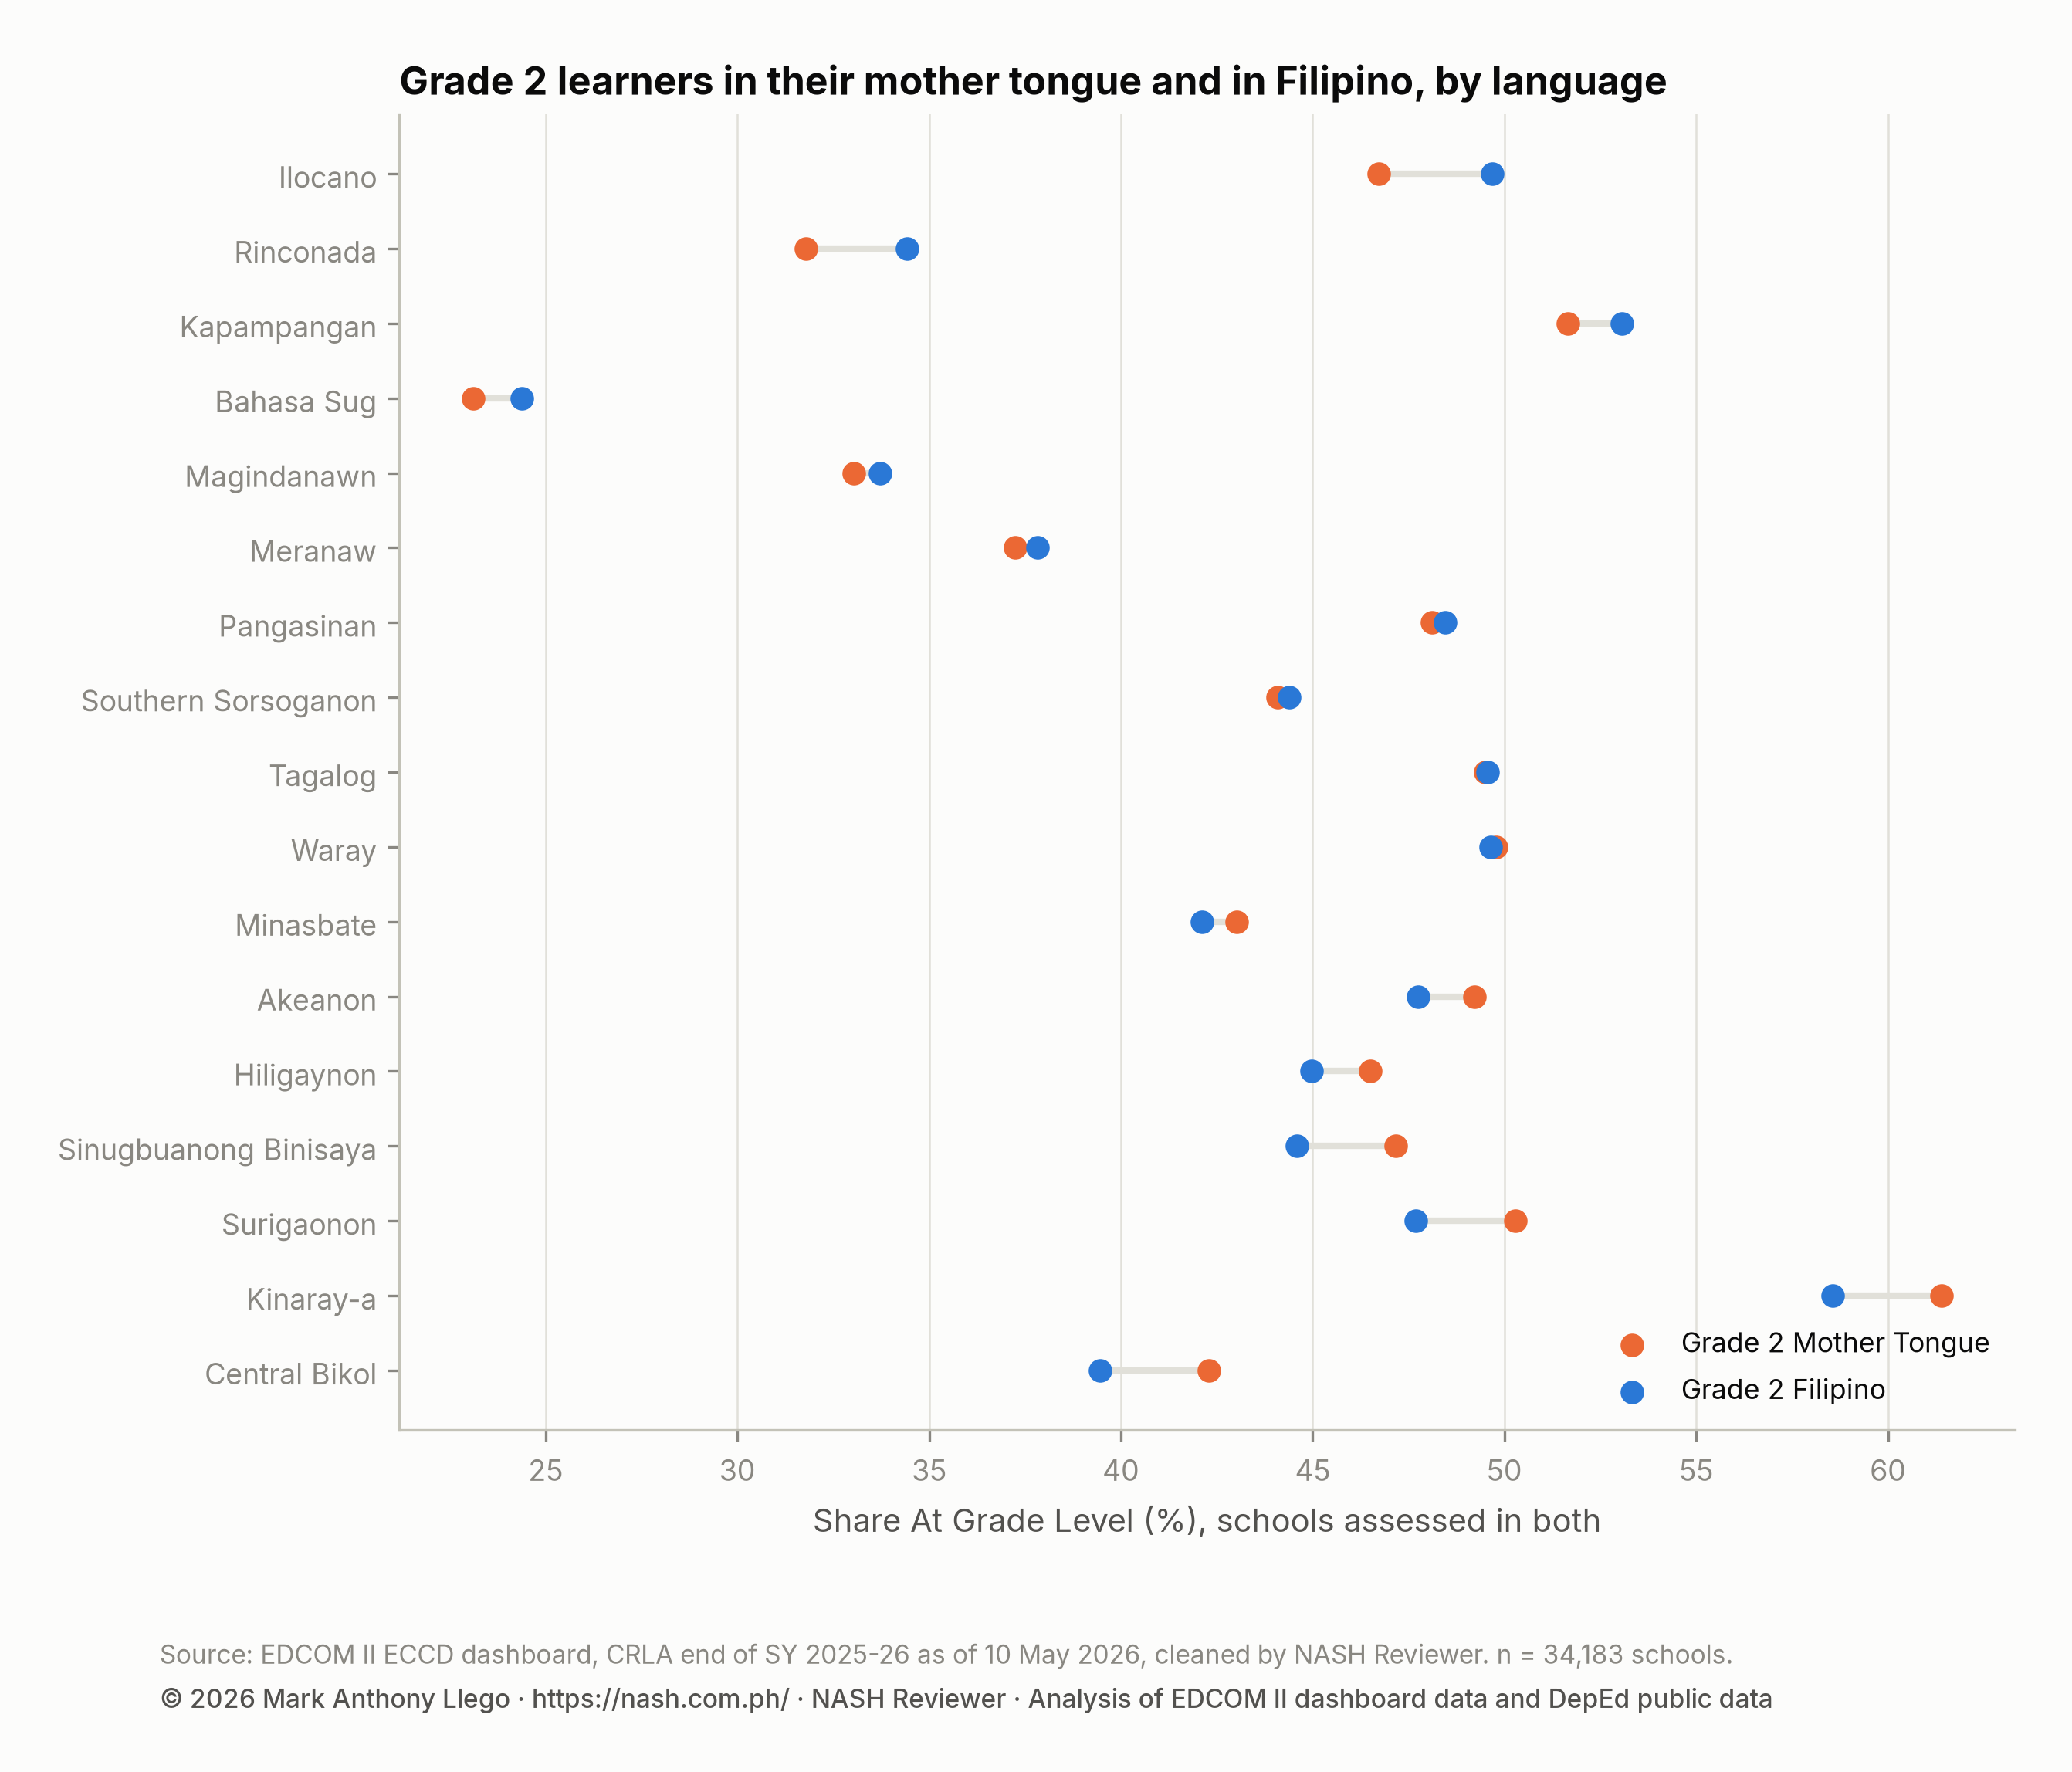
For Tagalog-medium schools, the two results are almost the same: Filipino minus Mother Tongue is +0.1 points. That is expected, since Filipino is based on Tagalog.
Across the languages shown, the gaps stay small. They run from Central Bikol (-2.8 points) to Ilocano (+3.0 points), and Filipino is higher in 9 of the 17 languages and lower in the others.
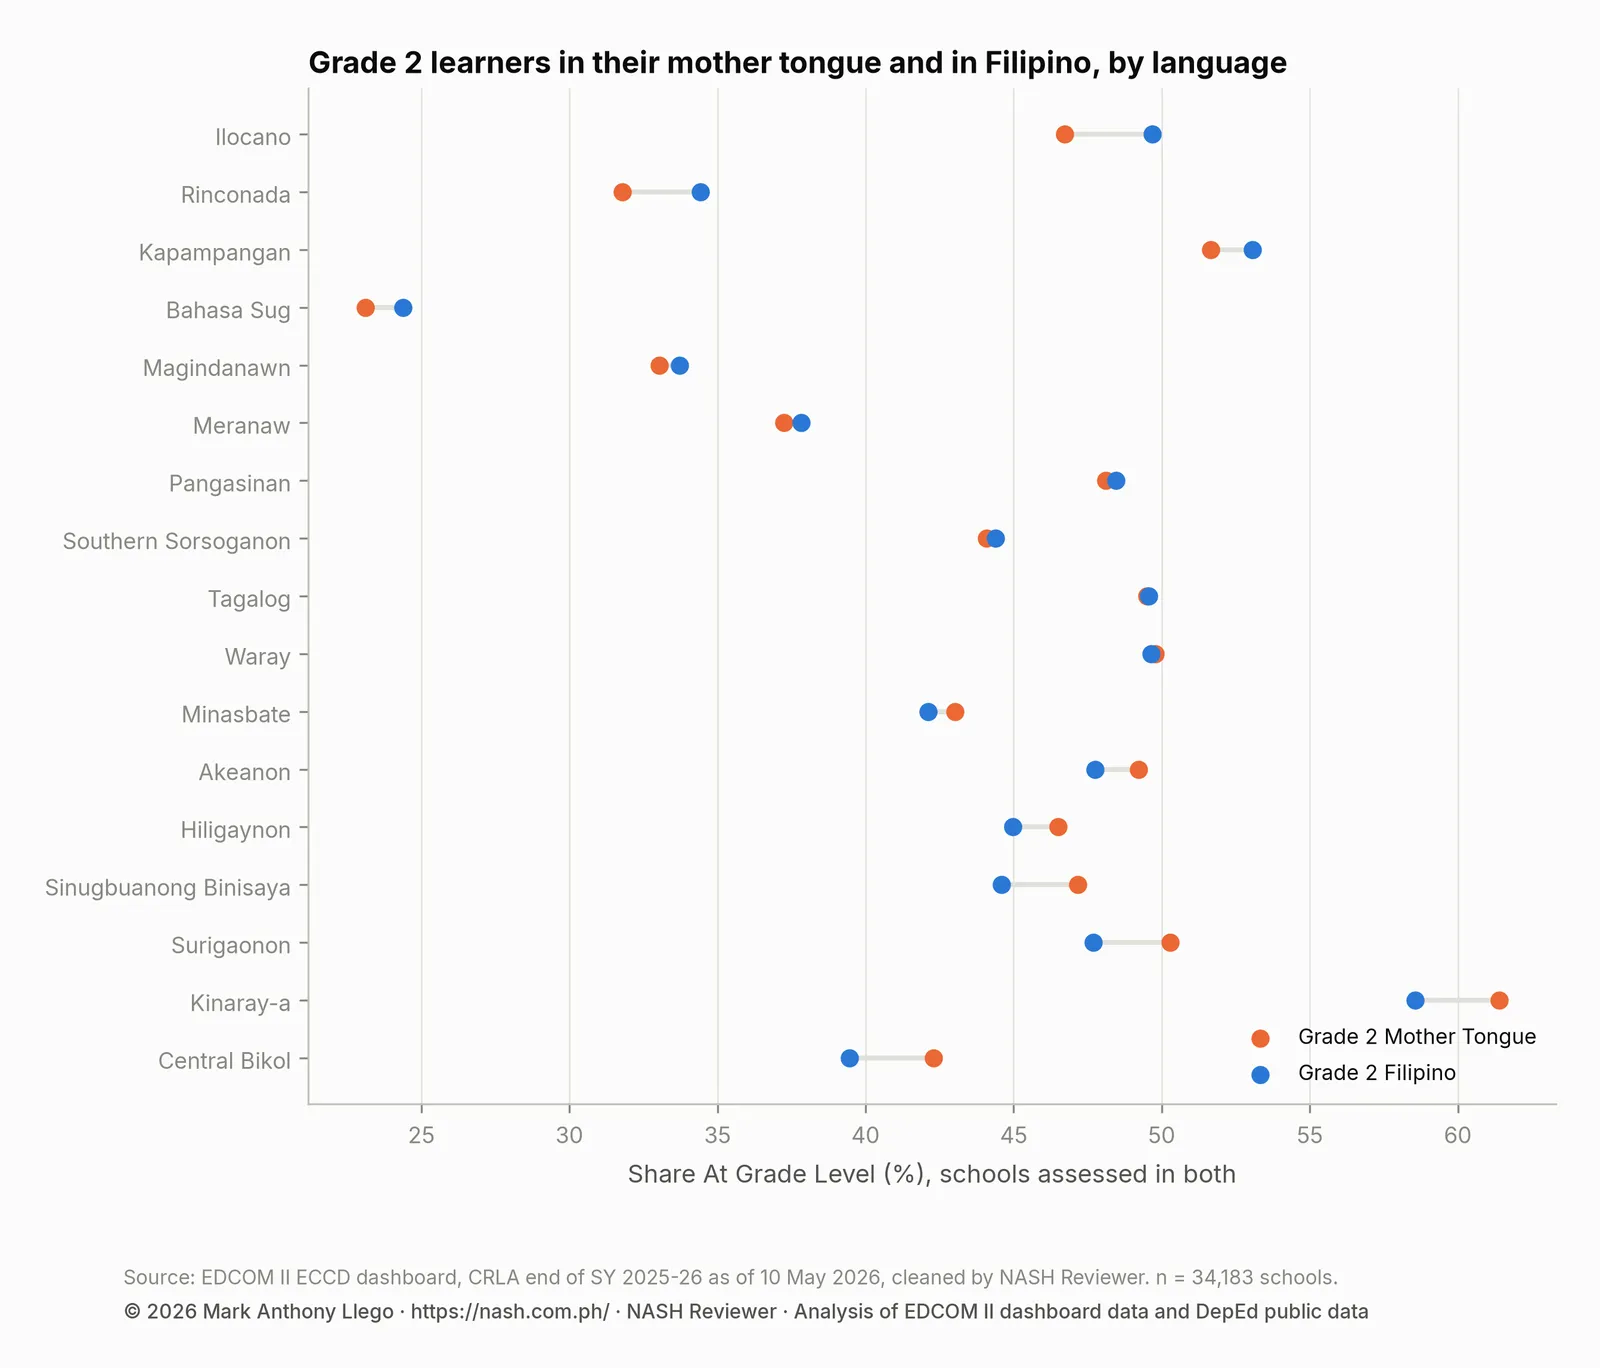
A gap here can mean that learners in that language community read Filipino better or worse than their mother tongue, that the mother tongue assessment in that language is easier or harder, or that teachers rate the two differently; the data cannot tell these apart. Each mother tongue has its own assessment, while Filipino is assessed in the same language everywhere, so the Filipino column is the more comparable one across languages.
CRLA by language of instruction: comparing schools within regions
Comparing languages of instruction directly is harder to read fairly, because language goes closely with place. Waray-medium schools, for example, are almost all in Region VIII (Eastern Visayas), so a raw comparison mixes language with everything else that differs between regions. As reported, 49.0% of learners in Tagalog-medium schools read at grade level, counting each learner once, against 59.1% in Kinaray-a schools and 24.6% in Bahasa Sug schools.
To compare like with like, a Bayesian beta-binomial model was fitted to each school’s count of learners at grade level, counting each learner once (Grade 1 Mother Tongue, Grade 2 Filipino and Grade 3 English). It gives each region its own baseline, adjusts for school size (learners assessed), and lets each division sit above or below its region by an amount estimated from the data. Each language group is then compared with Tagalog-medium schools in the same region and of the same size.
A plain binomial model would assume that schools alike in region, division, language group and size differ only by chance; school results vary more than that, and the beta-binomial allows for it so the intervals are not too narrow. Each estimate comes with a 95% interval: under the model, the value lies inside it with that probability.
The comparison is an odds ratio. An odds ratio of 1 means a group’s odds of a learner reading at grade level are the same as in Tagalog-medium schools in the same region and of the same size; above 1 means higher, below 1 lower. Languages with fewer than fifty schools are pooled as Other, which gives 21 groups including Tagalog. The table shows each group’s schools, raw share at grade level, adjusted odds ratio and the probability that its odds are above Tagalog’s.
| Language of instruction | Schools | At Grade Level, as reported | Odds ratio vs Tagalog, adjusted (95% interval) | Probability above Tagalog |
|---|---|---|---|---|
| Tagalog | 14,869 | 49.0% | reference | |
| Akeanon | 232 | 50.8% | 0.92 (0.76–1.10) | 0.17 |
| Bahasa Sug | 234 | 24.6% | 0.74 (0.60–0.90) | 0 |
| Central Bikol | 1,200 | 39.5% | 0.97 (0.90–1.05) | 0.24 |
| Chavacano | 62 | 31.6% | 1.07 (0.84–1.34) | 0.7 |
| Hiligaynon | 2,685 | 47.7% | 1.19 (1.09–1.29) | 1 |
| Ilocano | 2,256 | 49.7% | 0.96 (0.90–1.03) | 0.11 |
| Kapampangan | 156 | 51.5% | 0.94 (0.81–1.09) | 0.2 |
| Kinaray-a | 538 | 59.1% | 1.48 (1.26–1.73) | 1 |
| Magindanawn | 354 | 31.6% | 1.01 (0.89–1.15) | 0.55 |
| Meranaw | 472 | 37.9% | 0.81 (0.73–0.91) | 0 |
| Minasbate | 263 | 40.6% | 0.99 (0.87–1.13) | 0.43 |
| Miraya | 89 | 40.0% | 0.96 (0.79–1.13) | 0.3 |
| Other | 653 | 43.0% | 0.98 (0.91–1.06) | 0.32 |
| Pangasinan | 148 | 45.4% | 0.92 (0.80–1.06) | 0.12 |
| Rinconada | 141 | 35.3% | 0.95 (0.80–1.12) | 0.27 |
| Sinugbuanong Binisaya | 11,213 | 46.8% | 1.16 (1.09–1.22) | 1 |
| Southern Sorsoganon | 194 | 45.2% | 1.24 (1.08–1.41) | 1 |
| Surigaonon | 366 | 50.6% | 1.22 (1.05–1.40) | 1 |
| Waray | 2,492 | 51.9% | 1.13 (1.02–1.23) | 0.99 |
| Yakan | 62 | 28.8% | 0.77 (0.58–0.99) | 0.02 |
In all, 6 groups have 95% intervals entirely above 1: Kinaray-a, Southern Sorsoganon, Surigaonon, Hiligaynon, Sinugbuanong Binisaya, Waray, in order from the highest odds ratio. Kinaray-a schools, for example, have an odds ratio of 1.48 (95% interval 1.26 to 1.73). By contrast, 3 groups have intervals entirely below 1: Bahasa Sug, Yakan, Meranaw, from the lowest; Bahasa Sug schools have 0.74 (95% interval 0.60 to 0.90). For every other group the interval includes 1, so the data cannot tell it apart from Tagalog-medium schools in the same region.
Why raw and adjusted results differ
The adjustment can reverse a raw comparison. Sinugbuanong Binisaya schools have a lower raw share than Tagalog-medium schools (46.8% against 49.0%), yet their odds ratio is 1.16 (95% interval 1.09 to 1.22). In the regions where they are found, the model places them above the Tagalog-medium schools there. Magindanawn schools have a raw share of only 31.6%, yet an odds ratio of 1.01 (95% interval 0.89 to 1.15): their results are close to those of Tagalog-medium schools in the same regions.
So the odds ratios compare groups of schools in language communities within regions, not individual children; they do not show what a language does to reading. A language group also stands for its places and for conditions, such as poverty, distance and staffing, that the model does not measure. When a language is concentrated in one region, as Waray is, its odds ratio rests on the Tagalog-medium schools in that region, which may be few and may not be typical of it.
How well the model fits
The model was fitted by Bayesian sampling with 4,000 draws in four chains. R-hat compares the chains, and values near one mean they agree. The largest R-hat, 1.010, meets the 1.01 limit. The smallest effective sample size was 505, above 400; it counts how many independent draws the chains are worth. Refitting with the language and size priors twice as wide changed no odds ratio by more than 0.52%, so the priors barely matter.
A posterior predictive check compares data simulated from the fitted model with the real results: the pooled share at grade level in each language group, and the share of schools with no learner at grade level. The observed value fell inside the simulated 95% interval in 20 of 22 checks. The misses are the Magindanawn group’s share, slightly above the simulated range, and the share of schools with no learner at grade level, which the model underestimates (see Limits).
School size goes with results only slightly: the odds ratio per unit of log school size, close to a tripling of the learners assessed, is 1.02 (95% interval 1.01 to 1.03). Divisions vary more. The standard deviation of division shifts within a region is 0.33 on the log-odds scale, a moderate spread, so divisions in the same region still differ after language and size are taken into account. CRLA Variation: School, Division or Region? looks at that split in detail.
What this means for school heads
In any one school, the two results for the same learners can differ by several points. These steps help:
- Read both languages together. A school’s Grade 2 Mother Tongue and Filipino results, and its Grade 3 Filipino and English results, describe the same learners. Set them side by side before drawing conclusions from either.
- Treat a gap as a question, not a verdict. A difference between the two blocks may reflect the assessment language, the test or how it was rated, rather than reading skill. In Grade 3 the middle half of schools differ by -8.5 to +3.8 points, so a gap of a few points is ordinary.
- Look at the bottom levels in English. Nationally, more Grade 3 learners are struggling in English (8.1%) than in Filipino (5.6%). A learner struggling in English but not in Filipino may need support with English rather than with reading in general.
- Compare with schools like yours. Results by language of instruction are tied to place. Set a school beside others in the same division and language community, not beside the national average.
- Plan the transition after RA 12027. With the mother tongue no longer the medium of instruction from Kindergarten to Grade 3 outside monolingual classes that meet the law’s requirements, the SY 2025-26 mother tongue results record where learners stood in that language. The Filipino results are given in the same language in every school and make a firmer baseline for the shift, and learners whose mother tongue result is well above their Filipino result may need closer attention as instruction changes.
- Read small numbers with care. In a class of a dozen learners, one or two children move a share a long way.
How to Read a School’s CRLA Results Fairly explains these checks in more detail.
How these numbers were made
Differences in percentage points are computed from unrounded shares, so a difference can differ by a tenth of a point from the gap between the rounded shares shown beside it.
- Source. CRLA results at the end of SY 2025-26 from the EDCOM II ECCD dashboard as of 10 May 2026, for public schools, cleaned as described in How the EDCOM Dashboard Data Was Cleaned. Regions are the PSGC’s 18 regions, with Sulu in Region IX and the Negros Island Region (NIR) as its own region.
- Paired comparisons. For Grade 2, schools with learners in both the Mother Tongue and Filipino blocks; for Grade 3, schools with learners in both the Filipino and English blocks. Pooled shares are learners at a level divided by learners assessed across those schools. Struggling readers are Low Emerging plus High Emerging. Cohen’s h compares the second language’s share with the first’s.
- School differences. Each school’s share at grade level in the second language minus its share in the first, in percentage points. A school counts as the same when the two shares are exactly equal.
- By language of instruction. The Grade 2 paired schools, grouped by declared language of instruction; languages with at least a hundred such schools are shown, and Other is left out.
- Model. A beta-binomial model with a logit link for each school’s learners at grade level out of learners assessed, counting each learner once. It has an intercept for each region, a log odds ratio for each language group against Tagalog, a slope on the centered log of learners assessed, and division shifts that sum to zero within each region and share a common standard deviation. Language priors are normal with a standard deviation of one on the log-odds scale. Languages with fewer than fifty schools are pooled as Other.
- Checks. 4,000 draws in four chains, R-hat and effective sample size, a refit with the language and size priors twice as wide, and a posterior predictive check of each group’s pooled share and of the share of schools with no learner at grade level.
Limits
Declared language, not the child’s. The language of instruction is the school’s declared language. Some learners’ home language differs, and the data cannot show which.
Mother tongue tests differ by language. Each mother tongue has its own assessment, and these may not be equally difficult. Mother tongue results are therefore not strictly comparable across languages, and the Grade 2 gaps by language mix any real difference in reading with any difference between tests.
Test, rating or reading. A gap between two blocks could come from the language, the test or how teachers rated each one; the paired design rules out only differences in who was tested.
The model mixes blocks. The language model counts each learner once, so its outcome combines Grade 1 Mother Tongue, which differs by language, with Grade 2 Filipino and Grade 3 English, which do not.
Observational, and tied to place. Language groups differ in many ways the model does not measure. The odds ratios are associations within regions, not the result of using one language or another.
Zero-heavy schools. The data hold more schools with no learner at grade level than the model produces. Some zeros may be real, especially in small classes; others may come from how results were recorded. The model still reproduces most pooled shares, but its intervals may be somewhat too narrow.
One year, in transition. These are results for one school year, during the move away from mother-tongue instruction, so they cannot show trends.
Frequently asked questions
Do learners read better in their mother tongue or in Filipino on the CRLA?
On average, almost equally well. When the same Grade 2 learners were assessed in both, 47.8% read at grade level in the mother tongue and 47.1% in Filipino, and the struggling share was 7.9% in the mother tongue and 7.9% in Filipino.
Is the Grade 3 English CRLA harder than Filipino?
The share at grade level is almost the same, 50.8% in Filipino and 50.1% in English. More learners are struggling in English, 8.1% against 5.6%, a difference still below small by Cohen’s h. Schools vary: 44.8% have a lower share at grade level in English and 30.2% a higher one.
Which languages of instruction have the highest CRLA results?
It depends on whether place is taken into account. As reported, Kinaray-a schools have 59.1% of learners at grade level and Bahasa Sug schools 24.6%. Compared with Tagalog-medium schools in the same region and of the same size, 6 groups are clearly higher (Kinaray-a, Southern Sorsoganon, Surigaonon, Hiligaynon, Sinugbuanong Binisaya, Waray) and 3 clearly lower (Bahasa Sug, Yakan, Meranaw). These compare communities within regions, not languages.
What does RA 12027 mean for reading CRLA results?
RA 12027 of 2024 discontinued the mother tongue as the medium of instruction from Kindergarten to Grade 3 outside monolingual classes that meet the law’s requirements, so SY 2025-26 was a year of transition. Its CRLA still assessed Grades 1 and 2 in the mother tongue, so these results record where learners stood in each language during that change. Comparing both results for the same learners shows who may need support as instruction shifts.
Download the data
The cleaned EDCOM II dashboard data behind this series are free to download for personal study; to reuse them, email support@nash.com.ph for written permission first. How the EDCOM Dashboard Data Was Cleaned explains every table and cleaning rule. The files are at data.nash.com.ph: start with the README, then the school table with CRLA results and school inputs (Parquet), the school estimates (CSV), the division estimates (CSV) and the municipal table (CSV). The DepEd school files used for school inputs are described in Download Cleaned DepEd School Data.
Every file, with its rows, columns and checksum, is listed on the EDCOM II CRLA data page. To cite the data: Llego, M. A. (2026). EDCOM II early-childhood dashboard data, cleaned, version 1. NASH Reviewer. https://nash.com.ph/edcom-data
More in this series
- CRLA End-of-Year Results SY 2025-26: All 18 Regions
- CRLA Start vs End of SY 2025-26 in the Same Schools
- CRLA by Language: Mother Tongue, Filipino and English
- How to Read a School’s CRLA Results Fairly
- CRLA Variation: School, Division or Region?
- Where Struggling Readers Are Concentrated
- School Resources and CRLA Reading Results
- CRLA Results in Schools With and Without a Principal
- Action Research and Thesis Topics on Reading (CRLA)
- CRLA Reading Hotspots: A Map of Struggling Readers
- Stunting, Day Care Centers and Early Reading
- Literacy and Nutrition Programs Compared With Need
- CRLA Schools With No Struggling Readers: A Data Check
- How the EDCOM Dashboard Data Was Cleaned
- Regional reports: NCR, CAR, Region I, Region II, Region III, Region IV-A, MIMAROPA, Region V, Region VI, NIR, Region VII, Region VIII, Region IX, Region X, Region XI, Region XII, Caraga, BARMM
- Earlier reports: CRLA Results SY 2025-2026 (DepEd’s selected-school file), Do the Same DepEd Schools Lag on the ELLNA, NAT and CRLA?, DepEd School Inputs vs Test Results, EDCOM II Final Report: Guide for Aspiring School Heads, DepEd Data for Aspiring School Heads: Where to Start
Analysis and charts by Mark Anthony Llego for NASH Reviewer. Data: EDCOM II early-childhood dashboard and Department of Education public datasets. NASH Reviewer is not affiliated with EDCOM II or DepEd. Charts may be reused only with written permission from support@nash.com.ph.