The CRLA results for SY 2025-26 in Region I (Ilocos Region) sit close to the national picture. The Comprehensive Rapid Literacy Assessment (CRLA) is the reading screen DepEd uses in the early grades, and a struggling reader is a learner at Low Emerging or High Emerging, its two lowest levels. Of the region’s 218,318 assessed learners in Grades 1–3, 20,669 (9.5%) were struggling readers at the end of the year, against 10.0% nationally, and 46.5% read at grade level, against 47.6%. Ordered from the lowest share, the 18 regions put Region I at 9, in the middle of the list.
Beneath that average, two patterns stand out. Grade 1 is the weak point: the region trails the national share at grade level in every block, and by most in Grade 1 Mother Tongue. And struggling readers gather in Pangasinan. The largest group is in Pangasinan II, Binalonan (6,160 struggling readers), which also has the region’s highest share, the top of a division range of 2.3% to 12.5%.
Key findings
- Region I is slightly below the national share at grade level in every block, most of all in Grade 1 Mother Tongue (-3.0 points), where 42.4% read at grade level; the closest is Grade 2 Filipino (-0.1 points).
- In Grade 2, learners reach grade level more often in Filipino than in the mother tongue: the gap is +1.6 percentage points, against -0.8 nationally.
- Division shares run from 2.3% to 12.5%; Candon City (2.3%) sits far below the regional share, and no division lies beyond the national funnel limits.
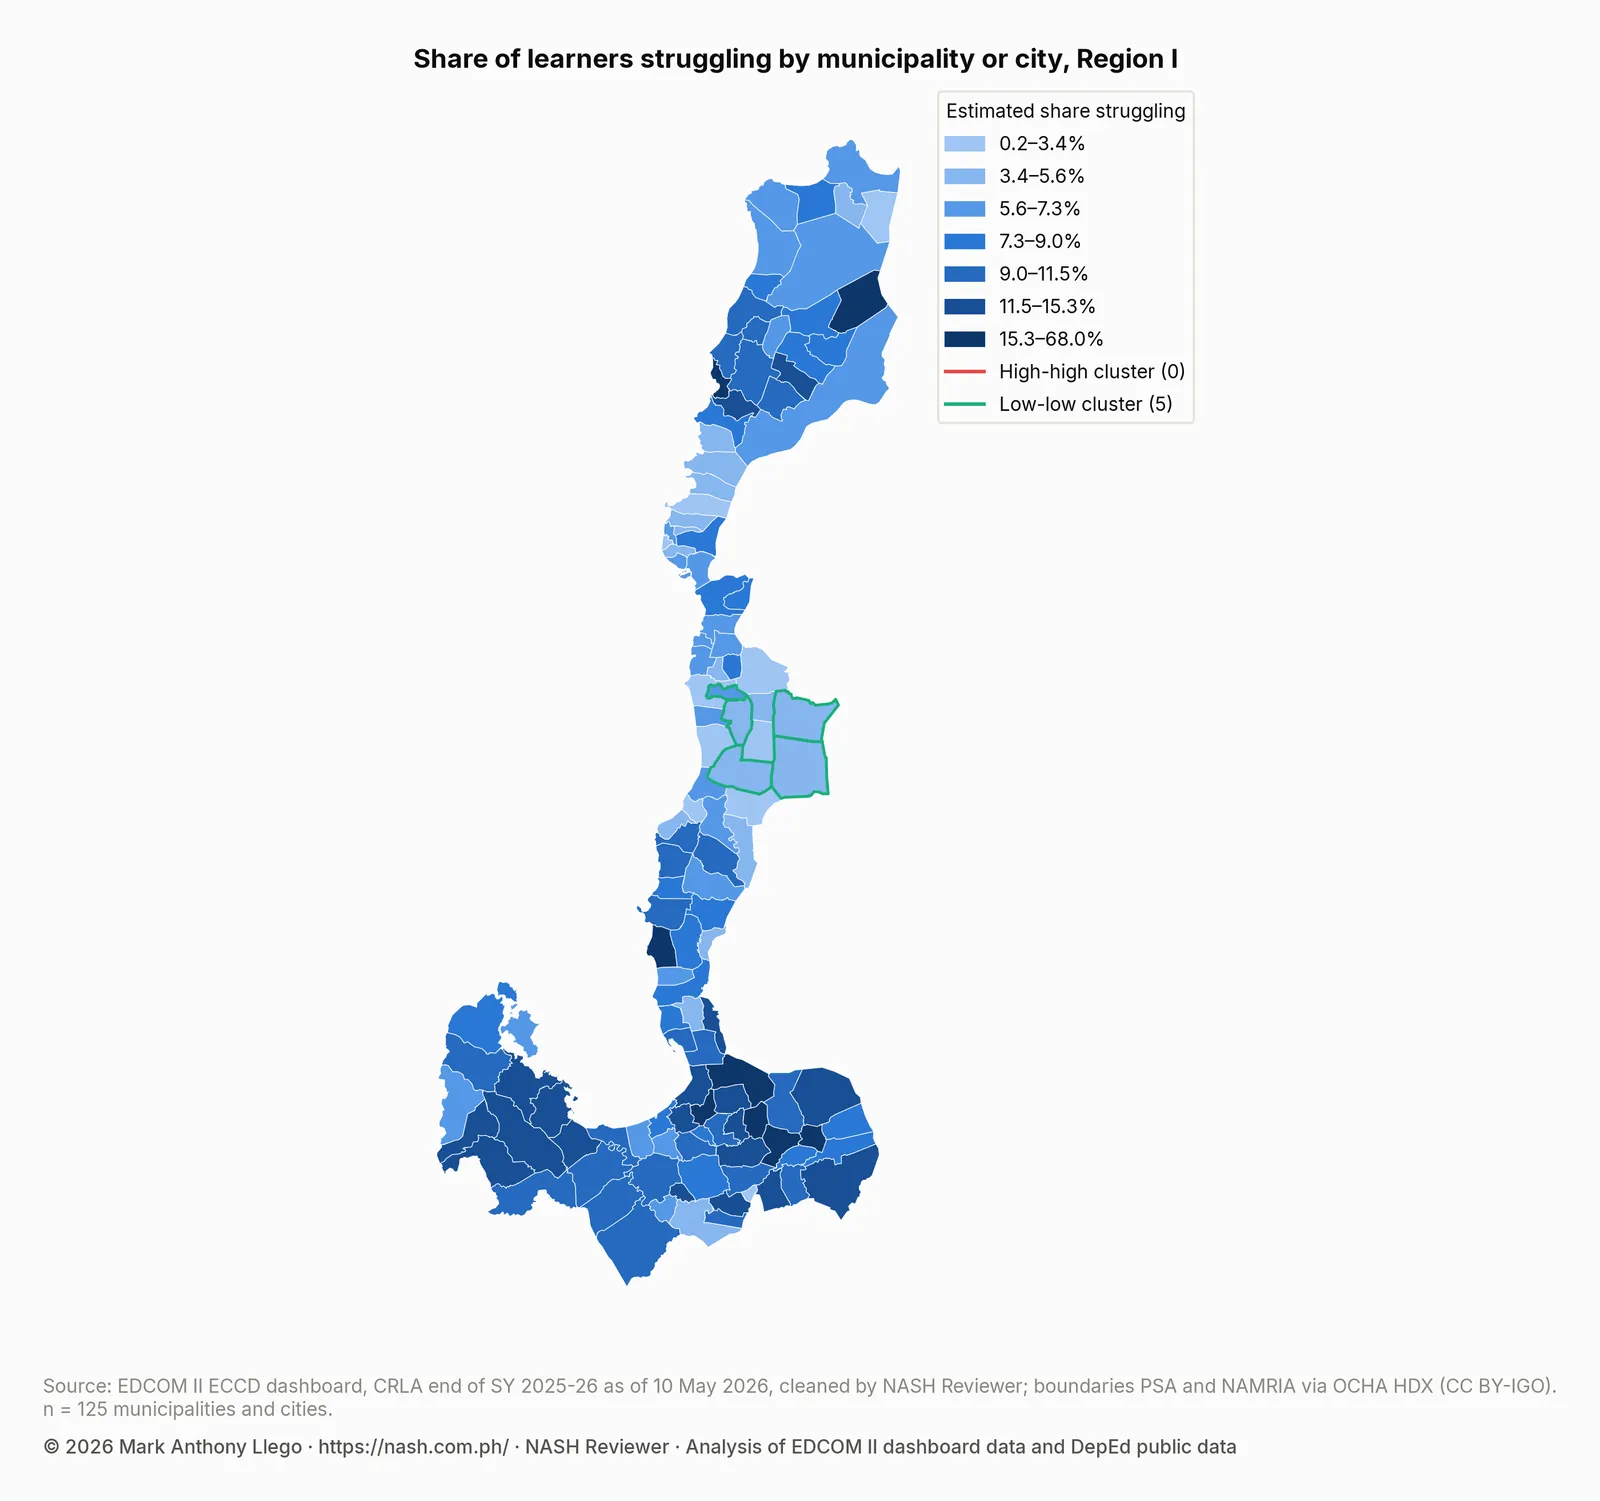
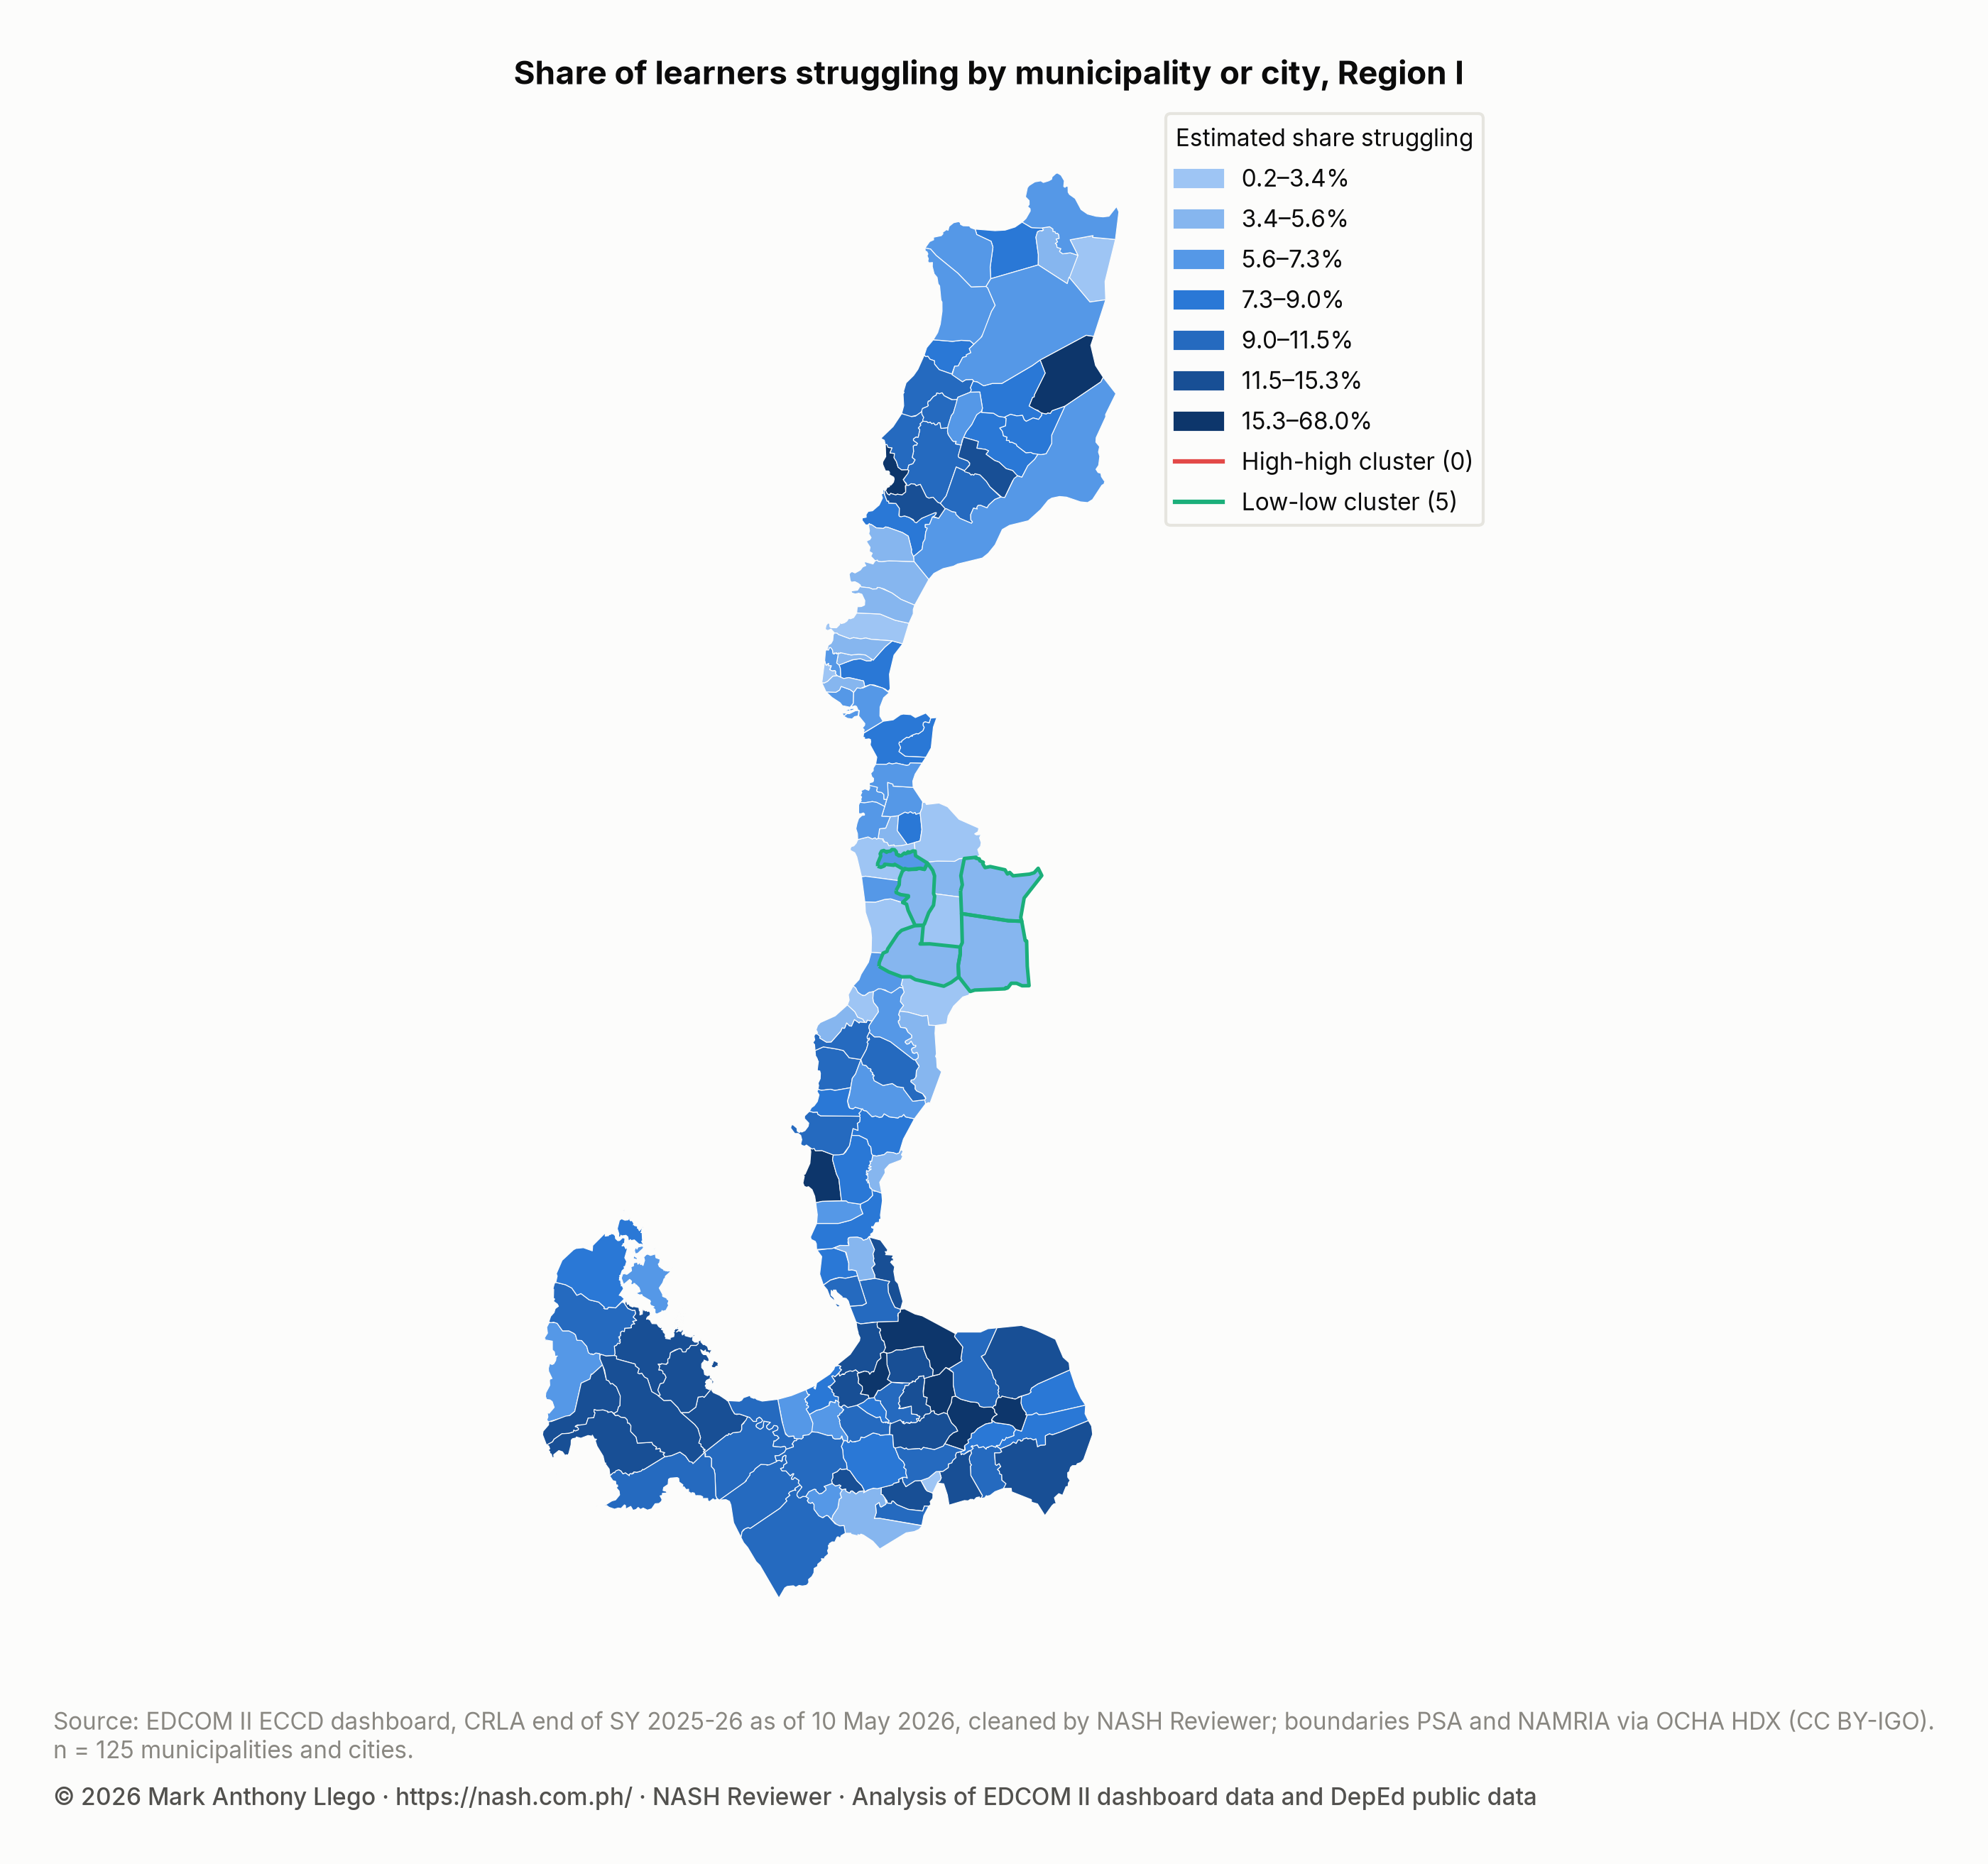
- The five municipalities and cities with the most struggling readers are all in Pangasinan, and the map shows 5 low-low clusters and 0 high-high clusters.
- Region I’s toddlers are less often stunted than the country’s (2.3% against 4.3% for ages 0–2), and fewer of its barangays lack a child development center (6.4% against 10.9%).
- 92.1% of Region I’s schools had internet in SY 2023-24, against 76.3% nationally, and within divisions, schools with internet had fewer struggling readers, as they do nationally.
- Over the year, matched Region I schools in DepEd’s file went from 14.2% to 46.9% at grade level, and from 41.8% to 9.1% struggling.
Reading levels by grade and language in Region I
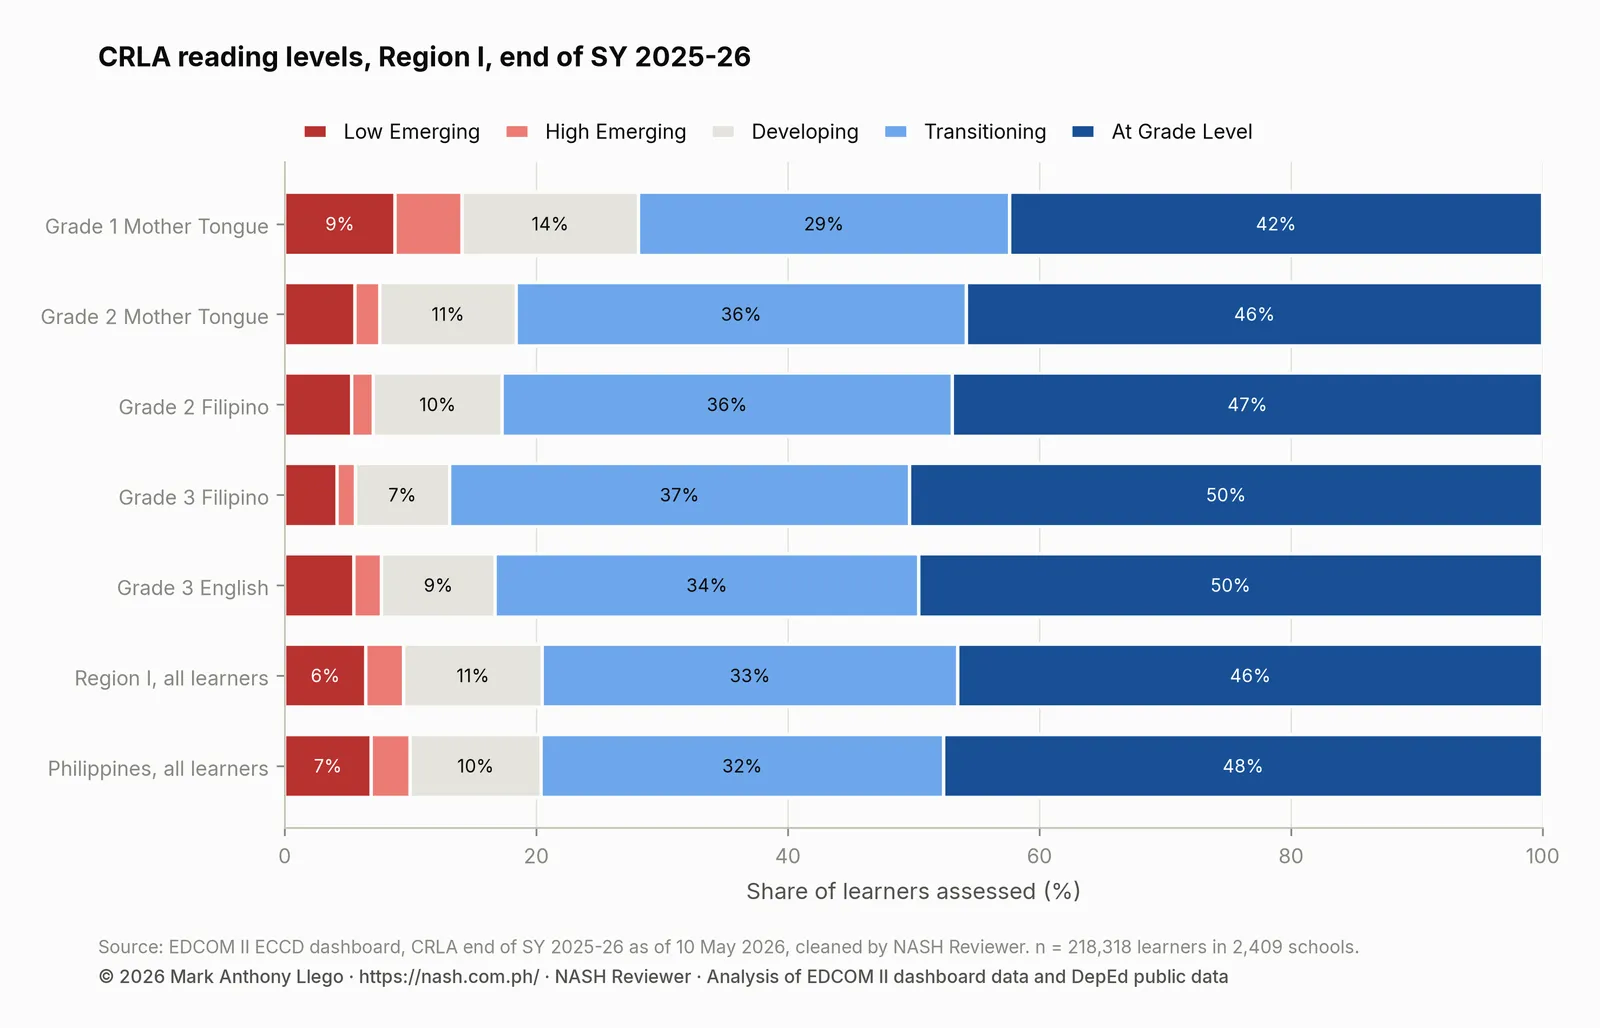
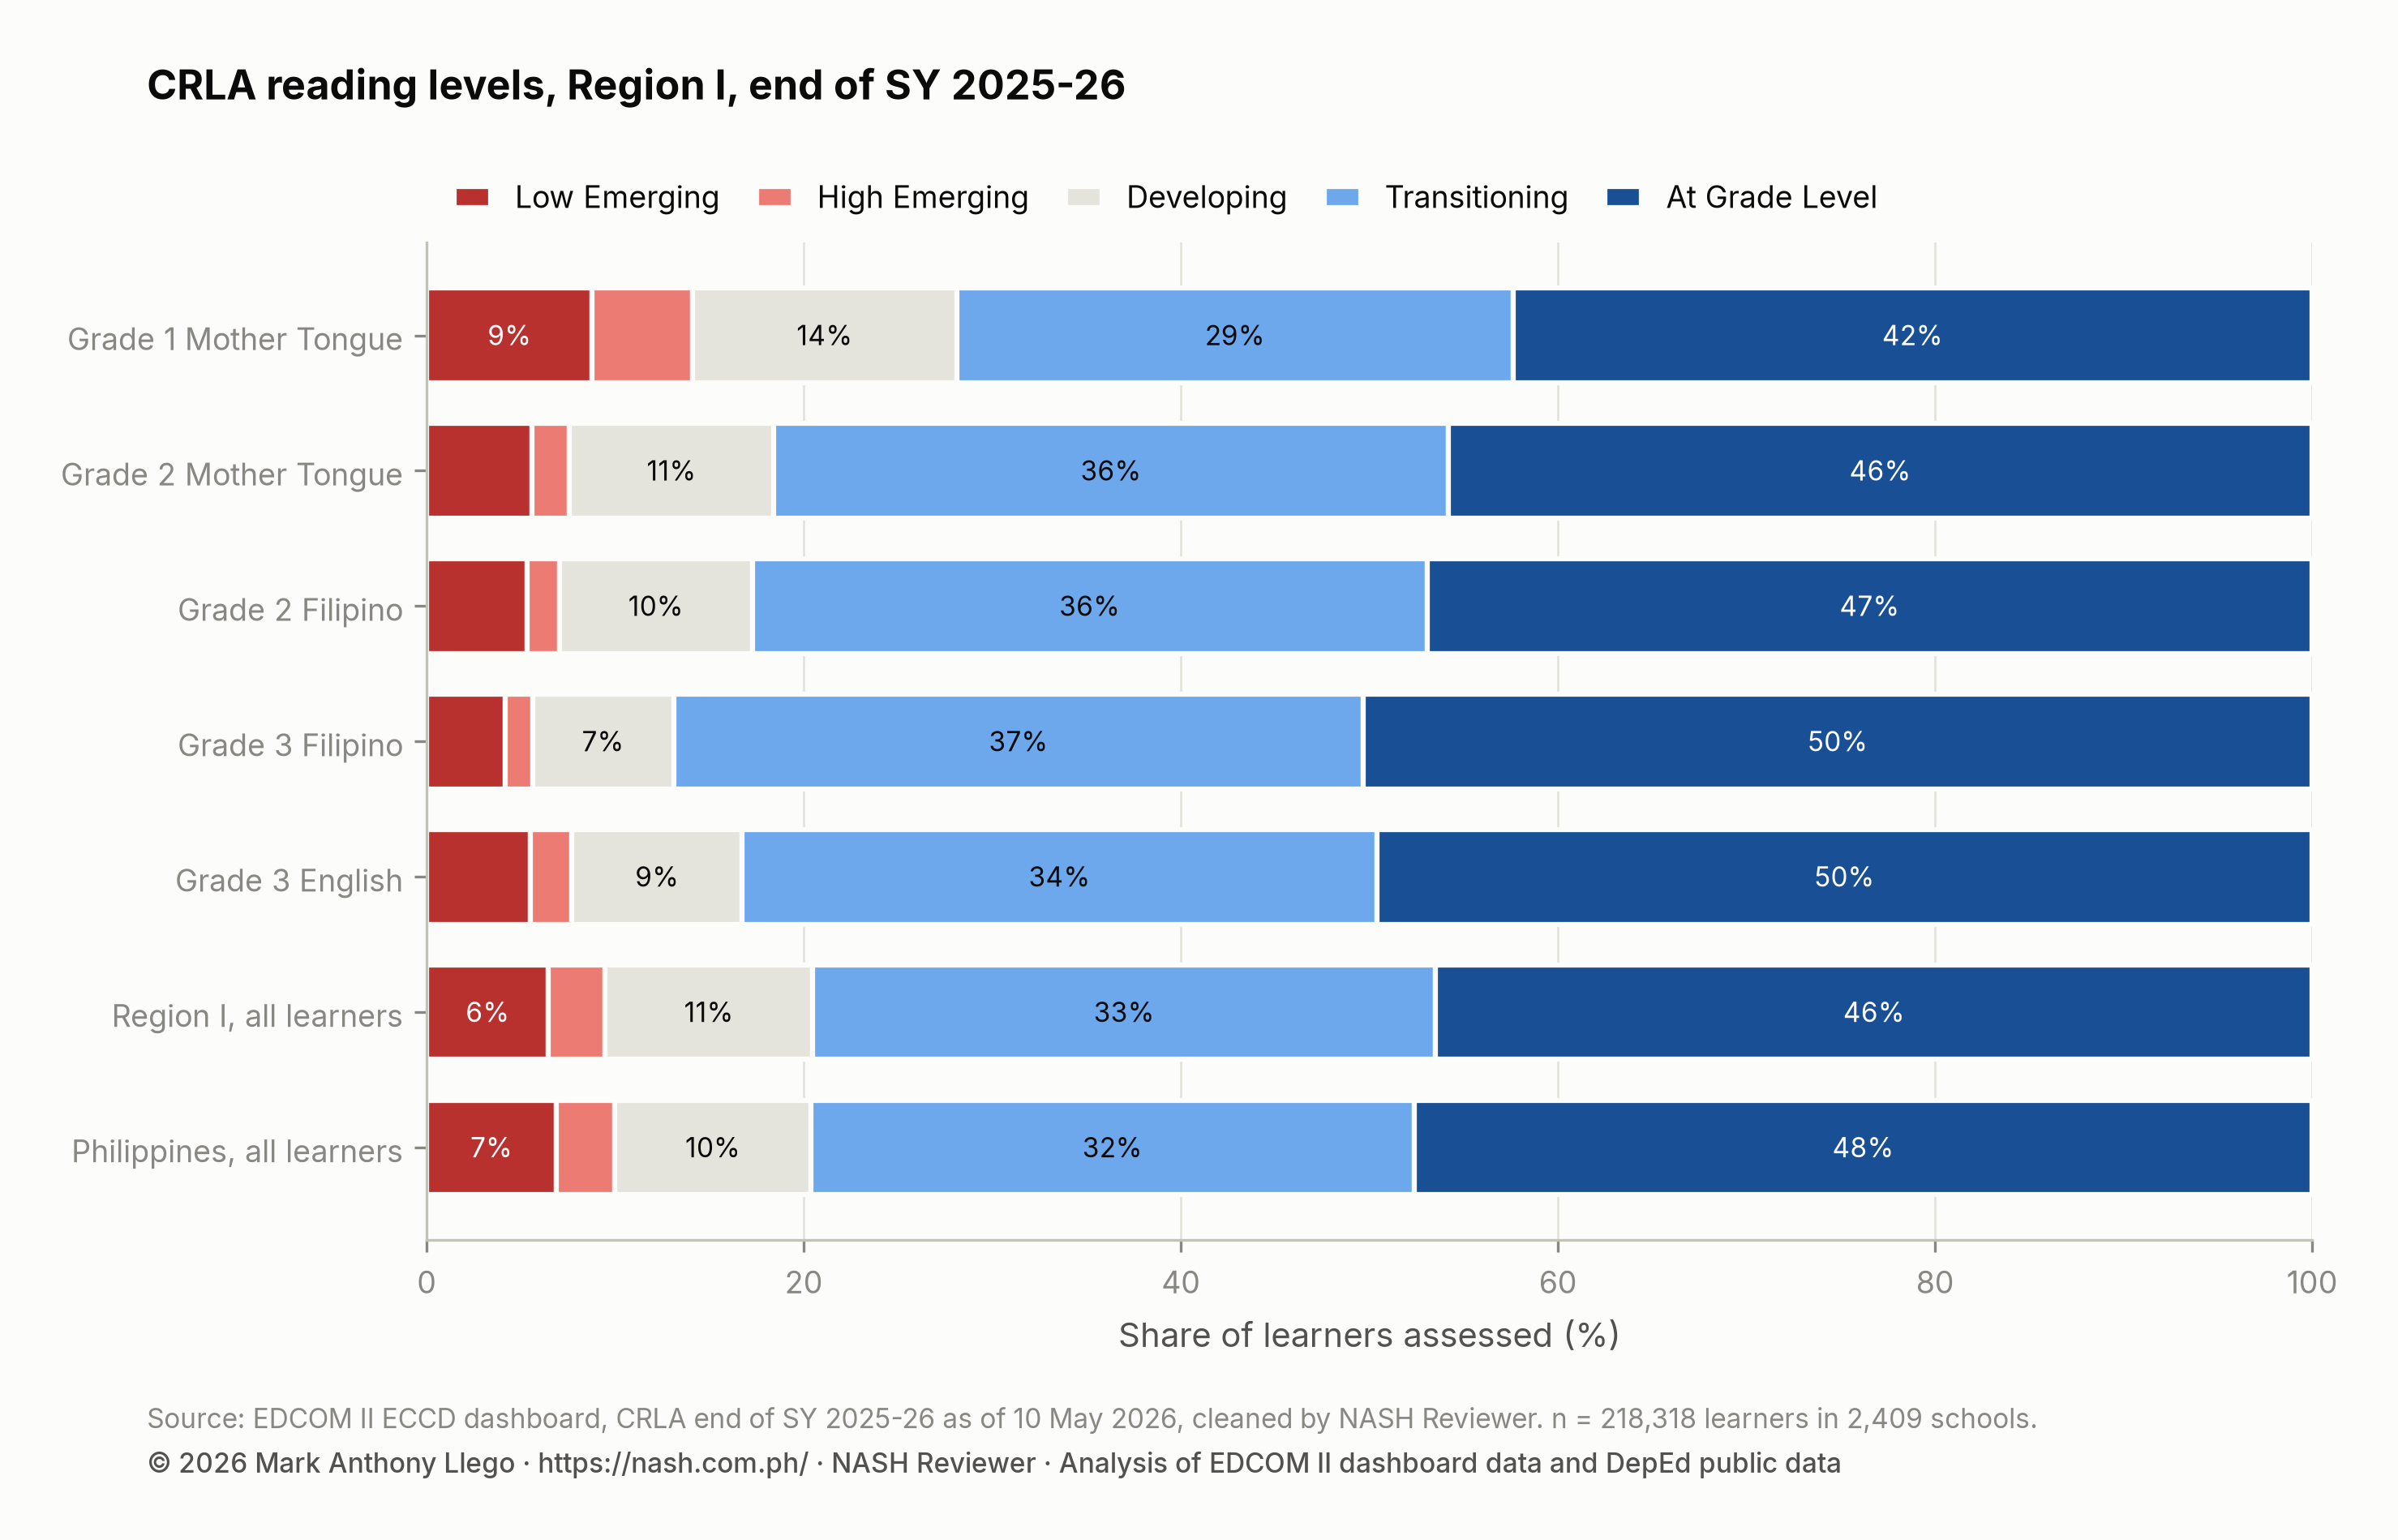
The levels table compares Region I with the Philippines in each grade-and-language block, from Low Emerging to At Grade Level.
| Grade and language | Learners | Low Emerging | High Emerging | Developing | Transitioning | At Grade Level | Struggling |
|---|---|---|---|---|---|---|---|
| Grade 1 Mother Tongue | 67,997 | 8.8% | 5.3% | 14.0% | 29.5% | 42.4% | 14.1% |
| Grade 2 Mother Tongue | 67,754 | 5.6% | 2.0% | 10.8% | 35.8% | 45.8% | 7.6% |
| Grade 2 Filipino | 72,215 | 5.3% | 1.7% | 10.2% | 35.8% | 47.0% | 7.0% |
| Grade 3 Filipino | 77,589 | 4.2% | 1.4% | 7.5% | 36.6% | 50.3% | 5.6% |
| Grade 3 English | 78,106 | 5.5% | 2.2% | 9.0% | 33.7% | 49.6% | 7.7% |
| Region I, all learners | 218,318 | 6.5% | 3.0% | 11.0% | 33.1% | 46.5% | 9.5% |
| Philippines, all learners | 5,127,670 | 6.9% | 3.1% | 10.4% | 32.0% | 47.6% | 10.0% |
Region I sits just under the national share at grade level in all five blocks. The gap is smallest in Grade 2 Filipino and largest in Grade 1 Mother Tongue, where 42.4% of learners read at grade level, against 45.4% nationally. In that block 14.1% are struggling readers, and 8.8% are at Low Emerging.
By Grade 3 the region is close to the national share in both Filipino (50.3%) and English (49.6%), so the shortfall is concentrated at the start of schooling.
Schools divisions in Region I
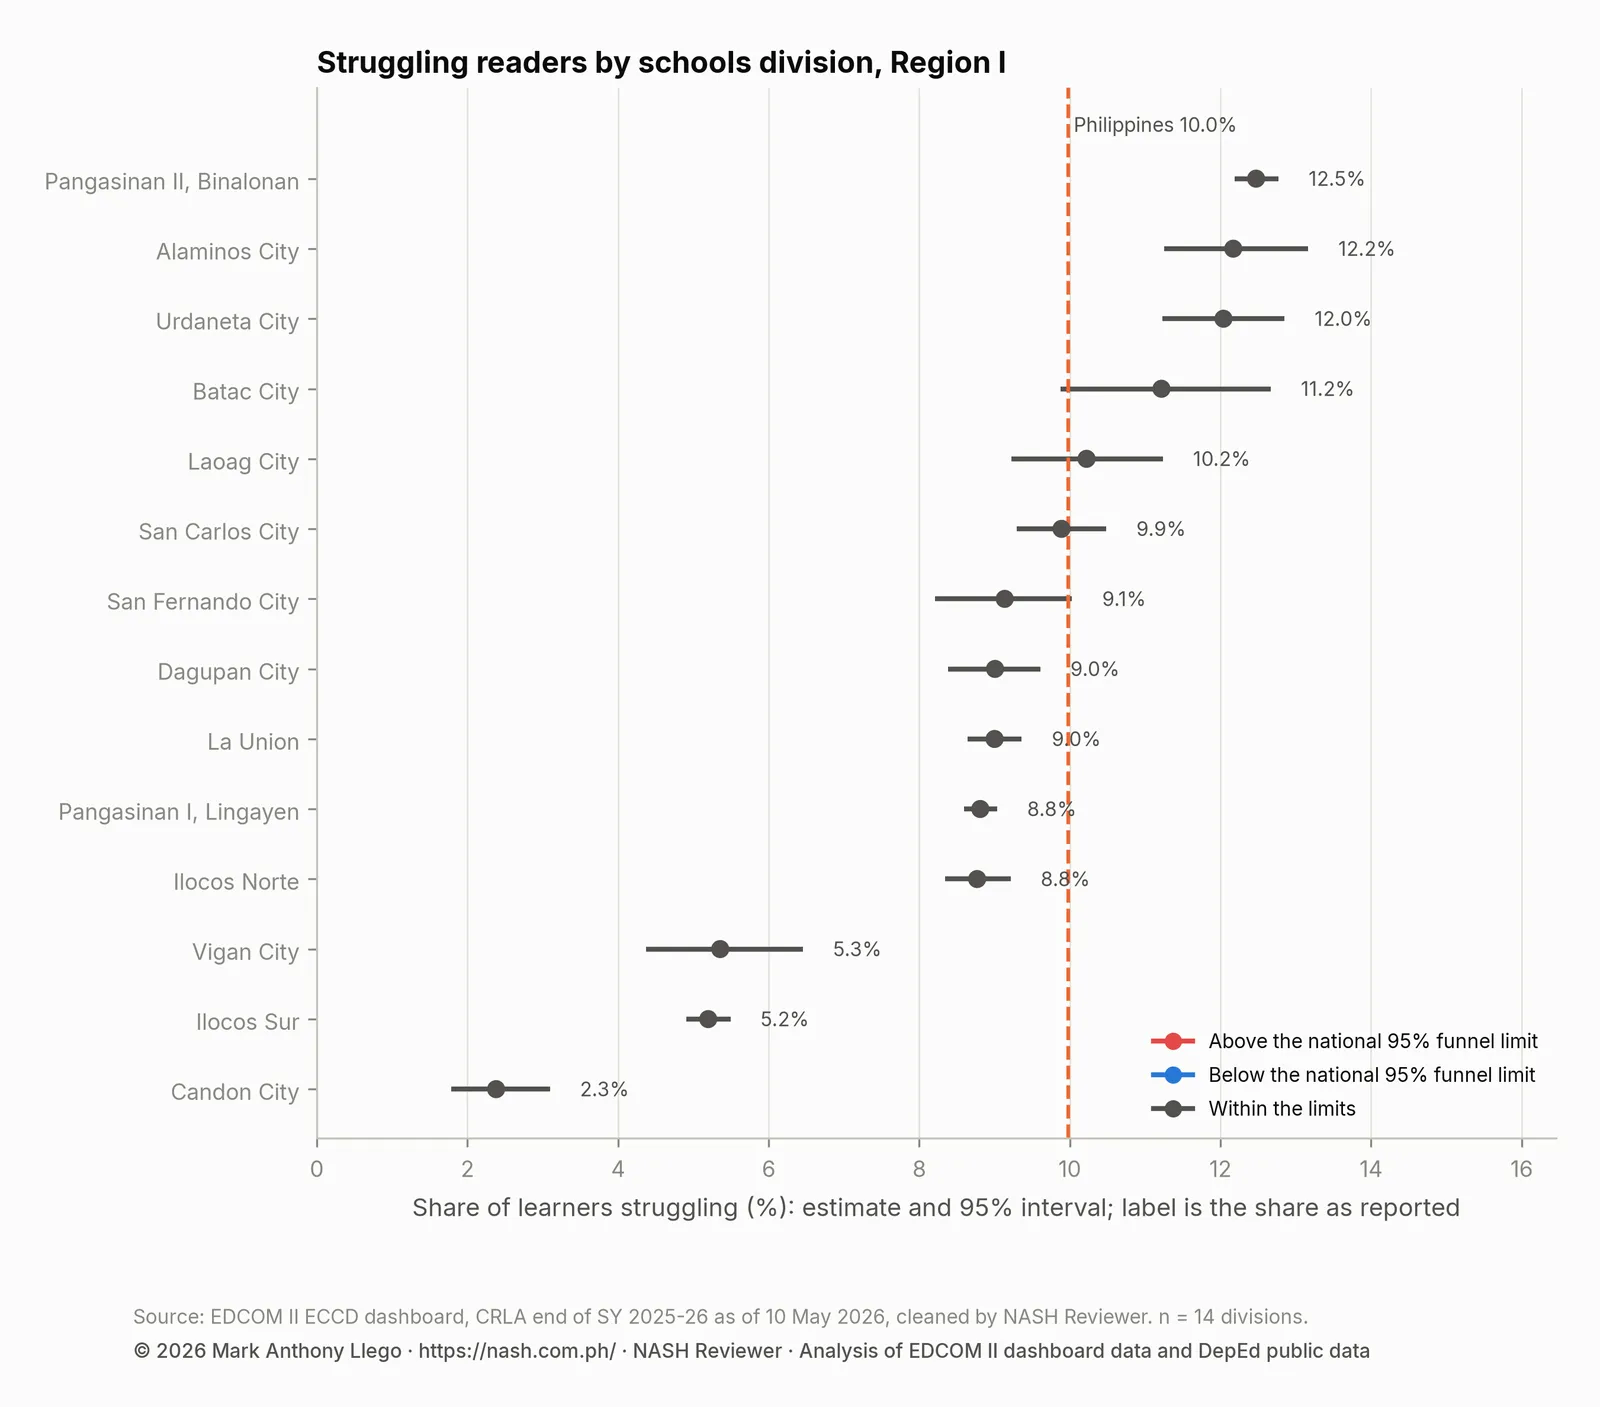
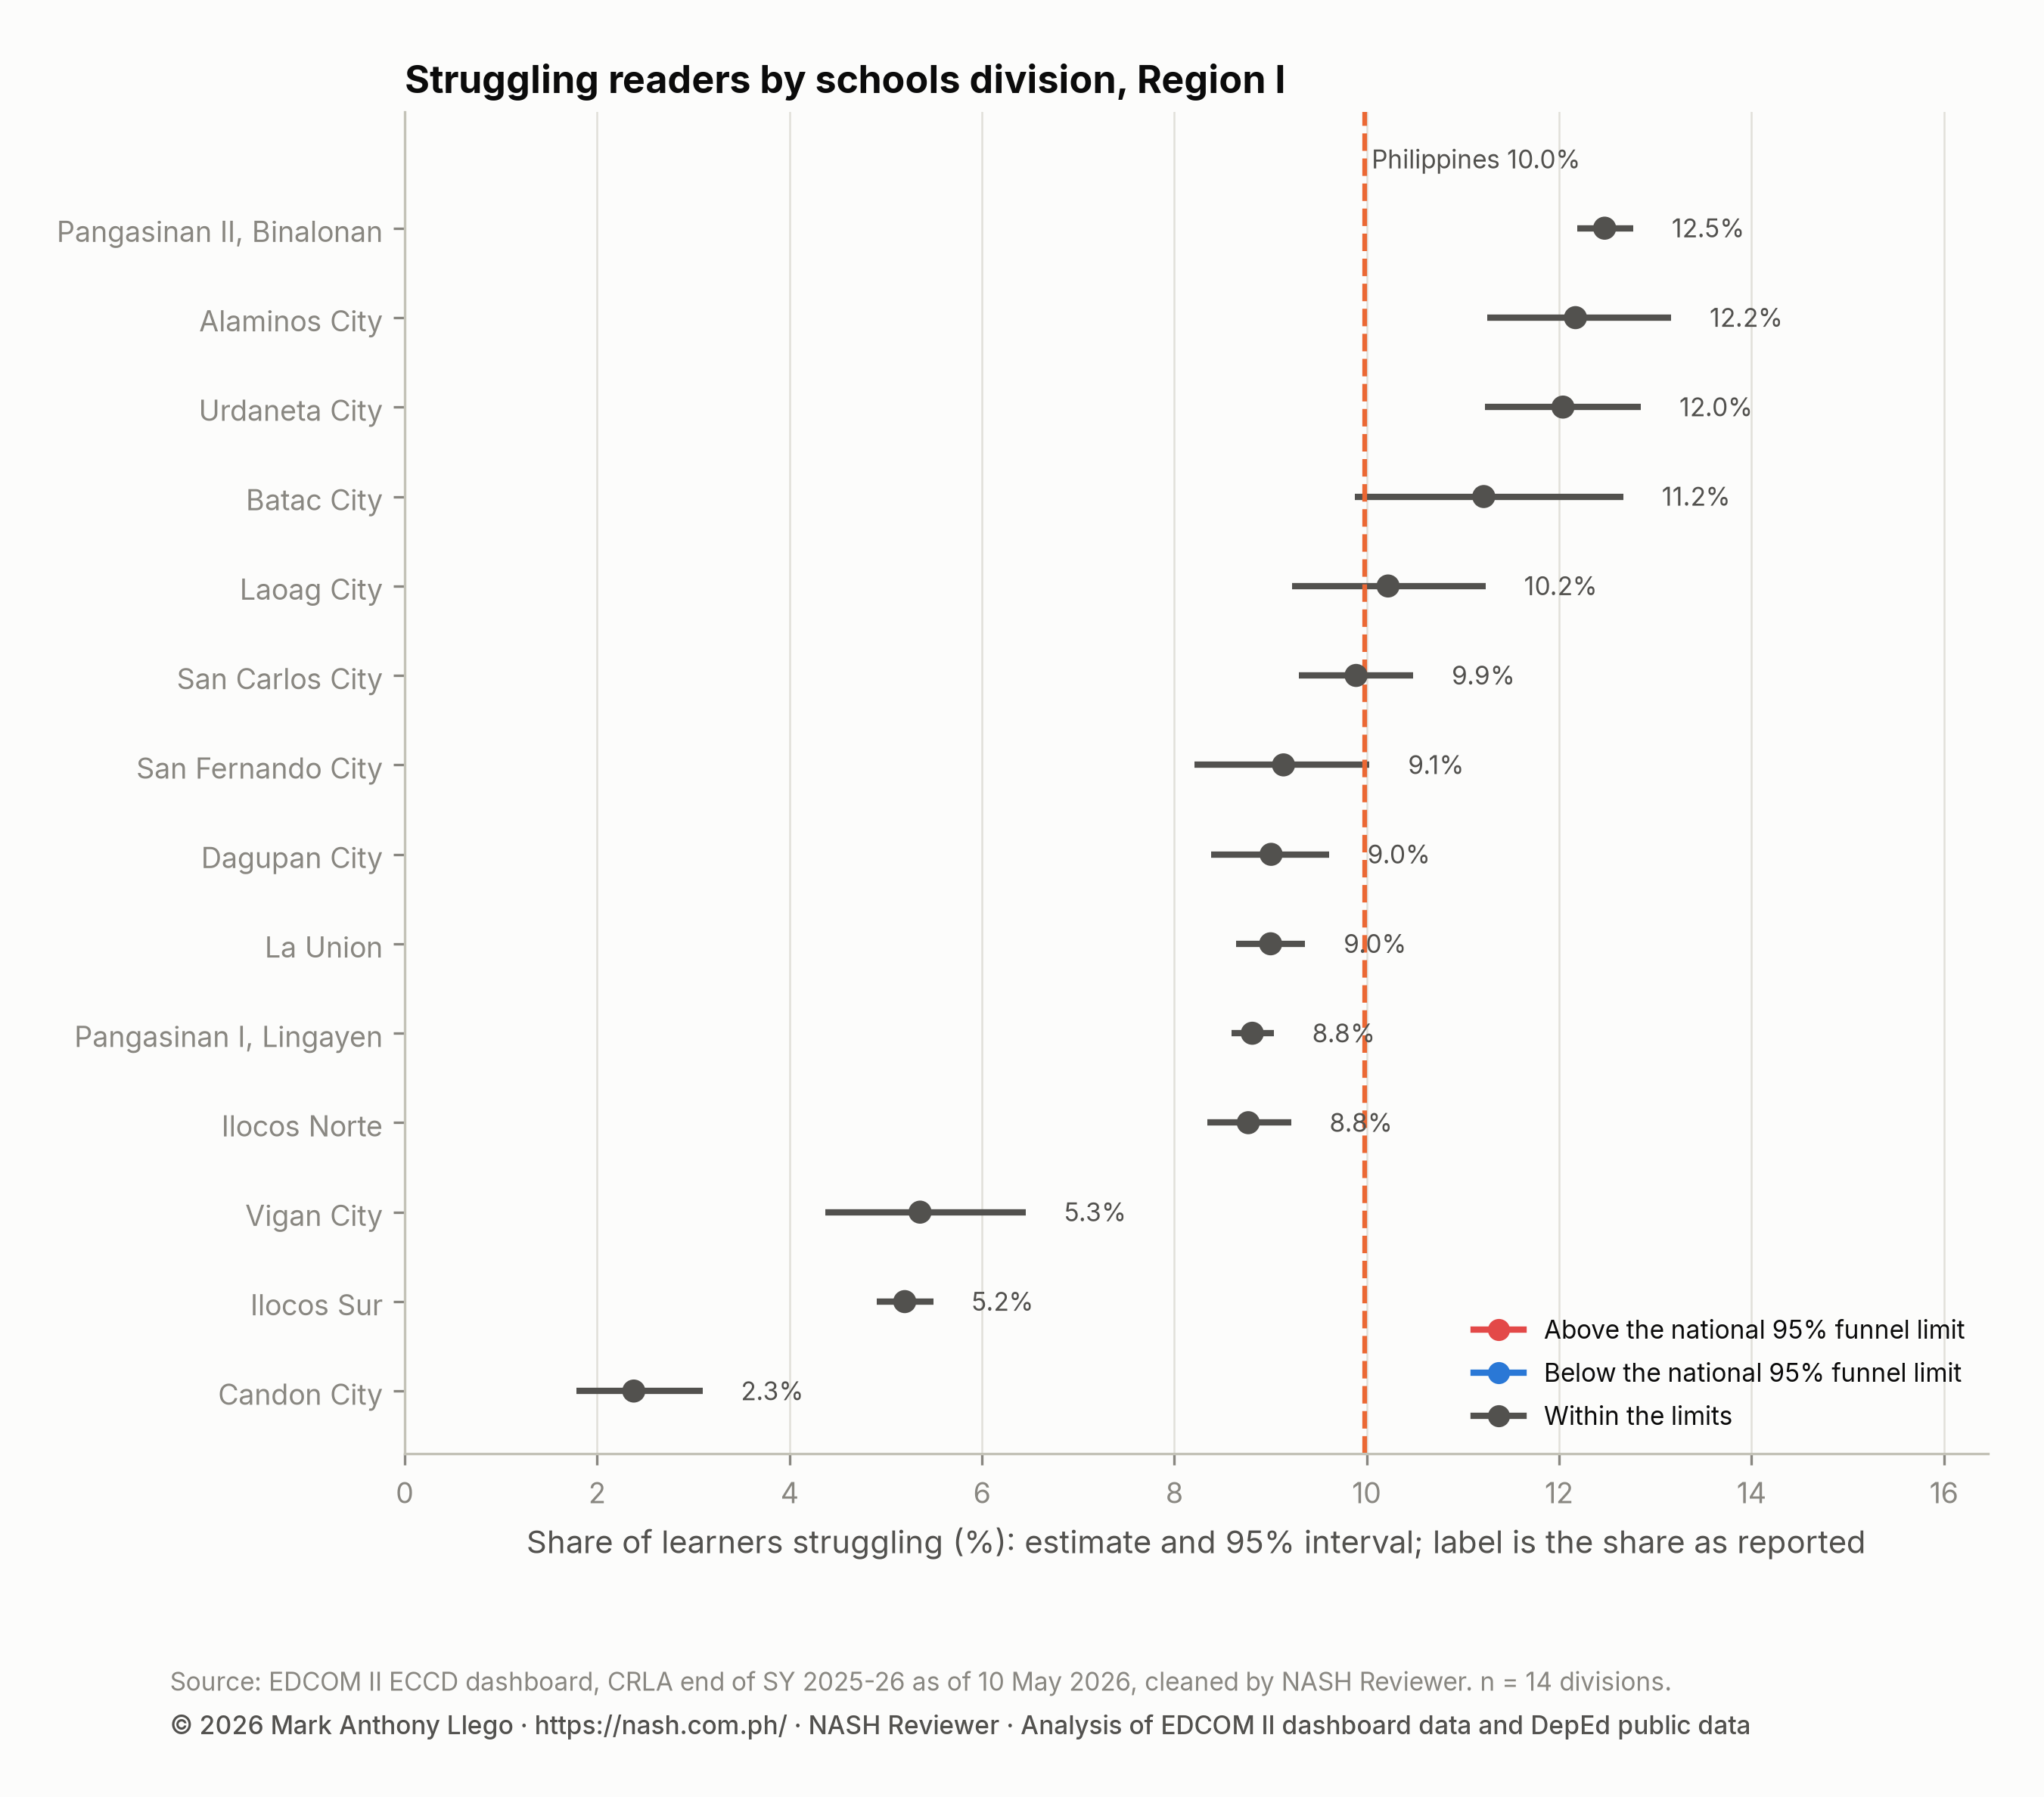
Region I splits into 14 schools divisions: Pangasinan’s two large provincial divisions, the divisions of the other provinces, and a set of small city divisions. The table gives each one’s learners, struggling readers, estimated share with its 95% interval, rank among the 232 divisions and funnel result.
| Division | Schools | Learners | Struggling readers | Share struggling | Estimate (95% interval) | National rank of 232 (95% interval) | National funnel |
|---|---|---|---|---|---|---|---|
| Alaminos City | 38 | 4,383 | 534 | 12.2% | 12.2% (11.3%–13.2%) | 179 (166–190) | within limits |
| Batac City | 26 | 1,896 | 213 | 11.2% | 11.2% (9.9%–12.7%) | 166 (145–186) | within limits |
| Candon City | 28 | 2,102 | 48 | 2.3% | 2.4% (1.8%–3.1%) | 8 (5–17) | within limits |
| Dagupan City | 34 | 8,053 | 725 | 9.0% | 9.0% (8.4%–9.6%) | 125 (105–139) | within limits |
| Ilocos Norte | 318 | 16,415 | 1,439 | 8.8% | 8.8% (8.3%–9.2%) | 117 (103–130) | within limits |
| Ilocos Sur | 451 | 21,979 | 1,141 | 5.2% | 5.2% (4.9%–5.5%) | 46 (43–49) | within limits |
| La Union | 314 | 25,934 | 2,334 | 9.0% | 9.0% (8.6%–9.4%) | 124 (113–134) | within limits |
| Laoag City | 31 | 3,443 | 352 | 10.2% | 10.2% (9.2%–11.2%) | 150 (130–166) | within limits |
| Pangasinan I, Lingayen | 552 | 63,113 | 5,560 | 8.8% | 8.8% (8.6%–9.0%) | 119 (111–126) | within limits |
| Pangasinan II, Binalonan | 466 | 49,380 | 6,160 | 12.5% | 12.5% (12.2%–12.8%) | 186 (179–188) | within limits |
| San Carlos City | 60 | 9,728 | 962 | 9.9% | 9.9% (9.3%–10.5%) | 146 (132–154) | within limits |
| San Fernando City | 27 | 3,823 | 349 | 9.1% | 9.1% (8.2%–10.0%) | 128 (101–148) | within limits |
| Urdaneta City | 46 | 6,291 | 758 | 12.0% | 12.0% (11.2%–12.9%) | 177 (166–188) | within limits |
| Vigan City | 18 | 1,778 | 94 | 5.3% | 5.4% (4.4%–6.5%) | 47 (35–61) | within limits |
Empirical Bayes estimates start from the national rate and move toward each division’s own share as its learner count grows. The funnel plot asks whether a division sits further from the national share than chance allows; no Region I division does.
Pangasinan II, based in Binalonan, has both the highest share and the most struggling readers; Pangasinan I, Lingayen assesses more learners but has a lower share. At the other end, Candon City (2.3%) lies far below the regional share, though its 95% interval, resting on few learners, is wider than those of the large provincial divisions.
505 Region I schools report no struggling reader, more than the 401 a model expects from schools of their size, a ratio of 1.26. That excess is a reason for a records review, not an accusation, and CRLA Schools With No Struggling Readers: A Data Check describes how such a review works.
Languages of instruction
The most common language of instruction is Ilocano (53% of schools), but Tagalog-language schools, fewer and larger, assess more learners. The table shows the 4 language groups.
| Language of instruction | Schools | Learners | Share struggling | At Grade Level |
|---|---|---|---|---|
| Ilocano | 1,266 | 78,731 | 8.3% | 47.6% |
| Tagalog | 984 | 118,969 | 10.1% | 45.9% |
| Pangasinan | 148 | 19,641 | 10.5% | 45.4% |
| Other | 10 | 851 | 6.9% | 53.7% |
Ilocano-language schools have a lower share of struggling readers than Tagalog- and Pangasinan-language schools. Language and place overlap, since Pangasinan-language schools are in Pangasinan, so this comparison cannot separate the two.
In Grade 2, the Filipino share at grade level minus the mother-tongue share is +1.6 percentage points, against -0.8 nationally, the reverse of the pattern in CRLA by Language.
Where struggling readers are concentrated in Region I
Everything in this section is about places, not individual children. Region I’s 125 municipalities and cities are each colored by an estimated share of struggling readers, on the scale used for the whole country.
By count, the most struggling readers are in San Carlos City, Pangasinan (962); City of Urdaneta, Pangasinan (758); Dagupan City, Pangasinan (725); Mangaldan, Pangasinan (654); Malasiqui, Pangasinan (583), all in Pangasinan, where the region’s largest divisions are. The highest estimated shares are in Currimao, Ilocos Norte (20.9%); Sison, Pangasinan (17.1%); Binalonan, Pangasinan (16.8%); Carasi, Ilocos Norte (16.2%); Tayug, Pangasinan (16.2%), so Ilocos Norte appears beside Pangasinan.
A cluster test looks for places whose own share and whose neighbors’ shares are both unusually high, or both unusually low, compared with the country. Region I has 0 high-high clusters and 5 low-low clusters, so even its highest shares are not part of a wider hotspot.
| Municipality or city | Province | Struggling readers | Learners | Estimated share struggling | Cluster |
|---|---|---|---|---|---|
| San Carlos City | Pangasinan | 962 | 9,728 | 9.9% | No cluster |
| City of Urdaneta | Pangasinan | 758 | 6,291 | 12.0% | No cluster |
| Dagupan City | Pangasinan | 725 | 8,053 | 9.0% | No cluster |
| Mangaldan | Pangasinan | 654 | 4,802 | 13.6% | No cluster |
| Malasiqui | Pangasinan | 583 | 7,182 | 8.1% | No cluster |
Early childhood: stunting and day care centers
Stunting among Region I’s children aged 0–2, from Operation Timbang Plus 2025, is below the national share: 2.3% of the 133,852 measured, against 4.3%. Ilocos Norte (5.0%) is highest. The DILG list of barangays without a child development center (CDC), the barangay day care center, names 209 of 3,267 barangays (6.4%), against 10.9% nationally.
| Province or highly urbanized city | Children 0–2 measured | Stunted | Barangays without a CDC | Learners struggling |
|---|---|---|---|---|
| Ilocos Norte | 11,766 | 5.0% | 52 of 559 | 9.2% |
| Ilocos Sur | 14,690 | 2.5% | 59 of 768 | 5.0% |
| La Union | 19,307 | 3.4% | 36 of 576 | 9.0% |
| Pangasinan | 88,089 | 1.7% | 62 of 1,364 | 10.4% |
The province table shows a reversal: Pangasinan has the lowest stunting in the region and the highest share of struggling readers. Stunting is measured in toddlers and reading in Grades 1–3, so the reversal concerns provinces, not children. Stunting, Day Care Centers and Early Reading tests across all municipalities whether the two measures move together.
School resources
Inputs come from DepEd’s SY 2023-24 school files, two years before these results. Region I’s column gives the median school for the two ratios and the share of schools for the rest, next to the Philippines.
| School input (SY 2023-24) | Region I | Philippines |
|---|---|---|
| Learners per teacher (elementary) | 21.3 | 22.8 |
| Learners per classroom (elementary) | 21.7 | 25.8 |
| Schools with internet | 92.1% | 76.3% |
| Schools with electricity | 99.5% | 97.6% |
| Schools with a water supply | 99.1% | 97.8% |
| Schools with no functional toilet | 0.6% | 2.3% |
| Schools with multigrade classes | 11.9% | 15.3% |
Region I’s schools are well connected: 92.1% report internet, against 76.3%, and the median school had 21.7 learners per classroom, against 25.8.
To see which inputs track reading inside the region, a separate model compared each Region I school only with schools in its own division, with intervals widened for the extra school-to-school variation in results. An odds ratio below 1 means fewer struggling readers and above 1 more. Of the inputs in Region I’s model, 3 have a 95% interval that excludes 1: school size: odds ratio 0.91 (0.84–0.98); internet: odds ratio 0.76 (0.62–0.94); income class 4th: odds ratio 0.47 (0.27–0.82). Income classes are set against first-class municipalities.
Each points the same way as the national model: within a division, larger schools and schools with internet had fewer struggling readers, and so did schools in fourth-class municipalities, compared with first-class ones. Learners per teacher, which goes with more struggling readers nationally, has an interval that includes 1 in Region I, so the region’s data cannot separate it from no association. Electricity and water reach nearly every school, which leaves their intervals wide.
School heads
Region I is a little above the country on principals: 45.3% of its schools have a School Principal position in DepEd’s SY 2023-24 personnel file, against 40.7%, while 17.9% have no head position. The raw gap is small: 9.5% struggling in schools led by a principal, 9.3% in the rest. The adjusted national comparison, which weighs schools alike in size, inputs and division, is in CRLA Results in Schools With and Without a Principal.
Programs recorded in Region I
The EDCOM II dashboard records 14 programs run by NGOs and corporate foundations in Region I, 14.0% of its list, while the region holds only 4.0% of the country’s struggling readers. Its records cover Nutrition (6); Literacy (5); Childcare (3) by category and, by type, Book/Reading Material Donation (3); Stunting Prevention Program (2); Nutrition Counseling for Mothers (2); CDC Facility Upgrade (1); Early Grade Reading Intervention (1); Day Care Worker Training (1); Supplementary Feeding (0-2yo) (1); Growth Monitoring & Weighing (1); Reading Remediation (Grades 1-3) (1); Child Development Center (CDC) Establishment (1). The list holds what organizations reported, not every program, as the programs comparison notes.
Start and end of the year
DepEd’s selected-school CRLA file includes Region I. DepEd does not say which round that file covers, but its date and results point to the start of the year. In the same schools, the share at grade level went from 14.2% to 46.9%, a change of +32.7 percentage points, and the struggling share from 41.8% to 9.1%. The matched schools are a subset, so these differ a little from the regional shares above. CRLA Start vs End of SY 2025-26 in the Same Schools sets out the matching; the change shows what happened over the year, not why.
What this means for school heads in Region I
Give Grade 1 the most attention. It is the block furthest below the national share, with the largest share of learners at Low Emerging.
Read Filipino and mother-tongue results together. Grade 2 learners here reach grade level more often in Filipino, so comparing a learner’s two results can show whether the difficulty is with reading itself or with the language.
In Pangasinan, plan by both count and share. The province holds the largest numbers of struggling readers, while some smaller places elsewhere have higher shares.
How these numbers were made
The figures are end-of-year CRLA results for SY 2025-26 in public schools, as of 10 May 2026, from the EDCOM II early-childhood (ECCD) dashboard. Each learner enters the count once, through Grade 1 Mother Tongue, Grade 2 Filipino or Grade 3 English. DepEd’s SY 2023-24 files supply the school inputs and school heads. Methods are explained in the all-region report and in How to Read a School’s CRLA Results Fairly.
Limits
Regional shares include nearly every learner and carry no sampling interval, but they depend on how schools recorded results. School inputs predate the results by two school years, and early-childhood figures describe younger children. What the report shows are associations; none establishes a cause.
Frequently asked questions
Is Region I above or below the national CRLA share of struggling readers?
Slightly below. 9.5% of the Grade 1–3 learners assessed in Region I were struggling readers at the end of SY 2025-26, close to the national 10.0%, and 46.5% read at grade level.
Which Region I division has the most struggling readers, and is it an outlier?
Pangasinan II, Binalonan (6,160 struggling readers). It also has the highest share in a division range of 2.3% to 12.5%, but it is not an outlier by national standards: it stays within the national funnel limits.
Do Grade 2 learners in Region I read better in Filipino or in the mother tongue?
In Filipino, slightly. The Filipino share at grade level minus the mother-tongue share is +1.6 percentage points, while nationally it is -0.8.
Download the data
The cleaned EDCOM II dashboard data behind this series are free to download for personal study; to reuse them, email support@nash.com.ph for written permission first. How the EDCOM Dashboard Data Was Cleaned explains every table and cleaning rule. The files are at data.nash.com.ph: start with the README, then the school table with CRLA results and school inputs (Parquet), the school estimates (CSV), the division estimates (CSV) and the municipal table (CSV). The DepEd school files used for school inputs are described in Download Cleaned DepEd School Data.
Every file, with its rows, columns and checksum, is listed on the EDCOM II CRLA data page. To cite the data: Llego, M. A. (2026). EDCOM II early-childhood dashboard data, cleaned, version 1. NASH Reviewer. https://nash.com.ph/edcom-data
More in this series
- CRLA End-of-Year Results SY 2025-26: All 18 Regions
- CRLA Start vs End of SY 2025-26 in the Same Schools
- CRLA by Language: Mother Tongue, Filipino and English
- How to Read a School’s CRLA Results Fairly
- CRLA Variation: School, Division or Region?
- Where Struggling Readers Are Concentrated
- School Resources and CRLA Reading Results
- CRLA Results in Schools With and Without a Principal
- Action Research and Thesis Topics on Reading (CRLA)
- CRLA Reading Hotspots: A Map of Struggling Readers
- Stunting, Day Care Centers and Early Reading
- Literacy and Nutrition Programs Compared With Need
- CRLA Schools With No Struggling Readers: A Data Check
- How the EDCOM Dashboard Data Was Cleaned
- Regional reports: NCR, CAR, Region I, Region II, Region III, Region IV-A, MIMAROPA, Region V, Region VI, NIR, Region VII, Region VIII, Region IX, Region X, Region XI, Region XII, Caraga, BARMM
- Earlier reports: CRLA Results SY 2025-2026 (DepEd’s selected-school file), Do the Same DepEd Schools Lag on the ELLNA, NAT and CRLA?, DepEd School Inputs vs Test Results, EDCOM II Final Report: Guide for Aspiring School Heads, DepEd Data for Aspiring School Heads: Where to Start
Analysis and charts by Mark Anthony Llego for NASH Reviewer. Data: EDCOM II early-childhood dashboard and Department of Education public datasets. NASH Reviewer is not affiliated with EDCOM II or DepEd. Charts may be reused only with written permission from support@nash.com.ph.