On the Comprehensive Rapid Literacy Assessment (CRLA) at the end of SY 2025-26, public schools that reported a School Principal position had a weighted average share of 9.7% struggling readers, against 10.9% in comparable schools without one, once the two groups are weighted to be alike in size, inputs and location. The difference is -1.2 percentage points (95% interval -1.6 to -0.8). It held in every check, and it is modest in size.
Before any adjustment the gap looks larger: 9.2% against 11.3%. Schools with a principal are much bigger, and more often urban and connected to the internet, than schools led by a head teacher or a teacher-in-charge. Those differences account for part of the raw gap. The comparison covers 37,578 public schools. It describes an association: schools with a principal had somewhat fewer struggling readers than similar schools without one. That is not the same as showing what a principal does for reading.
Key findings
- Of the 37,578 public schools compared, 15,440 (41.1%) reported a School Principal position in SY 2023-24 and 22,138 did not.
- Before adjustment, the average school share of struggling readers was 9.2% in schools with a principal and 11.3% in schools without one, a gap of -2.1 percentage points.
- The two groups are not alike: median elementary enrollment was 375 learners in schools with a principal and 137 in schools without one, and the largest standardized difference in school features was 1.34.
- After overlap weighting on size, inputs, location and division, the shares were 9.7% and 10.9%: a difference of -1.2 points (95% interval -1.6 to -0.8) and a risk ratio of 0.89.
- Schools with a principal had fewer struggling readers in 5 of 5 weighted analyses, and the 95% interval excluded zero in 5 of 5, with differences from -1.2 to -2.1 points.
- An unmeasured factor would have to be linked to both having a principal and reading results by a risk ratio of at least 1.50 to explain the difference away, a moderate bar rather than a high one.
Who leads public schools: principals, head teachers and teachers-in-charge
The school-head classification comes from DepEd’s SY 2023-24 personnel file and follows DepEd Principals and Head Teachers per School, SY 2023-2024. Each school is placed by the highest school-leadership position it reports. That is a School Principal (Principal I to IV), an assistant principal only, a head teacher only, or no head position, in which case a teacher-in-charge or officer-in-charge runs the school.
These are positions that schools reported to DepEd, not plantilla items. EDCOM II counted schools without a principal item a year later and on a different basis; that count is discussed in EDCOM II Final Report: Guide for Aspiring School Heads. The two measures differ, but both show that a large share of public schools, most of them small, have no principal.
In this comparison, 15,440 schools reported a School Principal position. The 22,138 schools without one are of three kinds: 11,535 led by a head teacher only, 10,594 with no head position, and 9 with an assistant principal but no principal. The main analysis pools all three as “without a principal”. One sensitivity analysis keeps only the schools with no head position.
The 37,578 schools are the public schools with CRLA results, a personnel record and complete SY 2023-24 school inputs. A school drops out if any input is missing, the same rule as in School Resources and CRLA Reading Results, so the comparison covers fewer schools than the personnel file.
CRLA results in schools with and without a principal: the raw gap
The outcome is the share of a school’s assessed learners who are struggling readers, meaning learners at the Low Emerging or High Emerging level. Each learner is counted once: Grade 1 in the Mother Tongue, Grade 2 in Filipino and Grade 3 in English. The figures are averages of school shares, so a small school counts as much as a large one.
Without any adjustment, schools with a principal had an average share of 9.2% struggling readers, and schools without one had 11.3%. The gap is -2.1 percentage points. Read alone, that figure suggests that schools with a principal do clearly better.
Why the raw gap misleads
Schools with and without a principal are different kinds of schools. Median elementary enrollment was 375 learners in schools with a principal and 137 in schools without one. Principal items have gone mainly to larger schools, so a school without a principal is usually small, more often multigrade and more often rural.
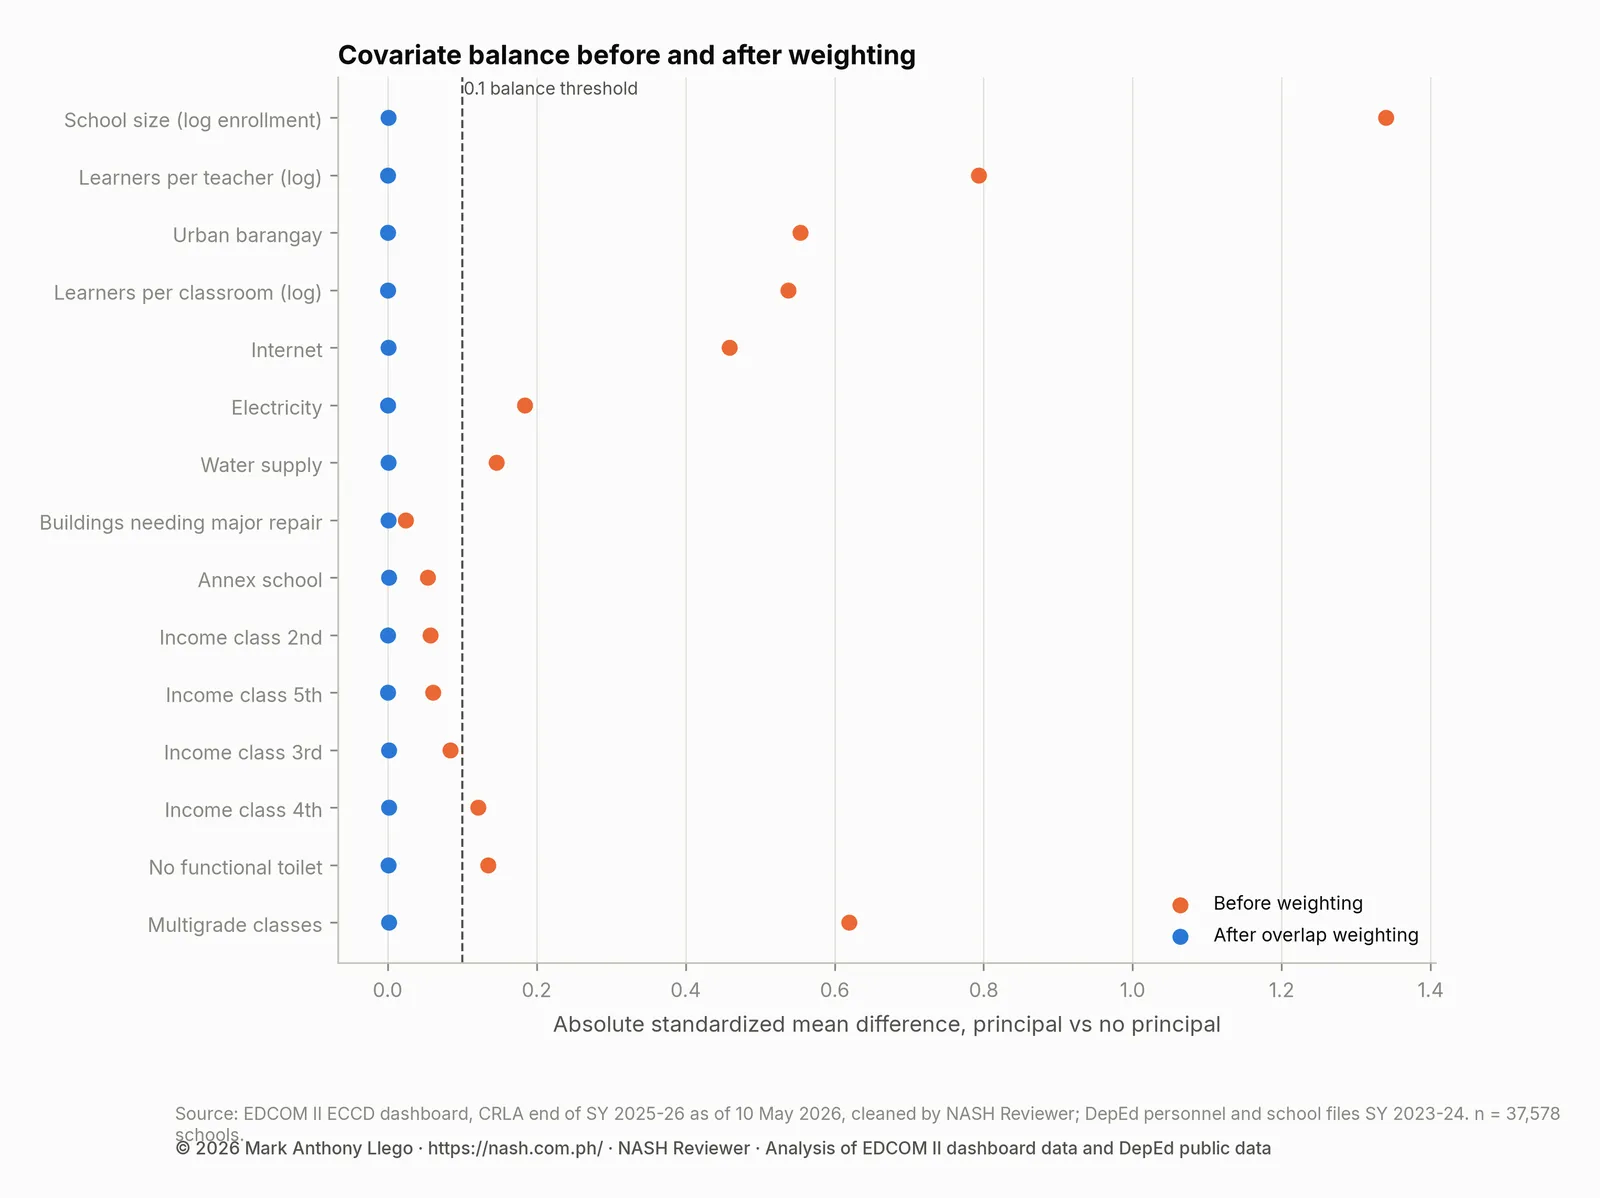
A standardized difference measures how far apart two groups are on a feature: the gap between the two group averages, divided by the spread of that feature. A value below 0.1 is the usual sign that two groups are alike on it. Before any adjustment, the largest standardized difference was 1.34, for school size. Learners per teacher, learners per classroom, multigrade classes, urban location and internet access also differed by far more than 0.1.
Each of these features can go with reading results in its own right. A raw comparison mixes the principal with all of them, so it cannot say how much of the gap goes with the principal position and how much with the kind of school that tends to have one.
Comparing like with like: propensity scores and overlap weights
The analysis takes two steps. The first is a propensity score: for every school, a statistical model estimates the chance that a school of its size, inputs, location and division has a School Principal. The inputs are learners per teacher and per classroom, buildings needing major repair, electricity, internet, water, functional toilets, multigrade classes and annex status. Location is the urban or rural barangay, the municipal income class and the school division. Groups of schools with similar scores look alike on these features on average, whether or not they have a principal.
The second step is overlap weighting. Each school with a principal is weighted by its chance of not having one, and each school without a principal by its chance of having one. A large city school that almost certainly has a principal gets almost no weight, and so does a tiny multigrade school that almost certainly does not. Most of the weight goes to schools in the middle: schools that could plausibly have either kind of head.
The propensity scores ran from 0.000 to 1.000, so schools at both extremes exist, and overlap weights keep them from driving the result. The price is that the result describes the schools in the middle. It answers the question of whether, among schools that could go either way, the ones with a principal have different CRLA results. It does not describe the smallest schools, where almost none has a principal, or the largest, where almost all do.
Checking balance after weighting
Weighting is useful only if the weighted groups end up alike. After overlap weighting, the largest standardized difference across all the school features was 0.002, far below the 0.1 threshold. Near-exact balance on averages is a built-in property of overlap weights with this kind of model. It balances averages, not every detail of each feature, and it says nothing about features that were not measured.
The table shows each feature’s standardized difference before and after weighting. Positive values mean the feature was higher in schools with a principal.
| Covariate | Standardized difference before | After overlap weighting |
|---|---|---|
| School size (log enrollment) | 1.34 | 0.001 |
| Learners per teacher (log) | 0.79 | 0 |
| Learners per classroom (log) | 0.54 | 0 |
| Buildings needing major repair | 0.02 | 0.001 |
| Electricity | 0.18 | -0 |
| Internet | 0.46 | 0.001 |
| Water supply | 0.15 | -0.001 |
| No functional toilet | -0.13 | 0.001 |
| Multigrade classes | -0.62 | -0.001 |
| Annex school | -0.05 | -0.001 |
| Urban barangay | 0.55 | 0 |
| Income class 2nd | -0.06 | 0 |
| Income class 3rd | -0.08 | -0.002 |
| Income class 4th | -0.12 | -0.001 |
| Income class 5th | -0.06 | 0 |
The adjusted difference in struggling readers is modest
After weighting, schools with a principal had an average share of 9.7% struggling readers, and comparable schools without one had 10.9%. The difference is -1.2 percentage points, with a 95% interval of -1.6 to -0.8. The risk ratio, which compares the two shares as a ratio rather than a difference, is 0.89.
The interval comes from a bootstrap with 500 replicates. Each replicate draws divisions at random, with replacement, refits the propensity model and recomputes the weighted difference. Resampling whole divisions rather than single schools respects the fact that schools in a division share supervisors, programs and testing arrangements. That usually gives a wider interval than treating every school as independent, and a more honest one.
The adjusted gap, -1.2 points, is smaller than the raw gap of -2.1. Part of what looked like a principal gap was a gap in school size, inputs and location. What remains is consistent across the checks below and its interval excludes zero, but it is modest. Both groups of comparable schools have shares of struggling readers in the same range, and the gap between them is small next to the shares themselves.
Sensitivity analyses
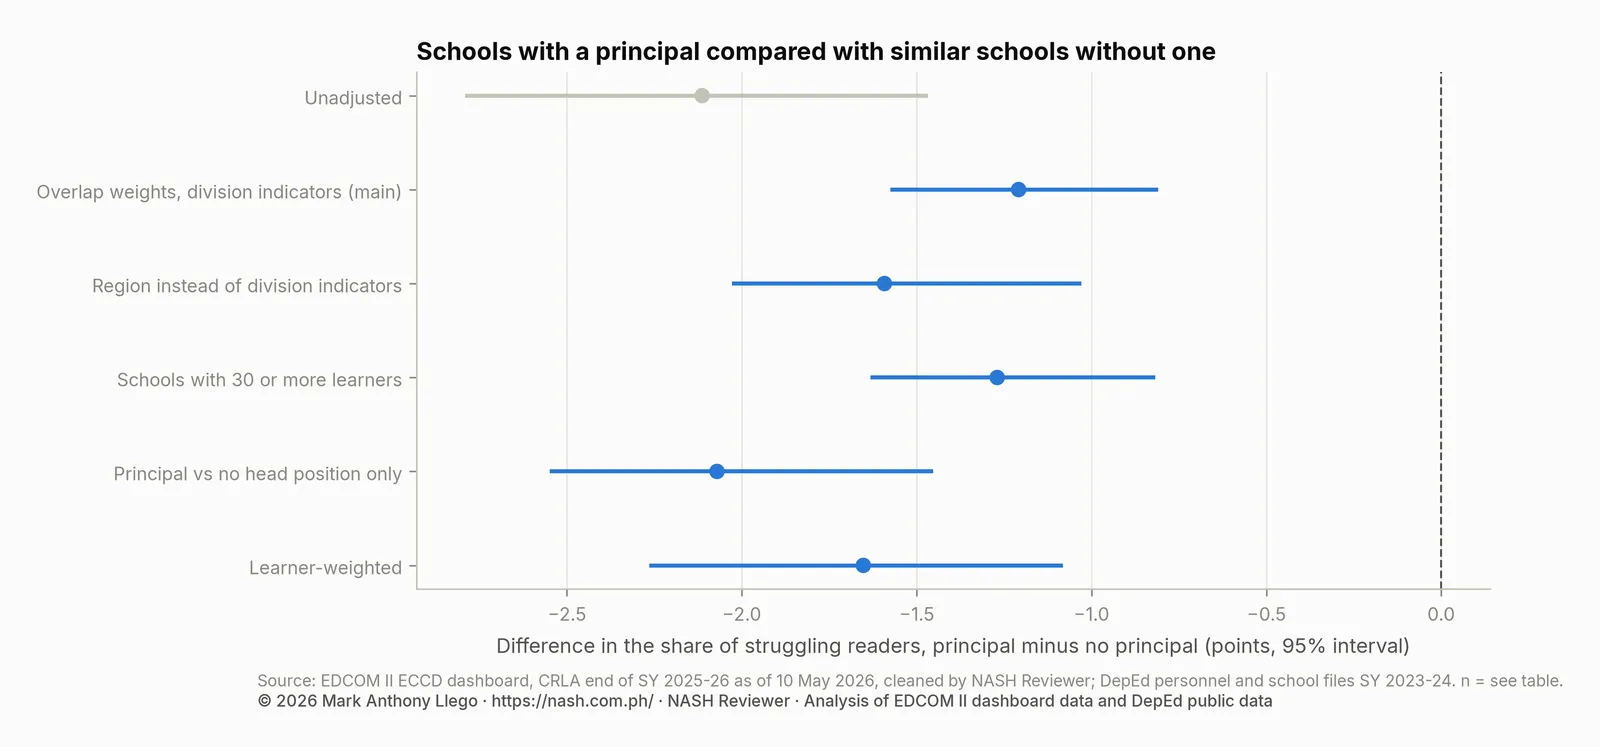
Four sensitivity analyses each change one choice. Using region instead of division in the propensity model gives -1.6 points (-2.0 to -1.0). Keeping only schools with 30 or more learners assessed, where a school’s share is less noisy, gives -1.3 (-1.6 to -0.8). Comparing schools with a principal with only those schools that have no head position gives -2.1 (-2.5 to -1.5). Weighting each school by its number of assessed learners, so that the result describes learners rather than schools, gives -1.7 (-2.3 to -1.1).
Schools with a principal had fewer struggling readers in 5 of 5 weighted estimates, and the 95% interval excluded zero in 5 of 5. The comparison with schools that have no head position gives the largest gap. This is consistent with schools led by a head teacher sitting closer to schools with a principal than schools with no head position do. But the intervals of the two estimates overlap, the two comparisons weight somewhat different sets of schools, and this analysis did not compare head-teacher schools with schools that have no head position directly.
The table lists every estimate, including the unadjusted one.
| Comparison | Schools | Struggling, with principal | Struggling, without | Difference (points, 95% interval) | Risk ratio |
|---|---|---|---|---|---|
| Unadjusted | 37,578 | 9.2% | 11.3% | -2.1 (-2.8 to -1.5) | 0.81 |
| Overlap weights, division indicators (main) | 37,578 | 9.7% | 10.9% | -1.2 (-1.6 to -0.8) | 0.89 |
| Region instead of division indicators | 37,578 | 9.6% | 11.2% | -1.6 (-2.0 to -1.0) | 0.86 |
| Schools with 30 or more learners | 31,655 | 9.8% | 11.1% | -1.3 (-1.6 to -0.8) | 0.89 |
| Principal vs no head position only | 26,034 | 10.2% | 12.2% | -2.1 (-2.5 to -1.5) | 0.83 |
| Learner-weighted | 37,578 | 10.3% | 11.9% | -1.7 (-2.3 to -1.1) | 0.86 |
How strong would a hidden factor have to be?
Weighting balances only what was measured. The E-value asks how strong an unmeasured factor would have to be to explain the difference away. It is stated as a risk ratio. To explain away the main estimate, the factor would have to be linked both to having a principal and to the share of struggling readers by a risk ratio of at least 1.50 each, over and above everything already in the model. To move the interval limit nearer zero all the way to zero, a factor linked to both by 1.38 would be enough.
These are moderate bars, not high ones. Teacher quality, the experience of the Grade 1 to 3 teachers, parents’ education and household poverty are not in the model, and some of them could be linked to both a principal and reading results that strongly. The E-value does not rule out such factors. It shows how strong they would need to be.
What the comparison assumes
The weighted difference is the gap between schools that are alike on the measured features. Reading it as the difference that having a principal itself makes would require four assumptions. None of them can be fully checked with these files, so the result stands as an association.
No important unmeasured differences. After weighting, the two groups must not differ in anything else that matters for reading. The model includes size, inputs, location and division. It does not include teacher quality, teacher turnover, parent involvement, poverty below the municipal level, or how each school administered the CRLA. If schools with a principal also tend to have stronger teachers or more supportive communities, part of the difference belongs to those.
Overlap. Comparable schools must exist on both sides. Overlap weights handle schools with no real counterpart by giving them little weight, which is why the result describes the middle of the size and resource range rather than every school.
Timing. The personnel file and school inputs are from SY 2023-24, and the CRLA results are from the end of SY 2025-26, two school years later. In between, some schools will have gained a principal, others lost one, and heads may have changed. A school counted as without a principal may have had one by the time its learners were assessed. If such changes are unrelated to reading results, they tend to shrink a difference toward zero.
What “a principal” stands for. A School Principal position is a bundle. It usually means a dedicated leader whose job is to run the school, rather than a teacher-in-charge who also carries a class. It also means a school large enough to qualify for an item under DepEd’s staffing rules, and often the resources and attention that come with being a larger, established school. The comparison cannot separate these parts. It shows that schools with a principal had somewhat fewer struggling readers than similar schools without one. It does not show which part of the bundle goes with the difference, or that adding a principal would change a school’s results.
What this means for school heads
- Read the raw gap with care. Comparing schools with and without a principal directly overstates the difference, because the two groups differ in size, inputs and location. The same applies to any comparison of schools: compare like with like, as explained in How to Read a School’s CRLA Results Fairly.
- The position is not the practice. In comparable schools, the gap that went with having a principal was modest. The position is a starting point. What a school head does in Grade 1 to 3 classrooms, through instructional supervision, reading interventions and the use of CRLA results to group learners, is where leadership meets reading.
- Schools without a principal are not fated to fall behind. After weighting, schools led by a head teacher or a teacher-in-charge had shares of struggling readers only modestly above those of comparable schools with a principal, with the largest gap for schools with no head position. The difference describes averages across thousands of schools, not what any one school will do.
- For aspiring principals reading NASH Reviewer. The National Education Plan target discussed in EDCOM II Final Report: Guide for Aspiring School Heads is a principal item for every DepEd-managed school, so new items will go to schools that do not have one, many of them small and rural. The smallest of those schools are the ones this comparison says least about, because they carry little weight in it. The Philippine Professional Standards for School Heads (PPSSH) domain on teaching and learning is the part of the job that this kind of comparison touches, and it is worth preparing for as practice, not only as an exam topic.
How these numbers were made
- CRLA results: end of SY 2025-26, as of 10 May 2026, from the EDCOM II early-childhood (ECCD) dashboard, public schools only. Struggling readers are learners at Low Emerging or High Emerging, with each learner counted once (Grade 1 Mother Tongue, Grade 2 Filipino and Grade 3 English).
- School heads: the highest school-leadership position in DepEd’s SY 2023-24 personnel file. A school with a School Principal position is compared with schools with an assistant principal only, a head teacher only or no head position.
- School features: log enrollment, log learners per teacher and per classroom, buildings needing major repair, electricity, internet, water, no functional toilet, multigrade classes, annex status, urban barangay and municipal income class, all from DepEd’s SY 2023-24 files. Schools with any missing input are left out.
- Propensity score: a logistic regression of having a School Principal on those features and division indicators, with almost no penalty on the coefficients.
- Weights and balance: overlap weights (one minus the score for schools with a principal, the score for schools without), with balance checked by standardized mean differences against the 0.1 threshold.
- Estimate and interval: the weighted difference in the average school share of struggling readers, with a 95% interval from 500 replicates of a bootstrap that resamples divisions and refits the propensity model each time. The sensitivity analyses use 200 replicates each.
- E-value: computed on the risk-ratio scale for the main estimate and for the interval limit nearer zero.
Limits
The comparison is observational. Weighting makes the two groups alike on what was measured, and the E-value shows that a moderate unmeasured factor could still account for the difference. The result should be read as a description of how CRLA results differ between similar schools, not as an estimate of what appointing a principal would do.
The head-position data are two school years older than the reading results, and they record reported positions rather than plantilla items or the person actually leading the school on the day of the CRLA. The comparison also says nothing about how long a principal had served, how the school was led day to day, or whether the principal also led other schools.
The CRLA is a classroom screen administered by teachers, and administration may differ between schools. If schools with and without a principal administered or recorded it differently, that difference would appear in this comparison too. Finally, schools with missing inputs are left out, and the result describes mainly mid-sized schools that could plausibly have either kind of head, not the smallest or the largest.
Frequently asked questions
Do schools with a principal have better CRLA results?
Somewhat. After weighting for size, inputs, location and division, schools with a School Principal position had an average share of 9.7% struggling readers, against 10.9% in comparable schools without one. The difference is -1.2 percentage points (95% interval -1.6 to -0.8), which is modest. The raw gap is larger partly because schools with a principal tend to be bigger and more often urban.
How many public schools have no principal?
In this comparison, 22,138 of 37,578 public schools reported no School Principal position in SY 2023-24. Of these, 11,535 had a head teacher only and 10,594 had no head position. National counts for all public schools are in DepEd Principals and Head Teachers per School, SY 2023-2024.
Would appointing more principals reduce the number of struggling readers?
These data cannot answer that. They show that schools with a principal had modestly fewer struggling readers than similar schools without one, but a principal position comes with other differences, and unmeasured factors such as teacher quality could account for the gap. Answering the question would need data that follow schools before and after they gain a principal.
What are overlap weights in a school comparison?
Overlap weights give the most weight to schools that could plausibly have either kind of head, given their size, inputs and location. Schools that almost certainly have a principal, or almost certainly do not, get little weight. After weighting, the two groups have nearly the same averages on every feature that was measured, so their reading results can be compared more fairly. Features that were not measured can still differ.
What is an E-value in a school comparison?
An E-value says how strong an unmeasured factor would need to be to explain a difference away. In this comparison it is 1.50: the factor would have to be linked to both having a principal and the share of struggling readers by a risk ratio of at least that much each, beyond the measured features. That is a moderate bar, so the result should be read with caution.
Download the data
The cleaned EDCOM II dashboard data behind this series are free to download for personal study; to reuse them, email support@nash.com.ph for written permission first. How the EDCOM Dashboard Data Was Cleaned explains every table and cleaning rule. The files are at data.nash.com.ph: start with the README, then the school table with CRLA results and school inputs (Parquet), the school estimates (CSV), the division estimates (CSV) and the municipal table (CSV). The DepEd school files used for school inputs are described in Download Cleaned DepEd School Data.
Every file, with its rows, columns and checksum, is listed on the EDCOM II CRLA data page. To cite the data: Llego, M. A. (2026). EDCOM II early-childhood dashboard data, cleaned, version 1. NASH Reviewer. https://nash.com.ph/edcom-data
More in this series
- CRLA End-of-Year Results SY 2025-26: All 18 Regions
- CRLA Start vs End of SY 2025-26 in the Same Schools
- CRLA by Language: Mother Tongue, Filipino and English
- How to Read a School’s CRLA Results Fairly
- CRLA Variation: School, Division or Region?
- Where Struggling Readers Are Concentrated
- School Resources and CRLA Reading Results
- CRLA Results in Schools With and Without a Principal
- Action Research and Thesis Topics on Reading (CRLA)
- CRLA Reading Hotspots: A Map of Struggling Readers
- Stunting, Day Care Centers and Early Reading
- Literacy and Nutrition Programs Compared With Need
- CRLA Schools With No Struggling Readers: A Data Check
- How the EDCOM Dashboard Data Was Cleaned
- Regional reports: NCR, CAR, Region I, Region II, Region III, Region IV-A, MIMAROPA, Region V, Region VI, NIR, Region VII, Region VIII, Region IX, Region X, Region XI, Region XII, Caraga, BARMM
- Earlier reports: CRLA Results SY 2025-2026 (DepEd’s selected-school file), Do the Same DepEd Schools Lag on the ELLNA, NAT and CRLA?, DepEd School Inputs vs Test Results, EDCOM II Final Report: Guide for Aspiring School Heads, DepEd Data for Aspiring School Heads: Where to Start
Analysis and charts by Mark Anthony Llego for NASH Reviewer. Data: EDCOM II early-childhood dashboard and Department of Education public datasets. NASH Reviewer is not affiliated with EDCOM II or DepEd. Charts may be reused only with written permission from support@nash.com.ph.