The Comprehensive Rapid Literacy Assessment (CRLA) results for SY 2025-26 in the National Capital Region (NCR) show the lowest share of struggling readers of any region. Of the 469,125 Grade 1–3 learners assessed in NCR’s public schools, 24,884 (5.3%) were struggling readers, at Low Emerging or High Emerging, at the end of the year, against 10.0% nationally. At grade level, NCR stands at 55.5%, against 47.6% for the country.
What sets NCR apart is the size of its schools. Only 520 schools with results assessed all those learners, so a low share still adds up to many children: NCR holds 4.9% of the country’s struggling readers. 3 of its 16 schools divisions fall below the national funnel limits, and more NCR schools report no struggling reader than a model expects: reasons to check records, not to praise or blame.
Key findings
- 5.3% of NCR’s 469,125 assessed learners are struggling readers, against 10.0% nationally, the lowest share of the 18 regions; 55.5% read at grade level.
- NCR is above the national share at grade level in every grade-and-language block, most of all in Grade 3 English (+9.2 points); the smallest margin is in Grade 1 Mother Tongue (+5.8 points).
- Division shares run from 0.1% to 9.8%, and City of San Juan, Pasay City, Caloocan City lie below the national funnel limits; City of San Juan has the lowest estimate of all 232 divisions, 0.2% (95% interval 0.1% to 0.4%).
- 74 NCR schools report no struggling reader, against 44 expected by a model that lets schools differ, a ratio of 1.68.
- Few NCR children aged 0–2 are stunted (1.5%, against 4.3% nationally), but 44.0% of its barangays have no child development center, against 10.9%.
- The median NCR school had 54.2 learners per classroom in SY 2023-24, against 25.8 nationally, and within divisions, schools with more learners per teacher had more struggling readers.
- Nearly every NCR school has a principal: 92.5% report a School Principal position, against 40.7% nationally.
Reading levels by grade and language in NCR
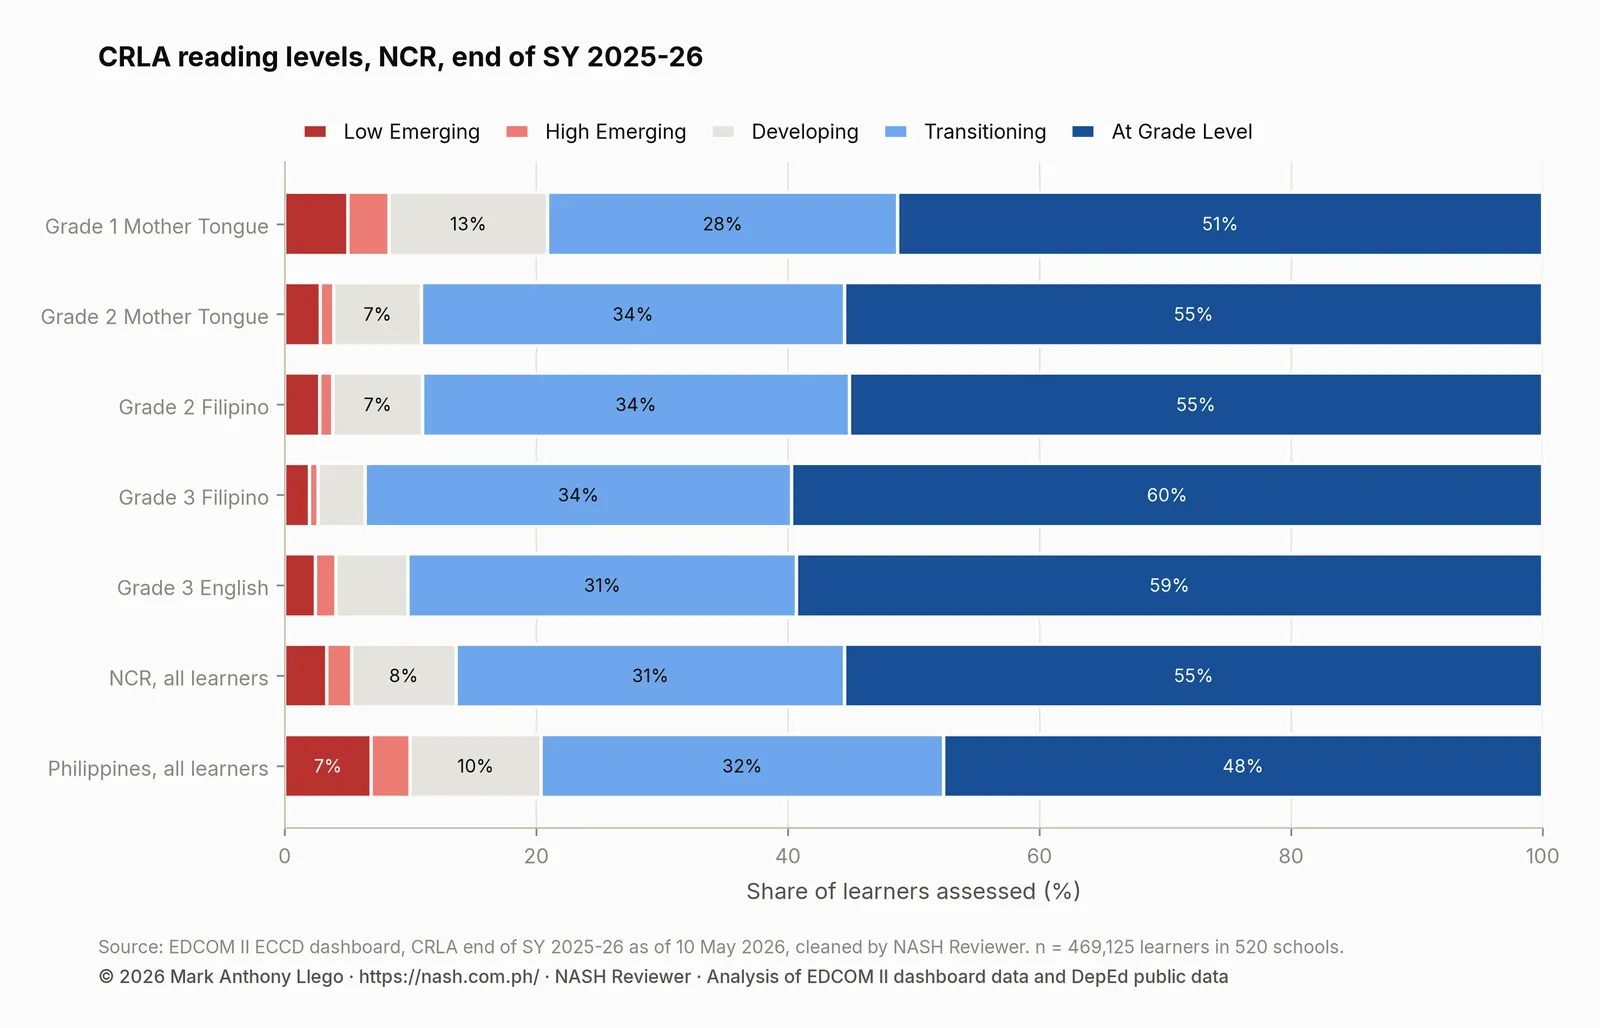
The table shows NCR’s share at each of the five CRLA levels in the five grade-and-language blocks, next to the Philippines.
| Grade and language | Learners | Low Emerging | High Emerging | Developing | Transitioning | At Grade Level | Struggling |
|---|---|---|---|---|---|---|---|
| Grade 1 Mother Tongue | 145,492 | 5.0% | 3.3% | 12.6% | 27.8% | 51.3% | 8.3% |
| Grade 2 Mother Tongue | 144,063 | 2.8% | 1.0% | 7.0% | 33.6% | 55.5% | 3.9% |
| Grade 2 Filipino | 149,807 | 2.8% | 1.0% | 7.1% | 33.9% | 55.1% | 3.8% |
| Grade 3 Filipino | 170,524 | 2.0% | 0.7% | 3.8% | 33.9% | 59.7% | 2.7% |
| Grade 3 English | 173,826 | 2.4% | 1.7% | 5.7% | 30.9% | 59.3% | 4.1% |
| NCR, all learners | 469,125 | 3.3% | 2.0% | 8.3% | 30.9% | 55.5% | 5.3% |
| Philippines, all learners | 5,127,670 | 6.9% | 3.1% | 10.4% | 32.0% | 47.6% | 10.0% |
NCR is ahead of the national share at grade level in all five blocks. The margin is widest in Grade 3 English, where 59.3% read at grade level against 50.1% nationally, a gap of +9.2 percentage points.
Grade 1 is where NCR’s struggling readers gather. In Grade 1 Mother Tongue, 51.3% read at grade level and 8.3% are struggling readers, the highest struggling share of any NCR block, with 5.0% at Low Emerging, the lowest level.
Schools divisions in NCR
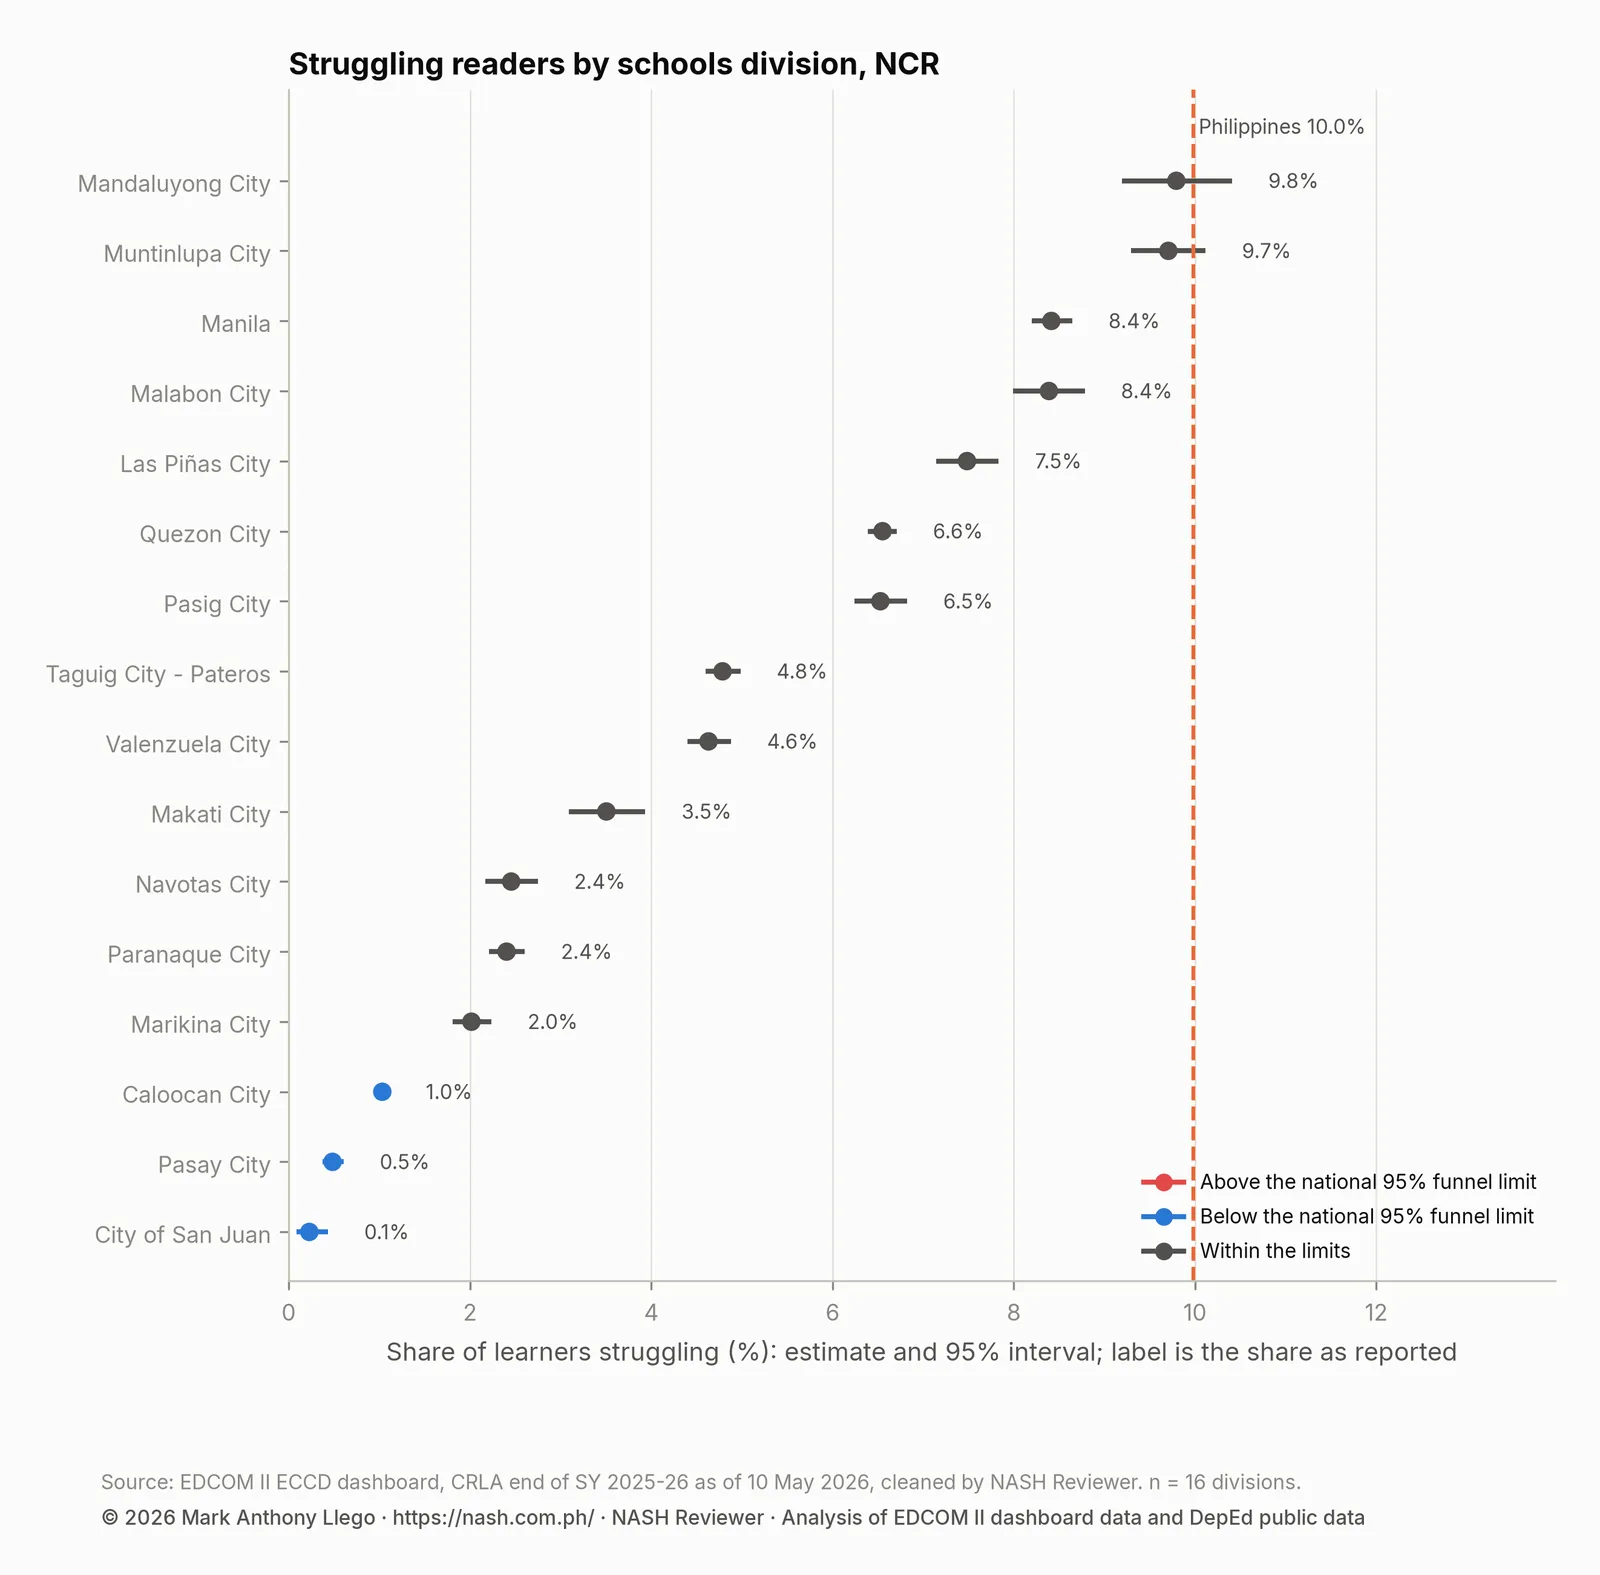
The table gives each of NCR’s 16 divisions with its schools, learners and struggling readers, an estimated share with its 95% interval, its rank among the 232 divisions, and its place on the national funnel plot.
| Division | Schools | Learners | Struggling readers | Share struggling | Estimate (95% interval) | National rank of 232 (95% interval) | National funnel |
|---|---|---|---|---|---|---|---|
| Caloocan City | 53 | 65,928 | 678 | 1.0% | 1.0% (1.0%–1.1%) | 3 (3–3) | below 95% |
| City of San Juan | 9 | 2,906 | 4 | 0.1% | 0.2% (0.1%–0.4%) | 1 (1–1) | below 99.8% |
| Las Piñas City | 22 | 21,615 | 1,617 | 7.5% | 7.5% (7.1%–7.8%) | 79 (75–90) | within limits |
| Makati City | 15 | 7,411 | 258 | 3.5% | 3.5% (3.1%–3.9%) | 21 (17–27) | within limits |
| Malabon City | 28 | 18,341 | 1,538 | 8.4% | 8.4% (8.0%–8.8%) | 104 (93–118) | within limits |
| Mandaluyong City | 20 | 9,354 | 916 | 9.8% | 9.8% (9.2%–10.4%) | 144 (129–153) | within limits |
| Manila | 74 | 60,352 | 5,078 | 8.4% | 8.4% (8.2%–8.6%) | 105 (99–114) | within limits |
| Marikina City | 17 | 16,625 | 333 | 2.0% | 2.0% (1.8%–2.2%) | 6 (4–8) | within limits |
| Muntinlupa City | 19 | 19,463 | 1,889 | 9.7% | 9.7% (9.3%–10.1%) | 140 (132–149) | within limits |
| Navotas City | 15 | 10,959 | 267 | 2.4% | 2.5% (2.2%–2.7%) | 10 (7–14) | within limits |
| Paranaque City | 26 | 22,637 | 542 | 2.4% | 2.4% (2.2%–2.6%) | 9 (7–13) | within limits |
| Pasay City | 19 | 13,354 | 62 | 0.5% | 0.5% (0.4%–0.6%) | 2 (2–2) | below 99.8% |
| Pasig City | 28 | 27,878 | 1,819 | 6.5% | 6.5% (6.2%–6.8%) | 62 (56–71) | within limits |
| Quezon City | 95 | 95,529 | 6,258 | 6.6% | 6.6% (6.4%–6.7%) | 64 (59–69) | within limits |
| Taguig City - Pateros | 39 | 46,431 | 2,221 | 4.8% | 4.8% (4.6%–5.0%) | 43 (38–45) | within limits |
| Valenzuela City | 41 | 30,342 | 1,404 | 4.6% | 4.6% (4.4%–4.9%) | 38 (35–43) | within limits |
The estimates use empirical Bayes, which pulls each share slightly toward the national rate, more for small divisions, so that chance swings are not read as real differences. The funnel plot draws limits around the national share that widen for smaller divisions; a division outside them is unusual for its size.
Shares run from 0.1% to 9.8%; even the highest, Mandaluyong City (9.8%), is just under the national share. Quezon City (6,258 struggling readers) leads the count as the largest division by learners. No division lies above the funnel, and City of San Juan, Pasay City, Caloocan City lie below it, City of San Juan and Pasay City beyond even the 99.8% limits.
Shares this close to zero need a data check before anyone treats them as results, especially in a division as large as Caloocan City, where chance alone rarely produces so low a share. CRLA Schools With No Struggling Readers: A Data Check explains the checks; NCR’s ratio of observed to expected zero schools, 1.68, is the highest of any region.
Languages of instruction
The language table has a single row for NCR: Tagalog (100% of schools).
| Language of instruction | Schools | Learners | Share struggling | At Grade Level |
|---|---|---|---|---|
| Tagalog | 519 | 468,864 | 5.3% | 55.5% |
Filipino is based on Tagalog, so the Grade 2 Mother Tongue and Grade 2 Filipino assessments are close to the same test here. The Grade 2 Filipino share at grade level minus the Mother Tongue share is +0.1 percentage points in NCR, against -0.8 nationally, where many learners have a mother tongue other than Tagalog. Near-identical Grade 2 results are expected in NCR, not a sign of copied records; CRLA by Language compares languages nationally.
Where struggling readers are concentrated in NCR
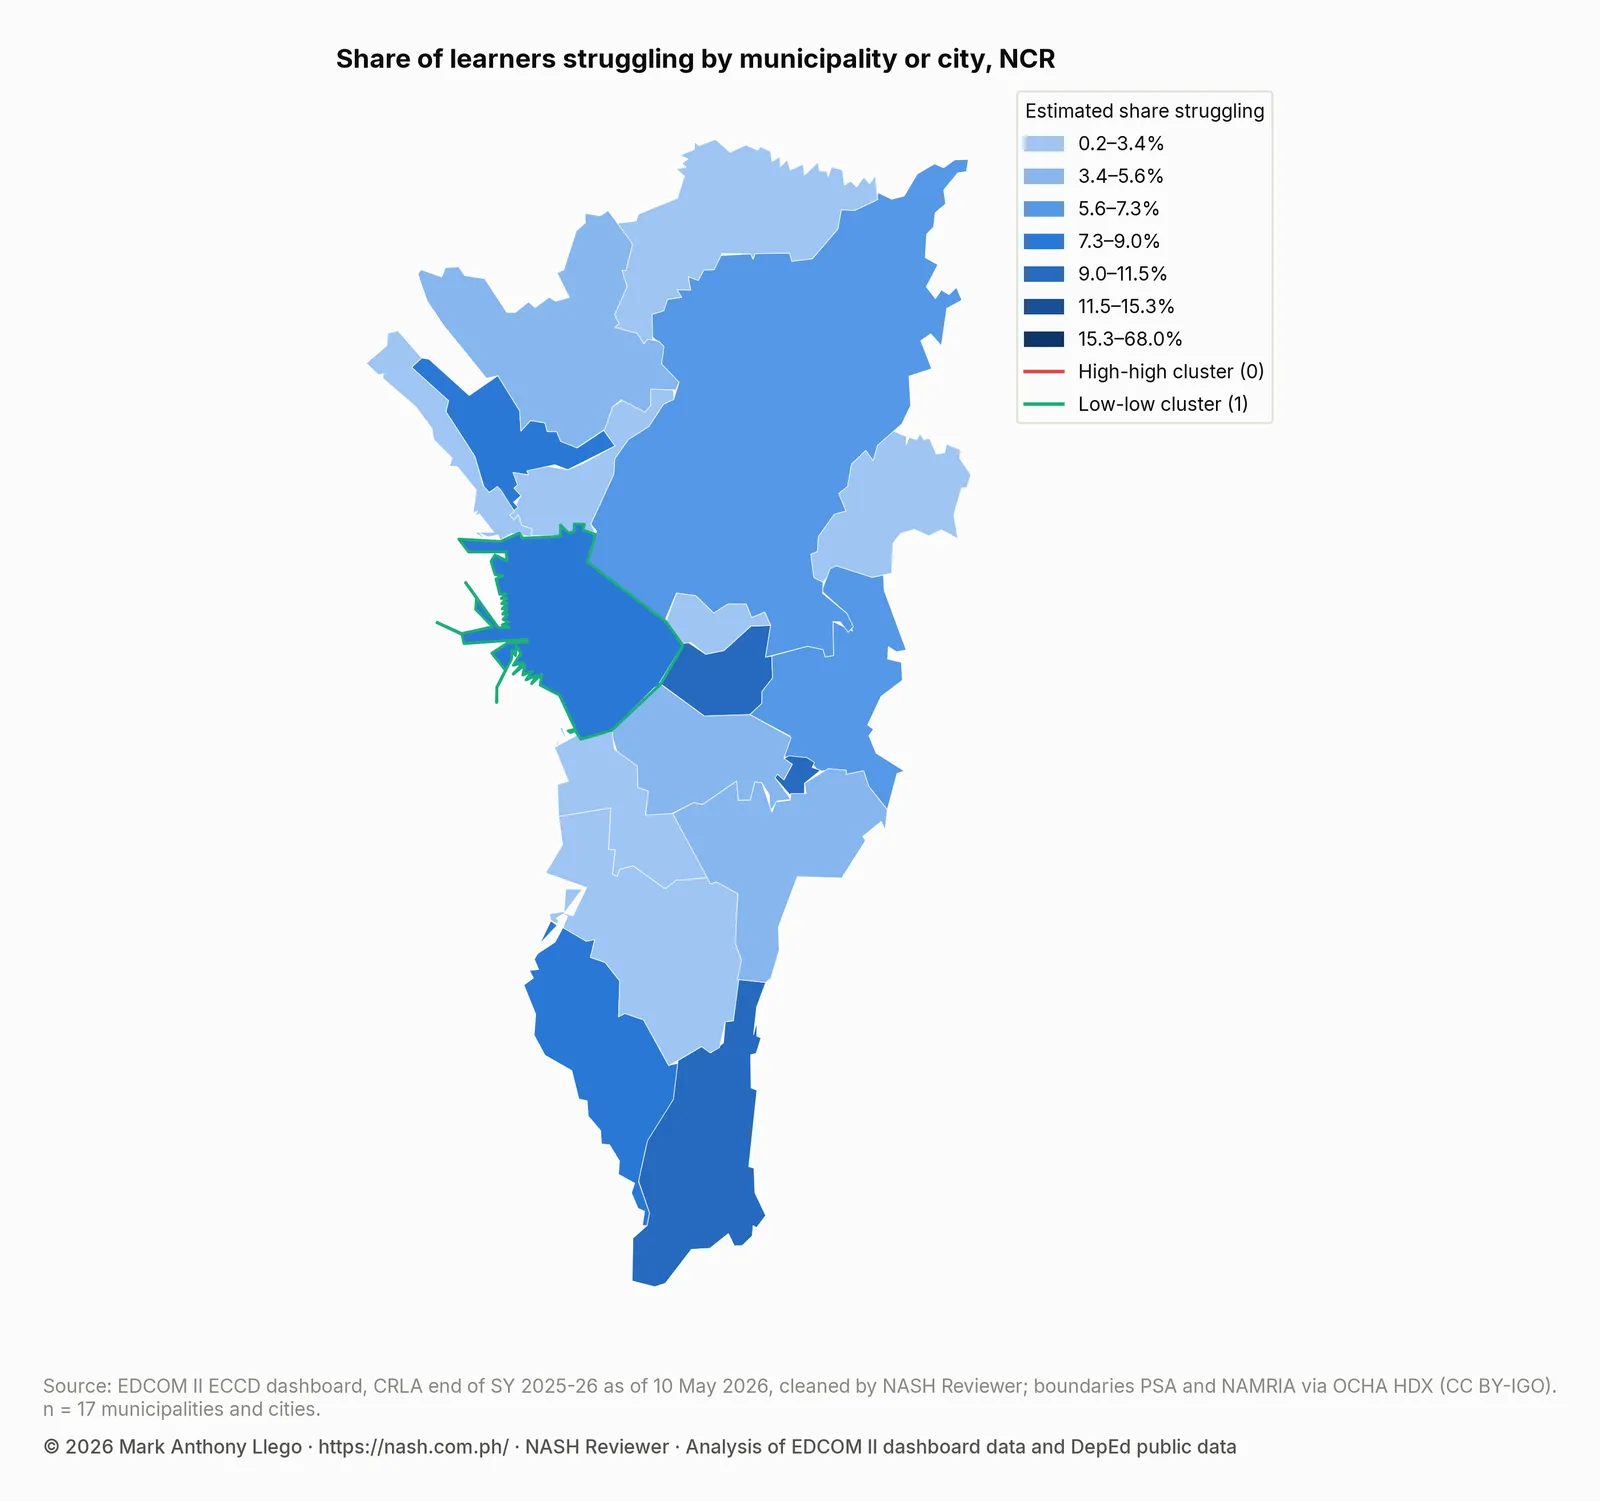
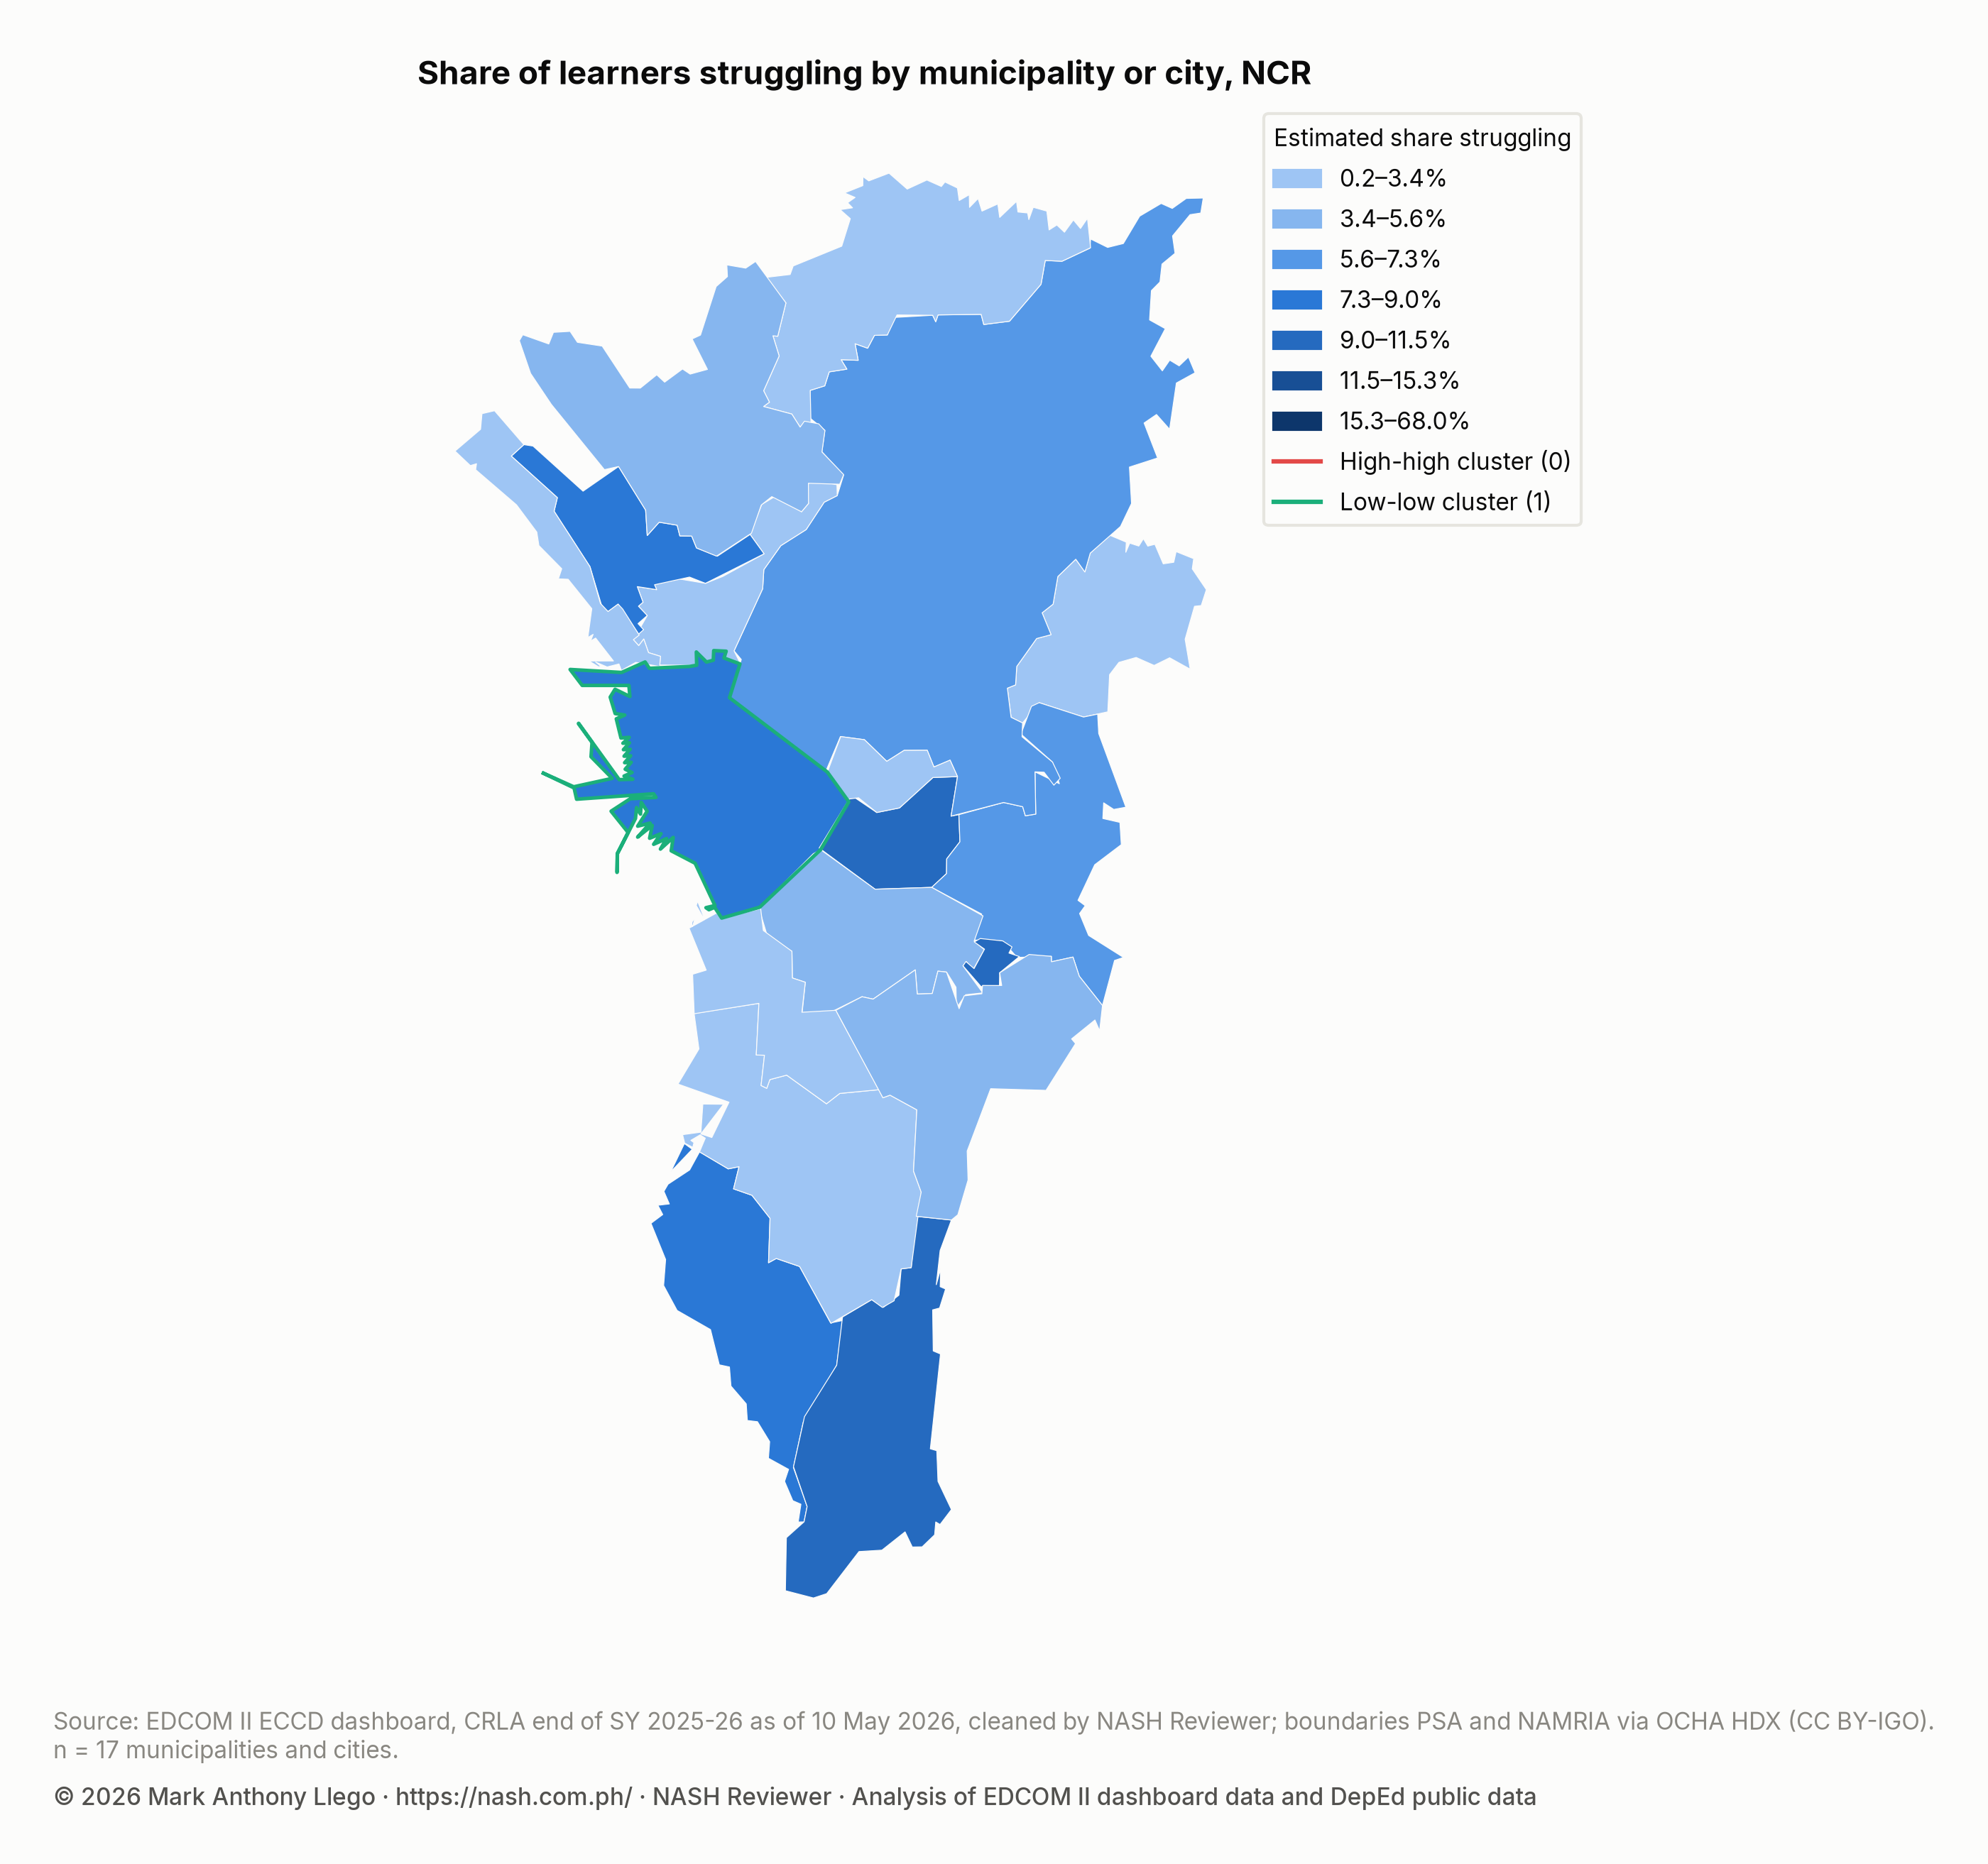
The figures here belong to cities as places, not to individual children. The map shades each NCR city and the municipality of Pateros (17 places in all) by its estimated share of struggling readers, on the national color scale.
Quezon City leads the count of struggling readers, ahead of the City of Manila: Quezon City, Metropolitan Manila Second District (6,258); City of Manila, Metropolitan Manila First District (5,057); Taguig City, Metropolitan Manila Fourth District (2,025); City of Muntinlupa, Metropolitan Manila Fourth District (1,889); City of Pasig, Metropolitan Manila Second District (1,819). Ranked by estimated share instead, the list is Pateros, Metropolitan Manila Fourth District (10.4%); City of Mandaluyong, Metropolitan Manila Second District (9.8%); City of Muntinlupa, Metropolitan Manila Fourth District (9.7%); City of Manila, Metropolitan Manila First District (8.5%); City of Malabon, Metropolitan Manila Third District (8.4%). Pateros heads that list although its division, Taguig City - Pateros, is lower overall.
A cluster test, local Moran’s I, asks whether a place and its neighbors together have unusually high or low shares. NCR has 0 high-high clusters and 1 low-low cluster, the City of Manila, where both its own share and its neighbors’ are below the national figure.
| Municipality or city | Province | Struggling readers | Learners | Estimated share struggling | Cluster |
|---|---|---|---|---|---|
| Quezon City | Metropolitan Manila Second District | 6,258 | 95,529 | 6.6% | No cluster |
| City of Manila | Metropolitan Manila First District | 5,057 | 59,832 | 8.5% | Low-low |
| Taguig City | Metropolitan Manila Fourth District | 2,025 | 44,556 | 4.5% | No cluster |
| City of Muntinlupa | Metropolitan Manila Fourth District | 1,889 | 19,463 | 9.7% | No cluster |
| City of Pasig | Metropolitan Manila Second District | 1,819 | 27,878 | 6.5% | No cluster |
Early childhood: stunting and day care centers
The dashboard also carries stunting among children aged 0–2 (Operation Timbang Plus 2025) and the DILG list of barangays without a child development center (CDC), the barangay day care center. Stunting is low among most of NCR’s toddlers: 1.5% of the 358,962 measured, against 4.3% nationally. The exception is the highest district, Metropolitan Manila First District (5.3%), which is the City of Manila on its own and the only district above the national share.
The day care gap runs the other way: 743 of 1,687 barangays (44.0%) have no CDC, against 10.9% nationally, and the First District, the City of Manila, has the most, as the table below shows.
| Province or highly urbanized city | Children 0–2 measured | Stunted | Barangays without a CDC | Learners struggling |
|---|---|---|---|---|
| Metropolitan Manila First District | 46,065 | 5.3% | 461 of 869 | 8.5% |
| Metropolitan Manila Fourth District | 89,528 | 1.2% | 144 of 317 | 5.0% |
| Metropolitan Manila Second District | 143,927 | 0.6% | 40 of 236 | 6.1% |
| Metropolitan Manila Third District | 79,442 | 1.1% | 98 of 265 | 3.1% |
These are different children: the toddlers measured in 2025 are not the Grade 1–3 learners assessed on the CRLA. The national post, Stunting, Day Care Centers and Early Reading, checks whether toddler stunting and early reading rise and fall together from one municipality to the next.
School resources
NCR’s school inputs date from DepEd’s SY 2023-24 files, two school years before this CRLA round. The table sets NCR’s median school (for ratios) or share of schools (for facilities) against the national figure.
| School input (SY 2023-24) | NCR | Philippines |
|---|---|---|
| Learners per teacher (elementary) | 30.7 | 22.8 |
| Learners per classroom (elementary) | 54.2 | 25.8 |
| Schools with internet | 98.6% | 76.3% |
| Schools with electricity | 98.1% | 97.6% |
| Schools with a water supply | 97.9% | 97.8% |
| Schools with no functional toilet | 0.6% | 2.3% |
| Schools with multigrade classes | 0.6% | 15.3% |
NCR’s schools are crowded rather than under-equipped. The median school had 30.7 learners per teacher and 54.2 per classroom, against 22.8 and 25.8 nationally, while internet reaches 98.6% of schools and multigrade classes are rare.
A model of NCR alone compared schools within the same division, so that differences between divisions do not drive the result, and widened its intervals because school results vary more than a simple binomial model allows. Its odds ratios read simply: above 1 means an input goes with more struggling readers, below 1 with fewer. For 2 inputs the 95% interval excludes 1, namely learners per teacher: odds ratio 1.61 (1.24–2.10); school size: odds ratio 0.70 (0.62–0.80); continuous inputs are per standard deviation.
Both match the national model: within a division, NCR schools with more learners per teacher had more struggling readers, and larger schools had fewer. Learners per classroom has an interval that includes 1 in NCR’s model, so within its divisions the data cannot separate crowded classrooms from no association. Almost every NCR school reports electricity, water and internet, and the few without them leave those intervals wide.
School heads
Principals are the norm in NCR. The SY 2023-24 personnel file shows the position in 92.5% of its schools, against 40.7% nationally, and no head position in 7.2%. Before adjustment, the struggling share is 5.3% under a principal and 5.3% without one. So few NCR schools lack a principal that the region cannot settle the question; CRLA Results in Schools With and Without a Principal makes the adjusted comparison.
Programs recorded in NCR
The EDCOM II dashboard lists programs run by NGOs and corporate foundations. NCR has 4 records on that list: Nutrition (2); Literacy (2) by category, and Growth Monitoring & Weighing (1); Literacy Tutoring Program (1); Supplementary Feeding (0-2yo) (1); Early Grade Reading Intervention (1) by type. NCR holds 4.0% of the listed programs and 4.9% of the country’s struggling readers, two close shares. The list holds what organizations reported, not a census; Literacy and Nutrition Programs Compared With Need sets every region side by side.
What this means for school heads in NCR
Count learners, not just shares. In a large school, a small share still means several classes’ worth of struggling readers, and a list of names by section plans better than a percentage.
Start with Grade 1. Grade 1 Mother Tongue is NCR’s weakest block, so reading time and remedial groups there reach the learners furthest behind.
Confirm a zero before reporting it. If your school shows almost no struggling readers, check that every enrolled learner was assessed and that levels were entered correctly.
How these numbers were made
NCR’s numbers come from the EDCOM II early-childhood (ECCD) dashboard: public school CRLA results at the end of SY 2025-26, as of 10 May 2026. The regional count takes each learner once, from Grade 1 Mother Tongue, Grade 2 Filipino and Grade 3 English, and treats Low Emerging and High Emerging as struggling. The school inputs and school-head categories are from DepEd’s SY 2023-24 files. The national report and How to Read a School’s CRLA Results Fairly give the methods.
Limits
Regional shares are close to a full count, so they carry no sampling intervals, but they are only as good as the records schools entered. School inputs are two school years older than the reading results, and the early-childhood measures describe younger children. None of the comparisons here shows cause and effect.
Frequently asked questions
Does NCR have the fewest struggling readers on the CRLA?
By share, yes. At the end of SY 2025-26, 5.3% of NCR’s assessed Grade 1–3 learners were struggling readers, against 10.0% nationally, the lowest share of the 18 regions, and 55.5% read at grade level.
Why does City of San Juan have so few struggling readers?
City of San Juan (0.1%) has the lowest share of all 232 divisions. It may be genuine, but a share this close to zero is first a reason to confirm that all learners were assessed and recorded correctly, not a verdict on the division.
How crowded are NCR classrooms compared with the whole country?
More crowded. In SY 2023-24, NCR’s median school counted 54.2 learners per classroom, against 25.8 across the Philippines. Within NCR’s divisions, schools with more learners per teacher had more struggling readers, while for learners per classroom the data cannot tell an association apart from none.
Download the data
The cleaned EDCOM II dashboard data behind this series are free to download for personal study; to reuse them, email support@nash.com.ph for written permission first. How the EDCOM Dashboard Data Was Cleaned explains every table and cleaning rule. The files are at data.nash.com.ph: start with the README, then the school table with CRLA results and school inputs (Parquet), the school estimates (CSV), the division estimates (CSV) and the municipal table (CSV). The DepEd school files used for school inputs are described in Download Cleaned DepEd School Data.
Every file, with its rows, columns and checksum, is listed on the EDCOM II CRLA data page. To cite the data: Llego, M. A. (2026). EDCOM II early-childhood dashboard data, cleaned, version 1. NASH Reviewer. https://nash.com.ph/edcom-data
More in this series
- CRLA End-of-Year Results SY 2025-26: All 18 Regions
- CRLA Start vs End of SY 2025-26 in the Same Schools
- CRLA by Language: Mother Tongue, Filipino and English
- How to Read a School’s CRLA Results Fairly
- CRLA Variation: School, Division or Region?
- Where Struggling Readers Are Concentrated
- School Resources and CRLA Reading Results
- CRLA Results in Schools With and Without a Principal
- Action Research and Thesis Topics on Reading (CRLA)
- CRLA Reading Hotspots: A Map of Struggling Readers
- Stunting, Day Care Centers and Early Reading
- Literacy and Nutrition Programs Compared With Need
- CRLA Schools With No Struggling Readers: A Data Check
- How the EDCOM Dashboard Data Was Cleaned
- Regional reports: NCR, CAR, Region I, Region II, Region III, Region IV-A, MIMAROPA, Region V, Region VI, NIR, Region VII, Region VIII, Region IX, Region X, Region XI, Region XII, Caraga, BARMM
- Earlier reports: CRLA Results SY 2025-2026 (DepEd’s selected-school file), Do the Same DepEd Schools Lag on the ELLNA, NAT and CRLA?, DepEd School Inputs vs Test Results, EDCOM II Final Report: Guide for Aspiring School Heads, DepEd Data for Aspiring School Heads: Where to Start
Analysis and charts by Mark Anthony Llego for NASH Reviewer. Data: EDCOM II early-childhood dashboard and Department of Education public datasets. NASH Reviewer is not affiliated with EDCOM II or DepEd. Charts may be reused only with written permission from support@nash.com.ph.