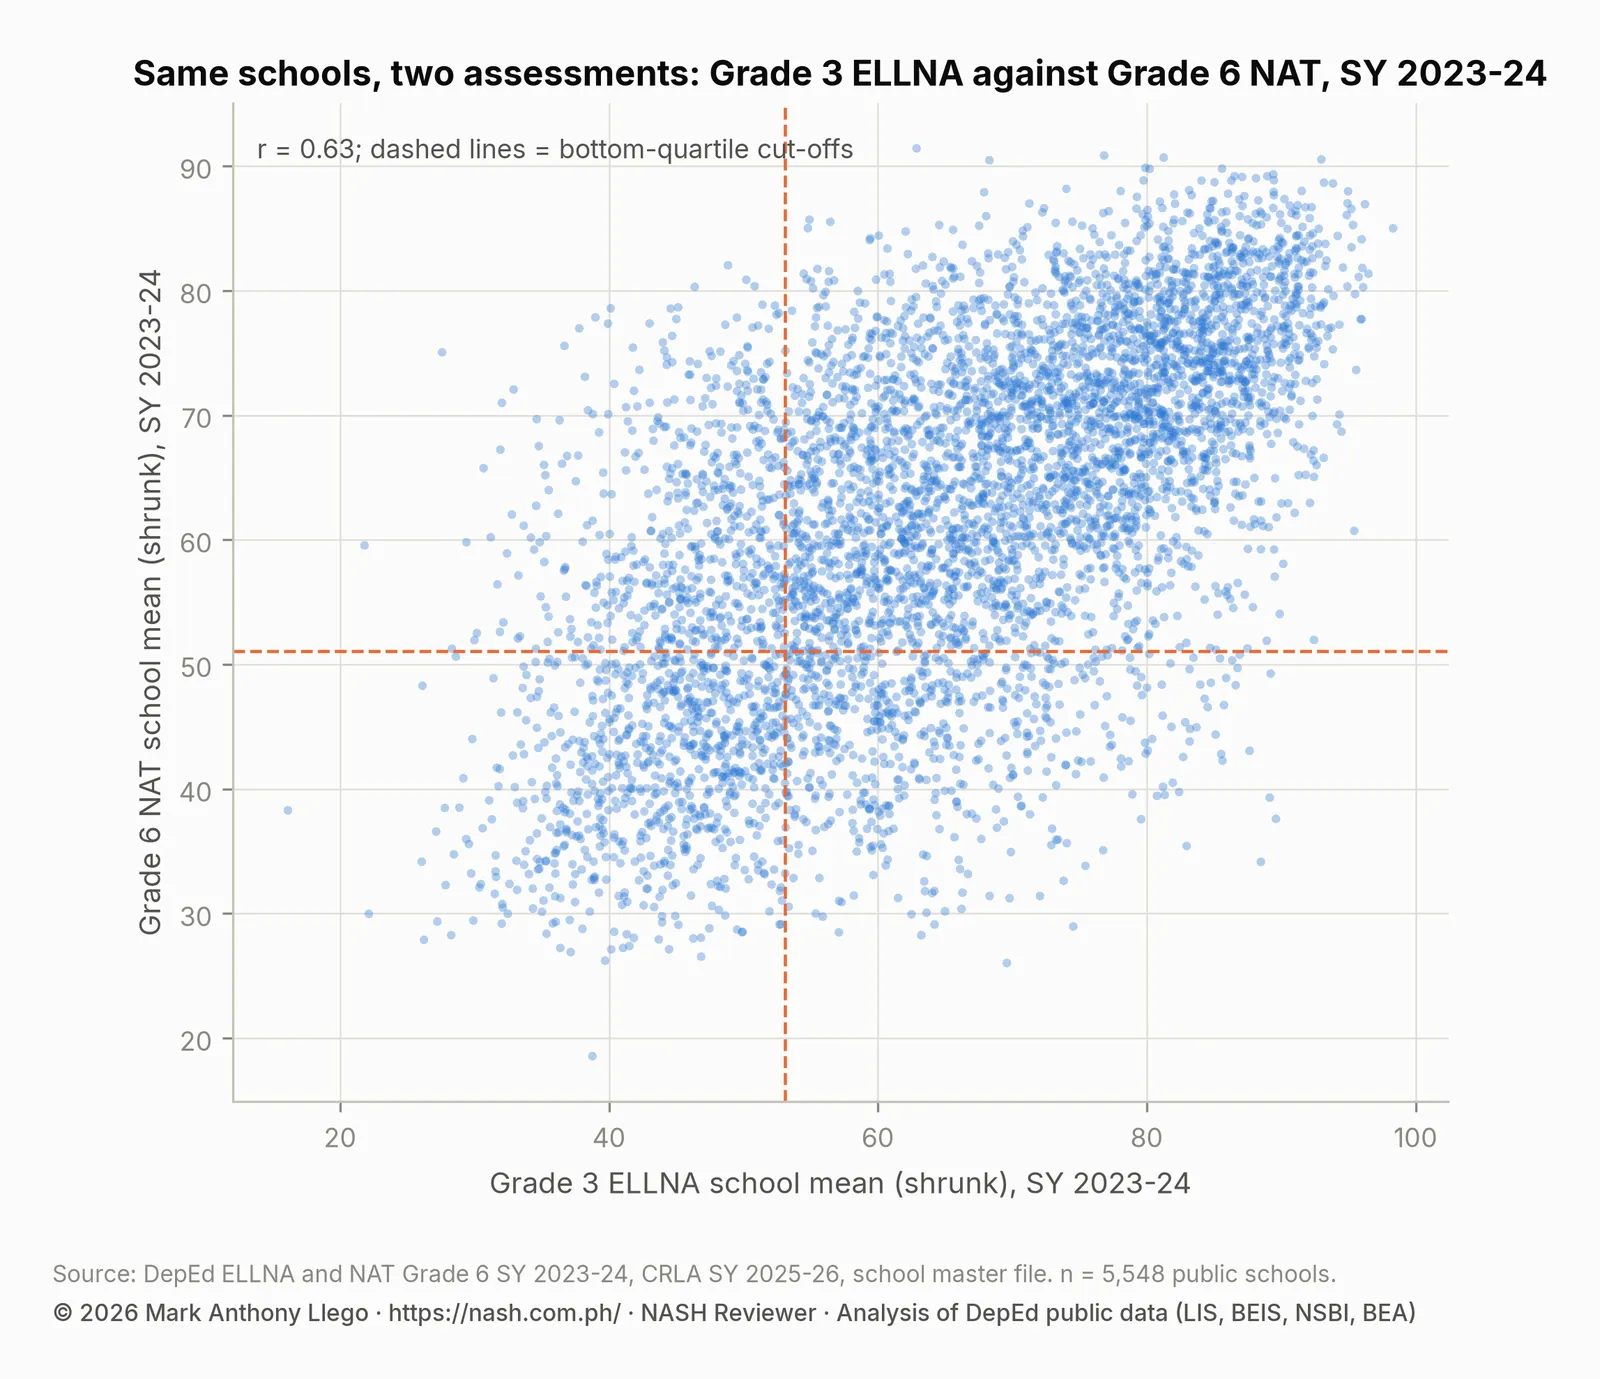
On the two SY 2023-2024 tests, the Grade 3 Early Language, Literacy and Numeracy Assessment (ELLNA) and the Grade 6 National Achievement Test (NAT), the same DepEd public schools lag: a bottom-quarter ELLNA school has a 56.5% chance of being bottom-quarter on the NAT. The Comprehensive Rapid Literacy Assessment (CRLA) of SY 2025-2026 barely agrees with either.
A division that wants to help its weakest schools needs to know whether weakness is a property of the school or of the year. If a school that scored low on one assessment scores low on the next, the division can target the school. If low scores scatter at random from one test to the next, there is nothing to target but noise. DepEd’s public files allow the question to be asked at school level for the first time. The same 5,548 public schools have a Grade 3 ELLNA mean and a Grade 6 NAT mean for SY 2023-2024. 5,518 of them also have a CRLA reading profile two years later, in SY 2025-2026.
The answer has two halves. Between the two standardized tests of SY 2023-2024, lagging is strongly persistent. A bottom-quarter ELLNA school has a 56.5% chance of being bottom-quarter on the NAT, against 14.5% for every other school. 14.1% of schools are in the bottom quarter on both, more than twice the 6.25% that chance would produce. Between either test and the CRLA two years later there is almost no persistence at all. That second half says as much about the CRLA as about the schools.
Key findings
- A school in the bottom quarter on the Grade 3 ELLNA has a 56.5% chance of being in the bottom quarter on the Grade 6 NAT, against 14.5% for every other school. The two school means correlate at 0.62.
- 14.1% of the 5,548 schools are in the bottom quarter on both SY 2023-2024 tests, more than twice the 6.25% expected by chance. Within divisions, 12.1% are.
- The CRLA of SY 2025-2026 barely agrees with either test. Its school-level share at grade level correlates at 0.08 with the ELLNA and with the NAT. 26.5% of bottom-quarter ELLNA schools are bottom-quarter on the CRLA, against 24.5% of other schools.
- Persistently low schools look like other schools on the recorded inputs. They are more likely to offer multigrade classes (24.1% against 14.0% of persistently high schools) and less likely to have internet (75.7% against 83.6%).
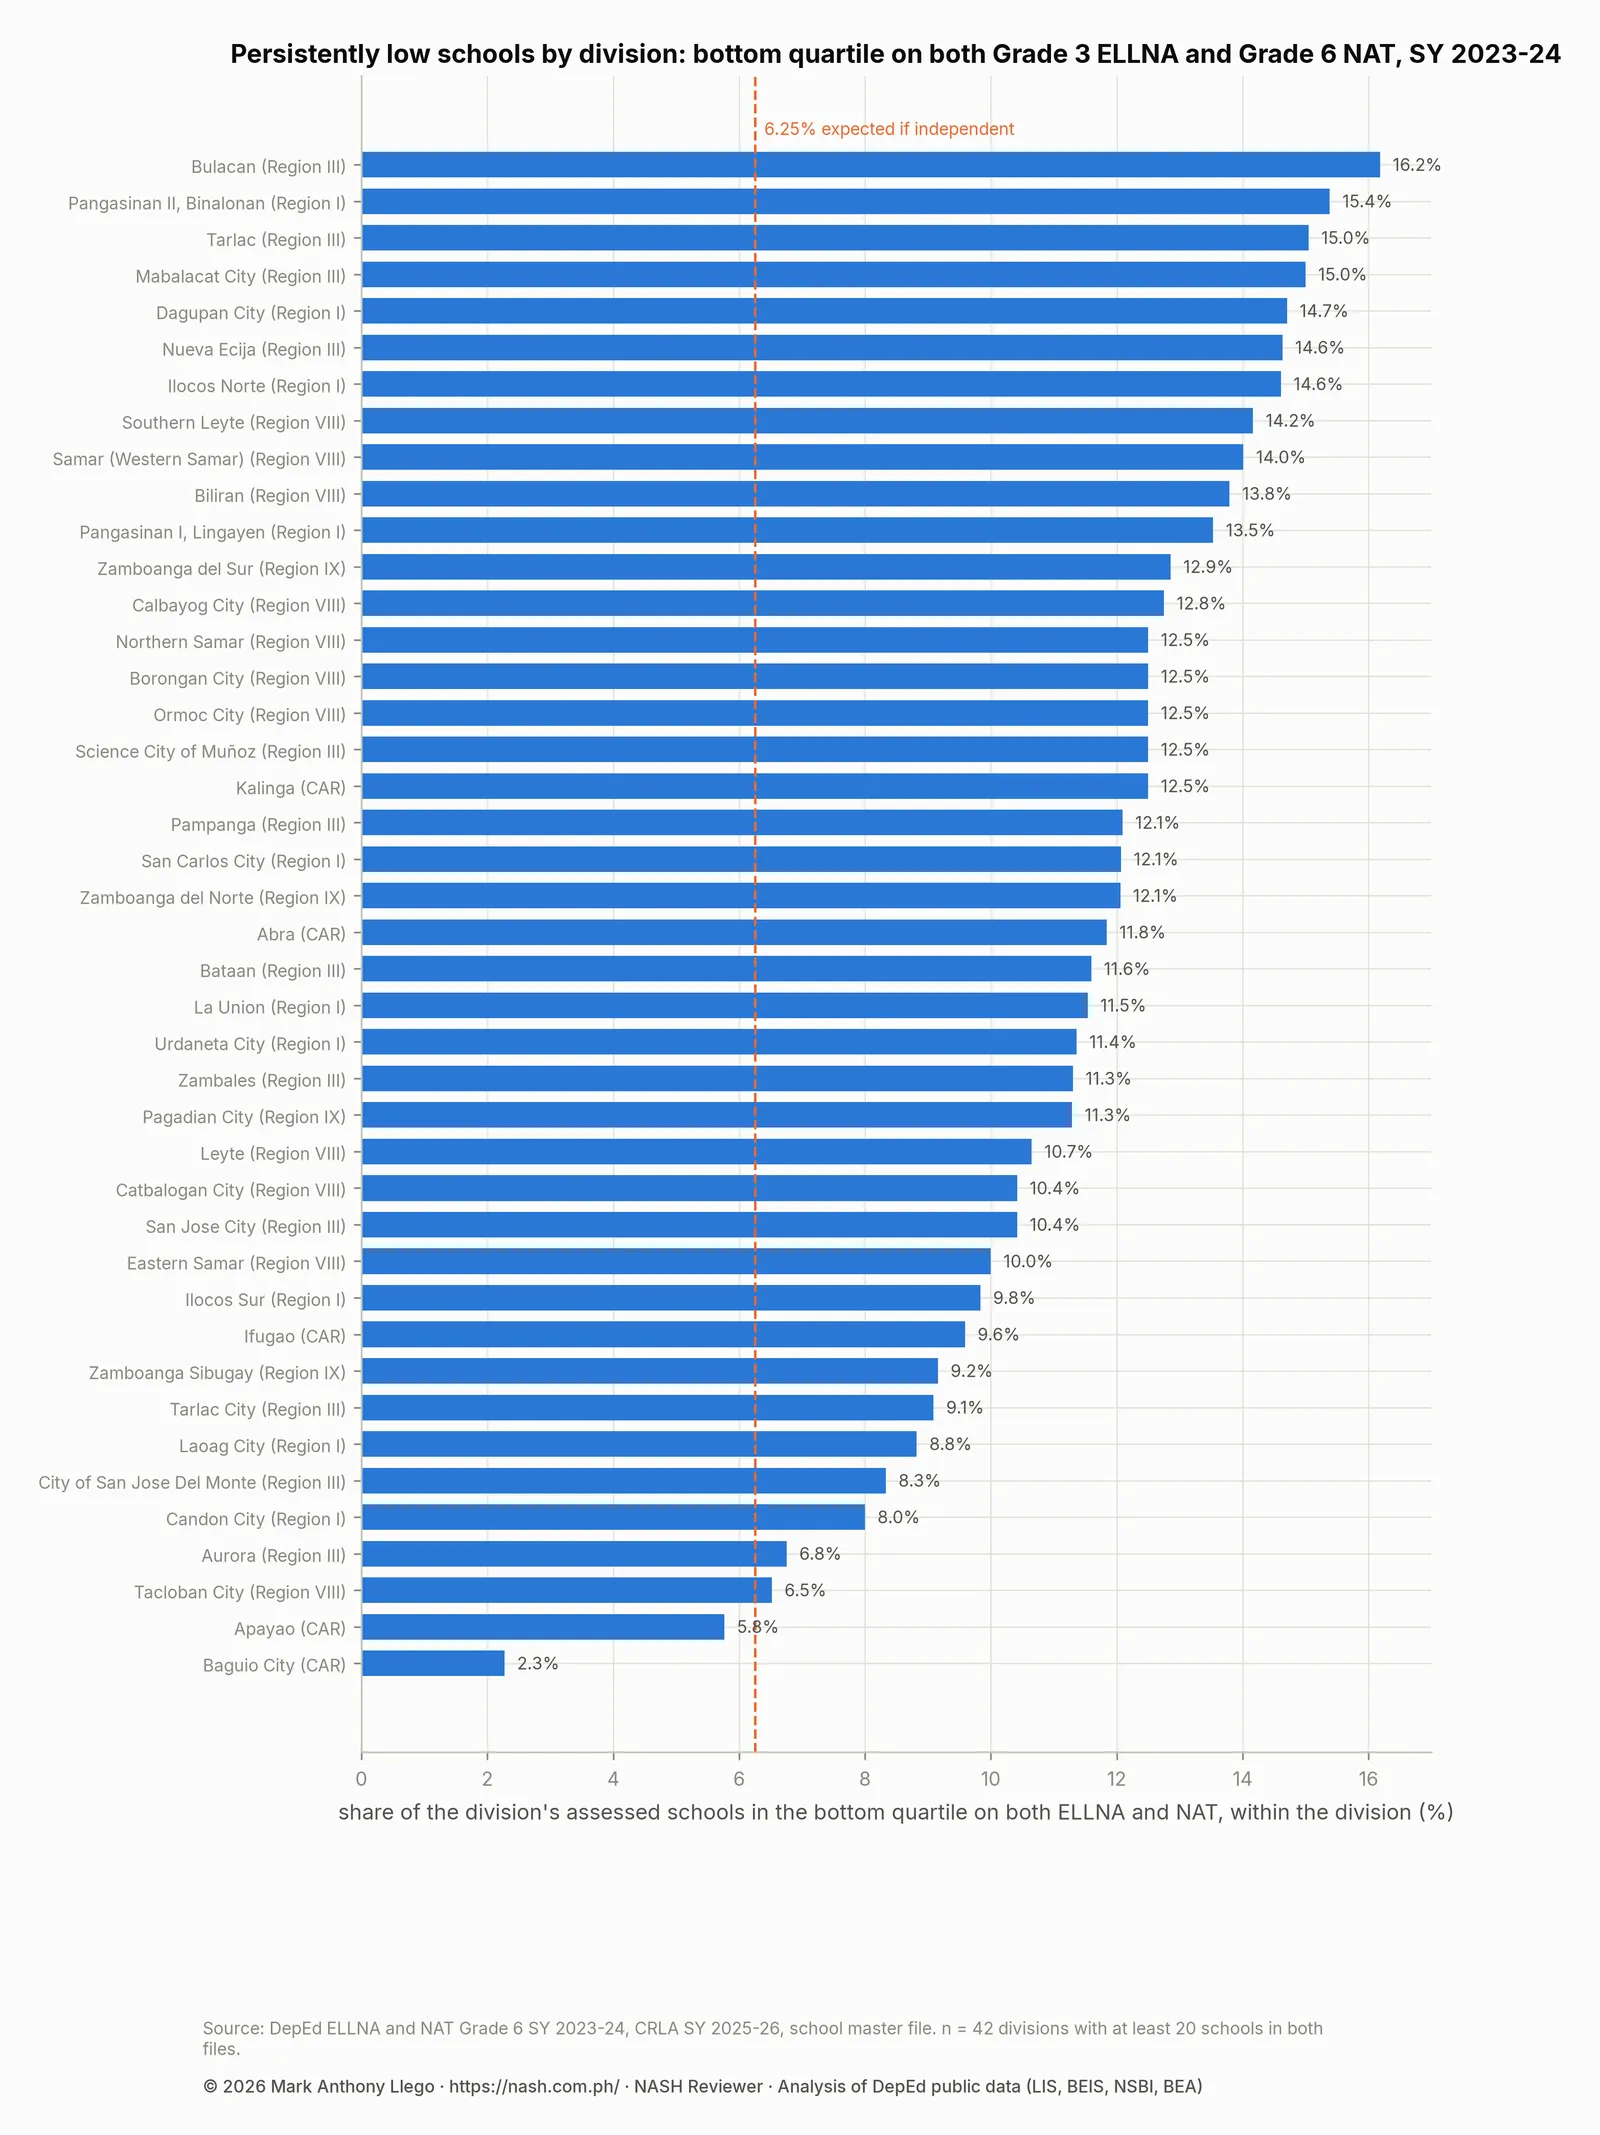
- Division shares of persistently low schools run from 2.3% in Baguio City to 16.2% in Bulacan.
The ELLNA, NAT and CRLA files cover the same schools
| Assessment set | Schools |
|---|---|
| ELLNA (Grade 3, SY 2023-24) | 5,752 |
| NAT (Grade 6, SY 2023-24) | 5,822 |
| CRLA (Grades 1 to 3, SY 2025-26) | 6,090 |
| ELLNA and NAT | 5,548 |
| ELLNA and CRLA | 5,721 |
| NAT and CRLA | 5,791 |
| All three | 5,518 |
The ELLNA, NAT and CRLA files cover the same selected set of schools in five regions (CAR, Regions I, III, VIII and IX) and 44 divisions. The overlaps are large. 5,548 public schools are in both SY 2023-2024 files, and 5,518 are in all three; the table gives the other pairs. Each school’s ELLNA and NAT means are for different children, the Grade 3 and Grade 6 classes of the same year. Its CRLA profile is for the Grade 1 to 3 learners of two years later. What stays constant is the school.
ELLNA and NAT: the same schools lag
| Pair | Schools | Pearson r (raw school means) | Spearman rank | Pearson r (shrunk means) | Within-division r |
|---|---|---|---|---|---|
| ELLNA and NAT | 5,548 | 0.62 | 0.62 | 0.63 | 0.48 |
| ELLNA and CRLA | 5,721 | 0.08 | 0.06 | 0.08 | 0.07 |
| NAT and CRLA | 5,791 | 0.08 | 0.08 | 0.08 | 0.07 |
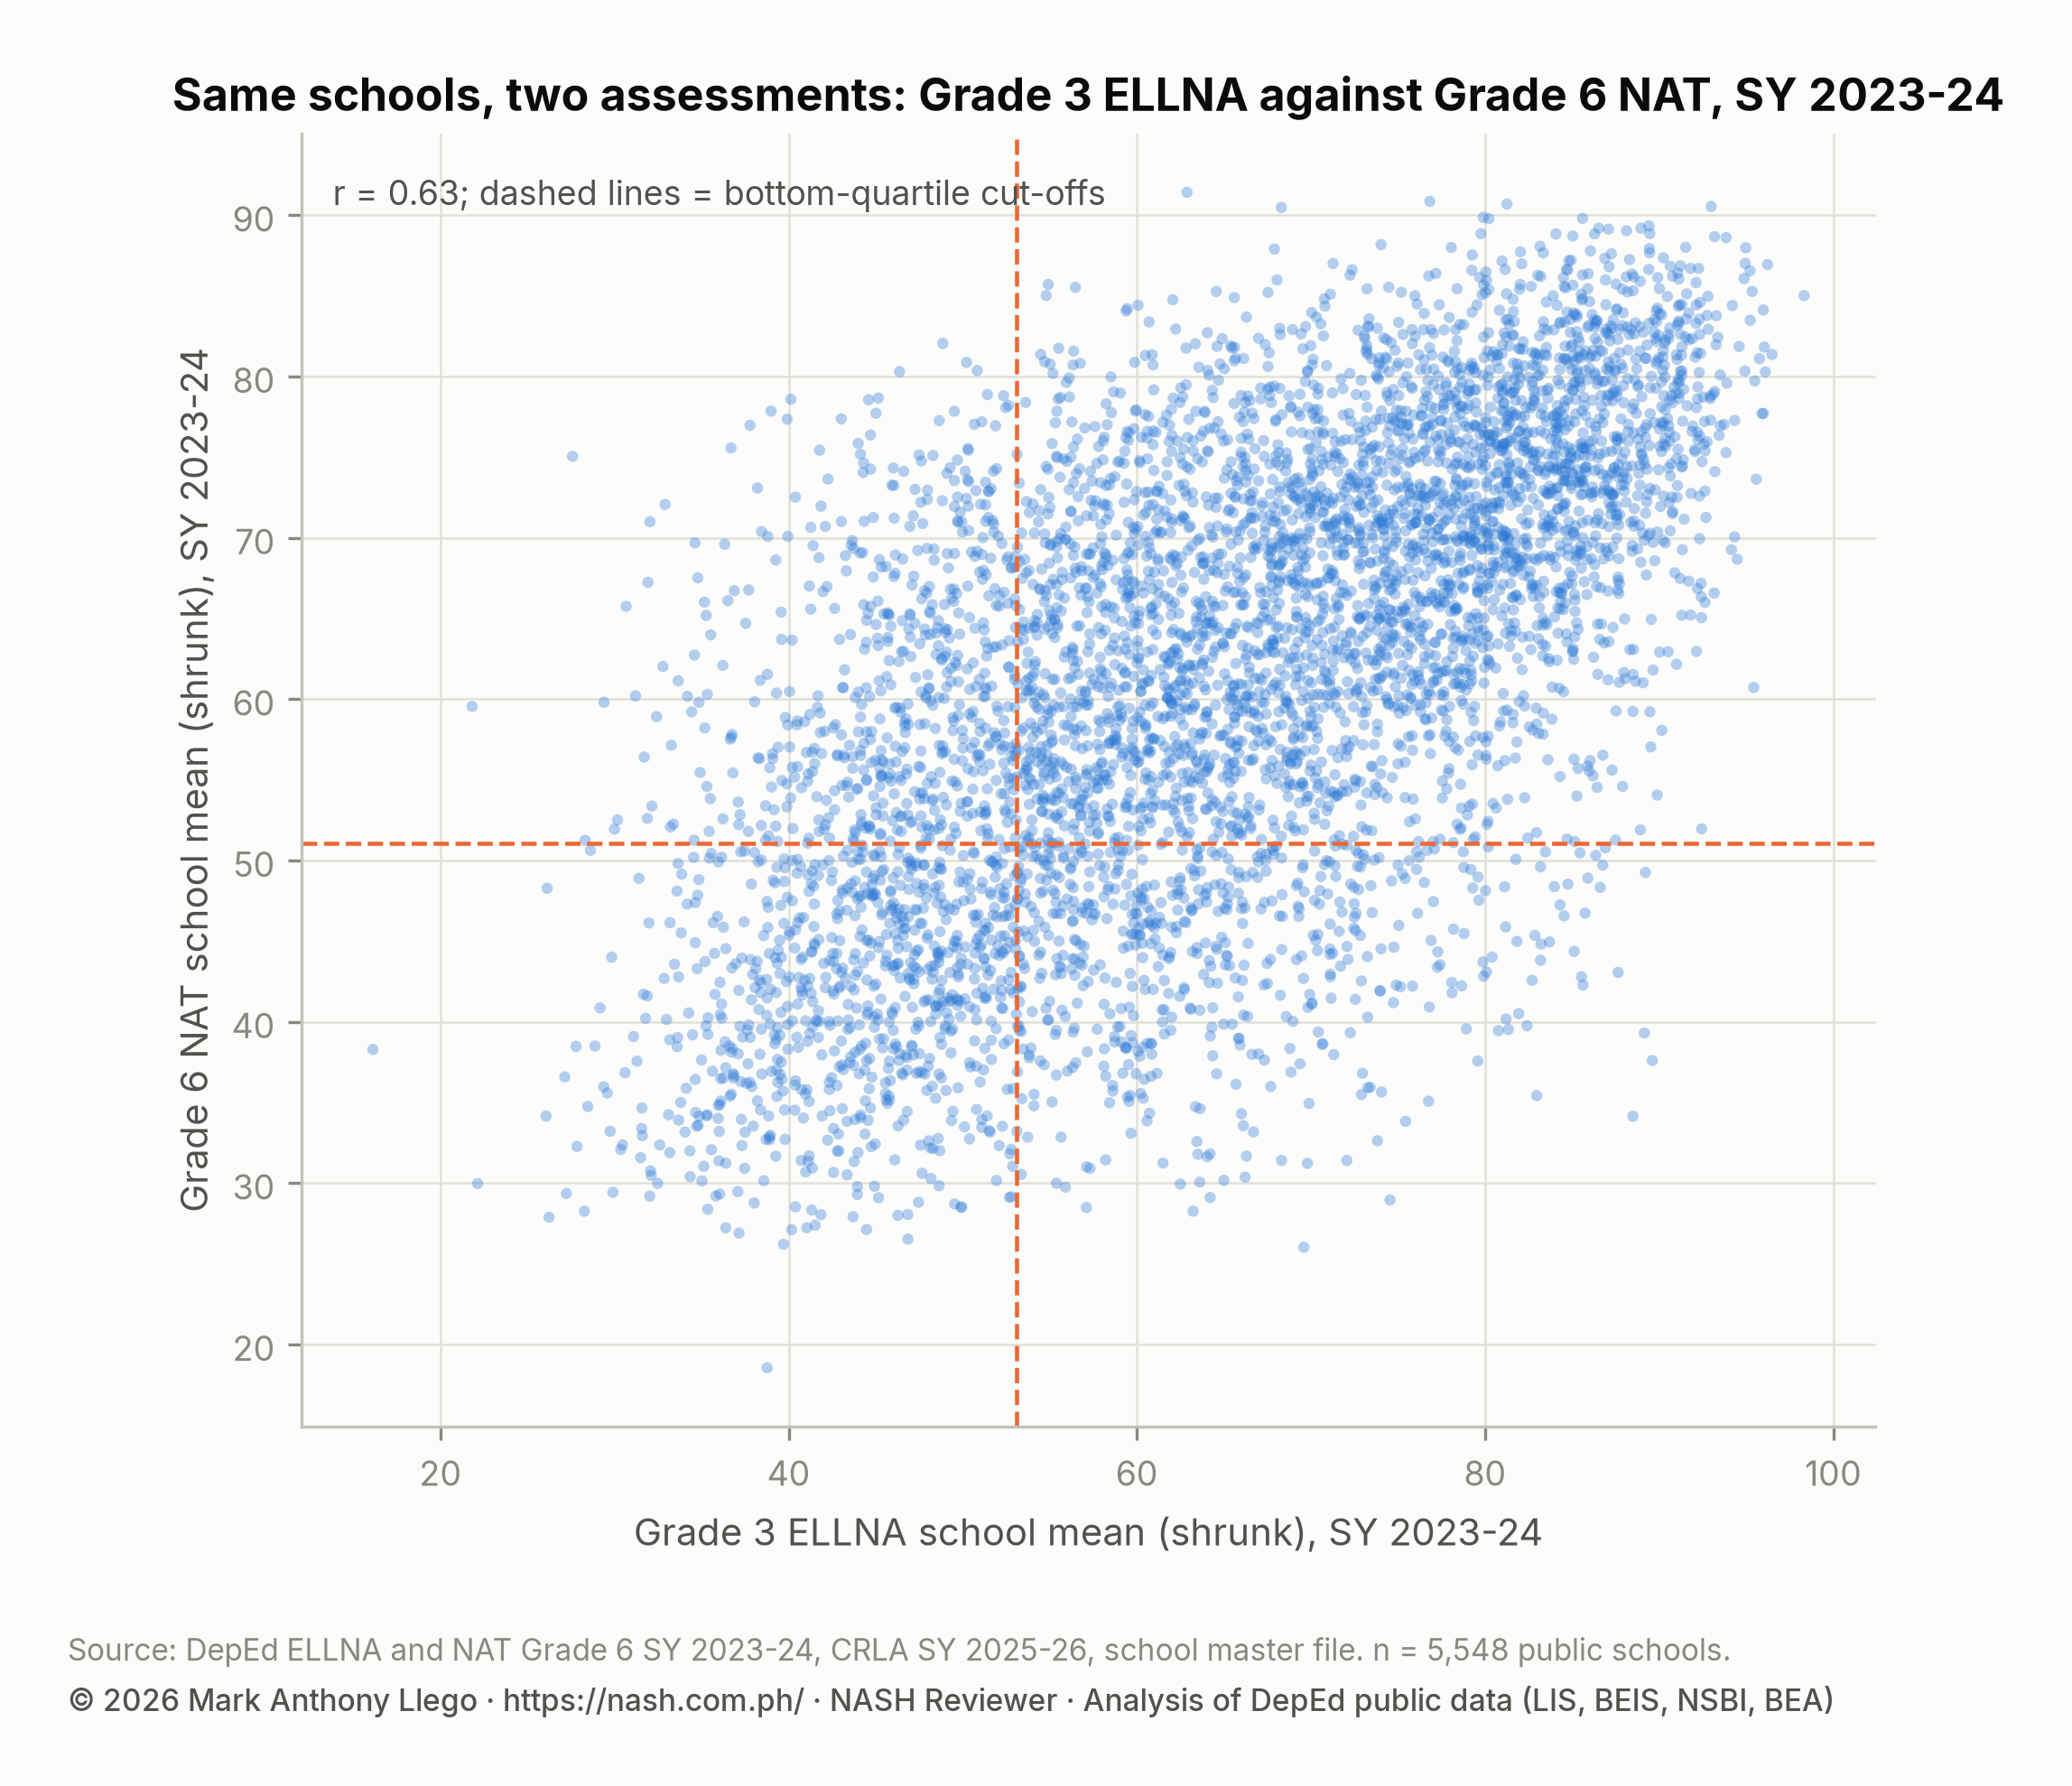
The correlation between a school’s ELLNA mean and its NAT mean is 0.62 on the raw means. It is 0.63 on the shrunk means, which remove most of the six-learner sampling noise from the NAT. Part of that correlation comes from division: a school in Leyte tends to be above a school in Zamboanga del Norte on both tests because its division is. Removing division means leaves a within-division correlation of 0.48. That is the number that matters for a division office. Among its own schools, the ones below the division average in Grade 3 are, more often than not, the ones below it in Grade 6.
| Pair | Schools | Bottom quartile on both (expected 6.25%) | Top quartile on both (expected 6.25%) | Bottom on first, top on second | Share of bottom-quartile schools on the first that are bottom-quartile on the second | Same share among all other schools | Bottom quartile on both within their division | Top quartile on both within division |
|---|---|---|---|---|---|---|---|---|
| ELLNA then NAT | 5,548 | 14.1% | 13.9% | 1.1% | 56.5% | 14.5% | 12.1% | 12.0% |
| ELLNA then CRLA | 5,721 | 6.6% | 7.2% | 4.9% | 26.5% | 24.5% | 7.4% | 7.0% |
| NAT then CRLA | 5,791 | 7.4% | 7.0% | 5.2% | 29.6% | 23.5% | 7.7% | 6.9% |
The quartile table makes the persistence concrete. If ELLNA and NAT standing were unrelated, 6.25% of schools would be in the bottom quarter on both. In fact 14.1% are. About the same share, 13.9%, are in the top quarter on both. Only 1.1% are in the bottom quarter on the ELLNA and the top quarter on the NAT. Of the schools in the bottom quarter on the ELLNA, 56.5% are in the bottom quarter on the NAT. Of all other schools, 14.5% are. Within divisions, where every school is ranked against its own division’s schools, 12.1% are in the bottom quarter on both, twice the chance rate.
Among the 5,518 schools with all three assessments, 4.0% are in the bottom quarter on all three, against 1.6% expected by chance. 20.1% are in the bottom quarter on at least two of the three.
The CRLA two years later: almost no persistence
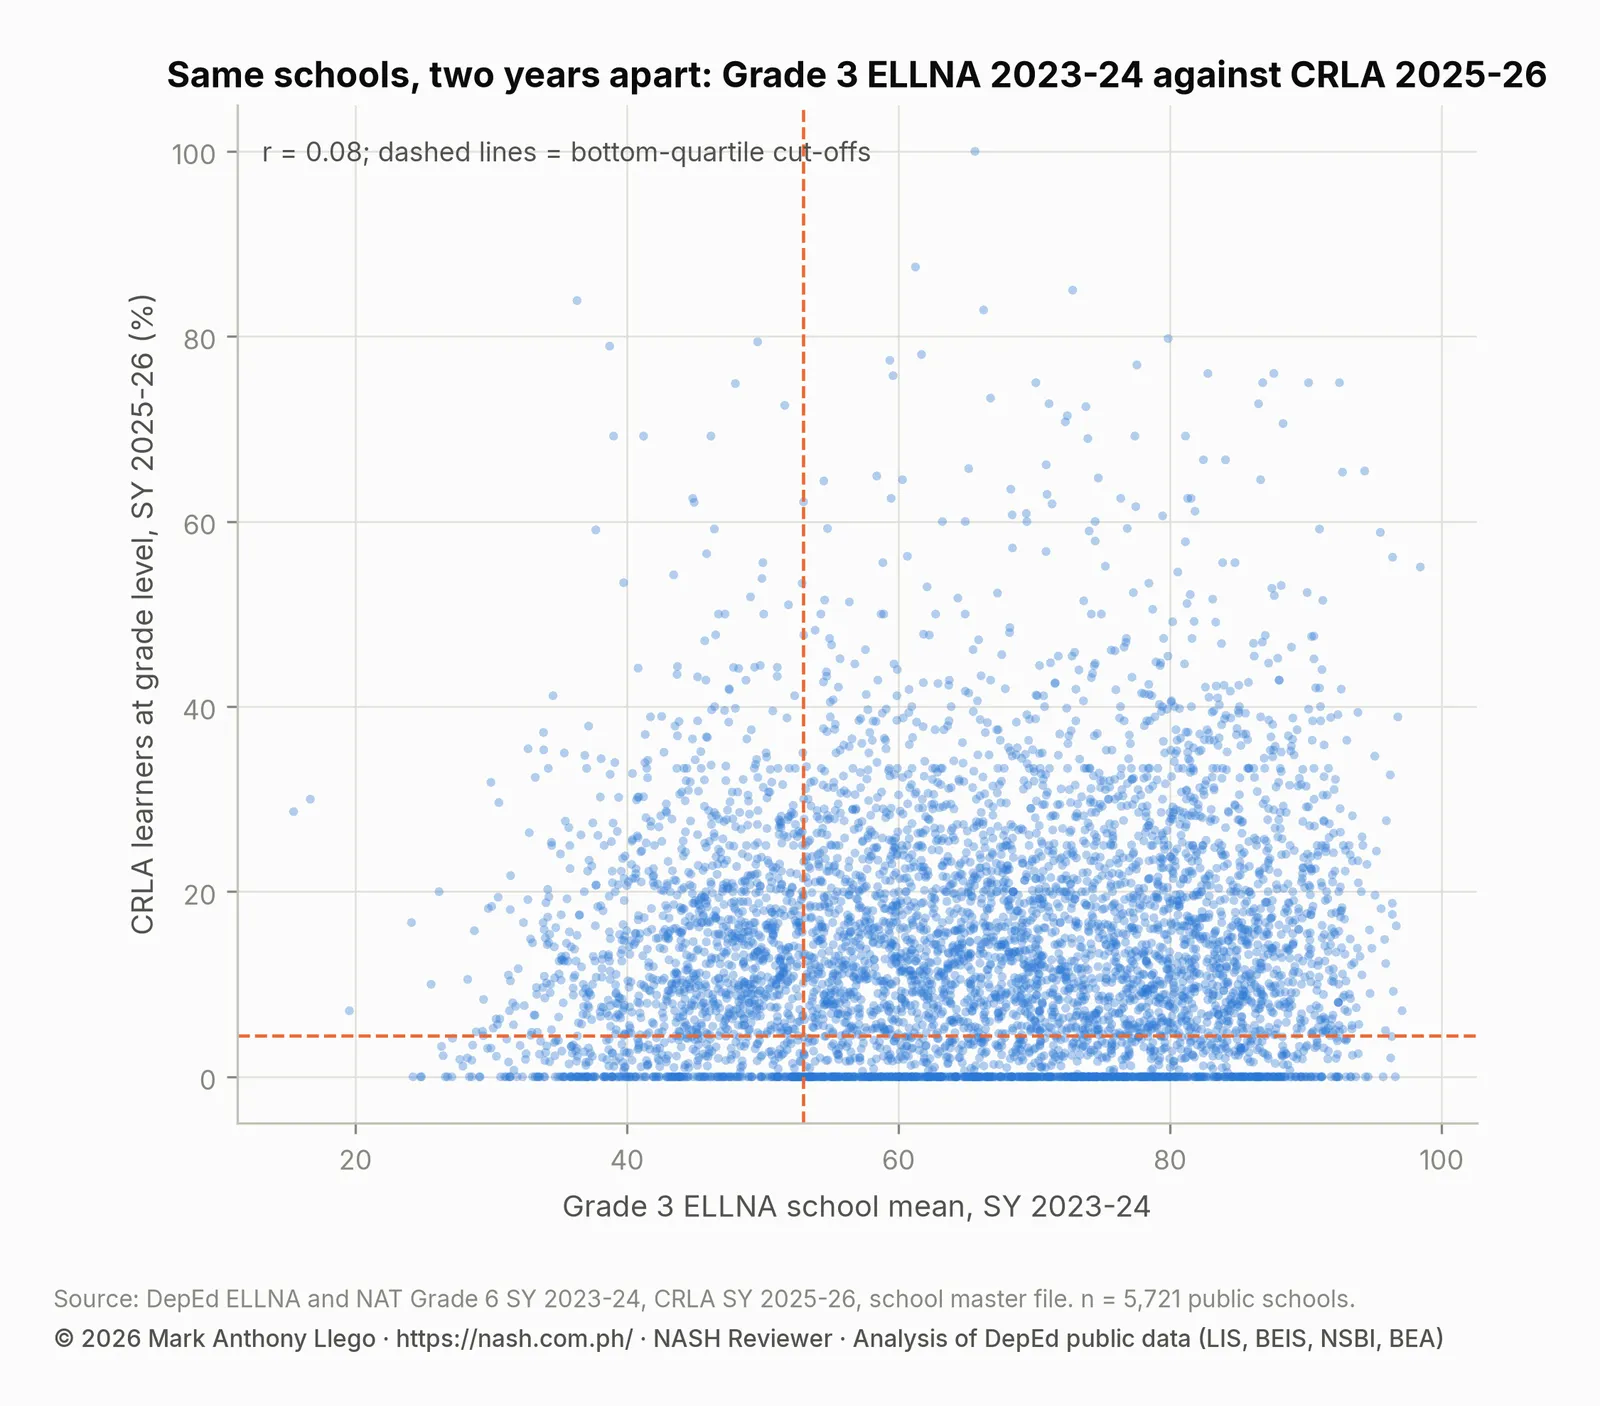
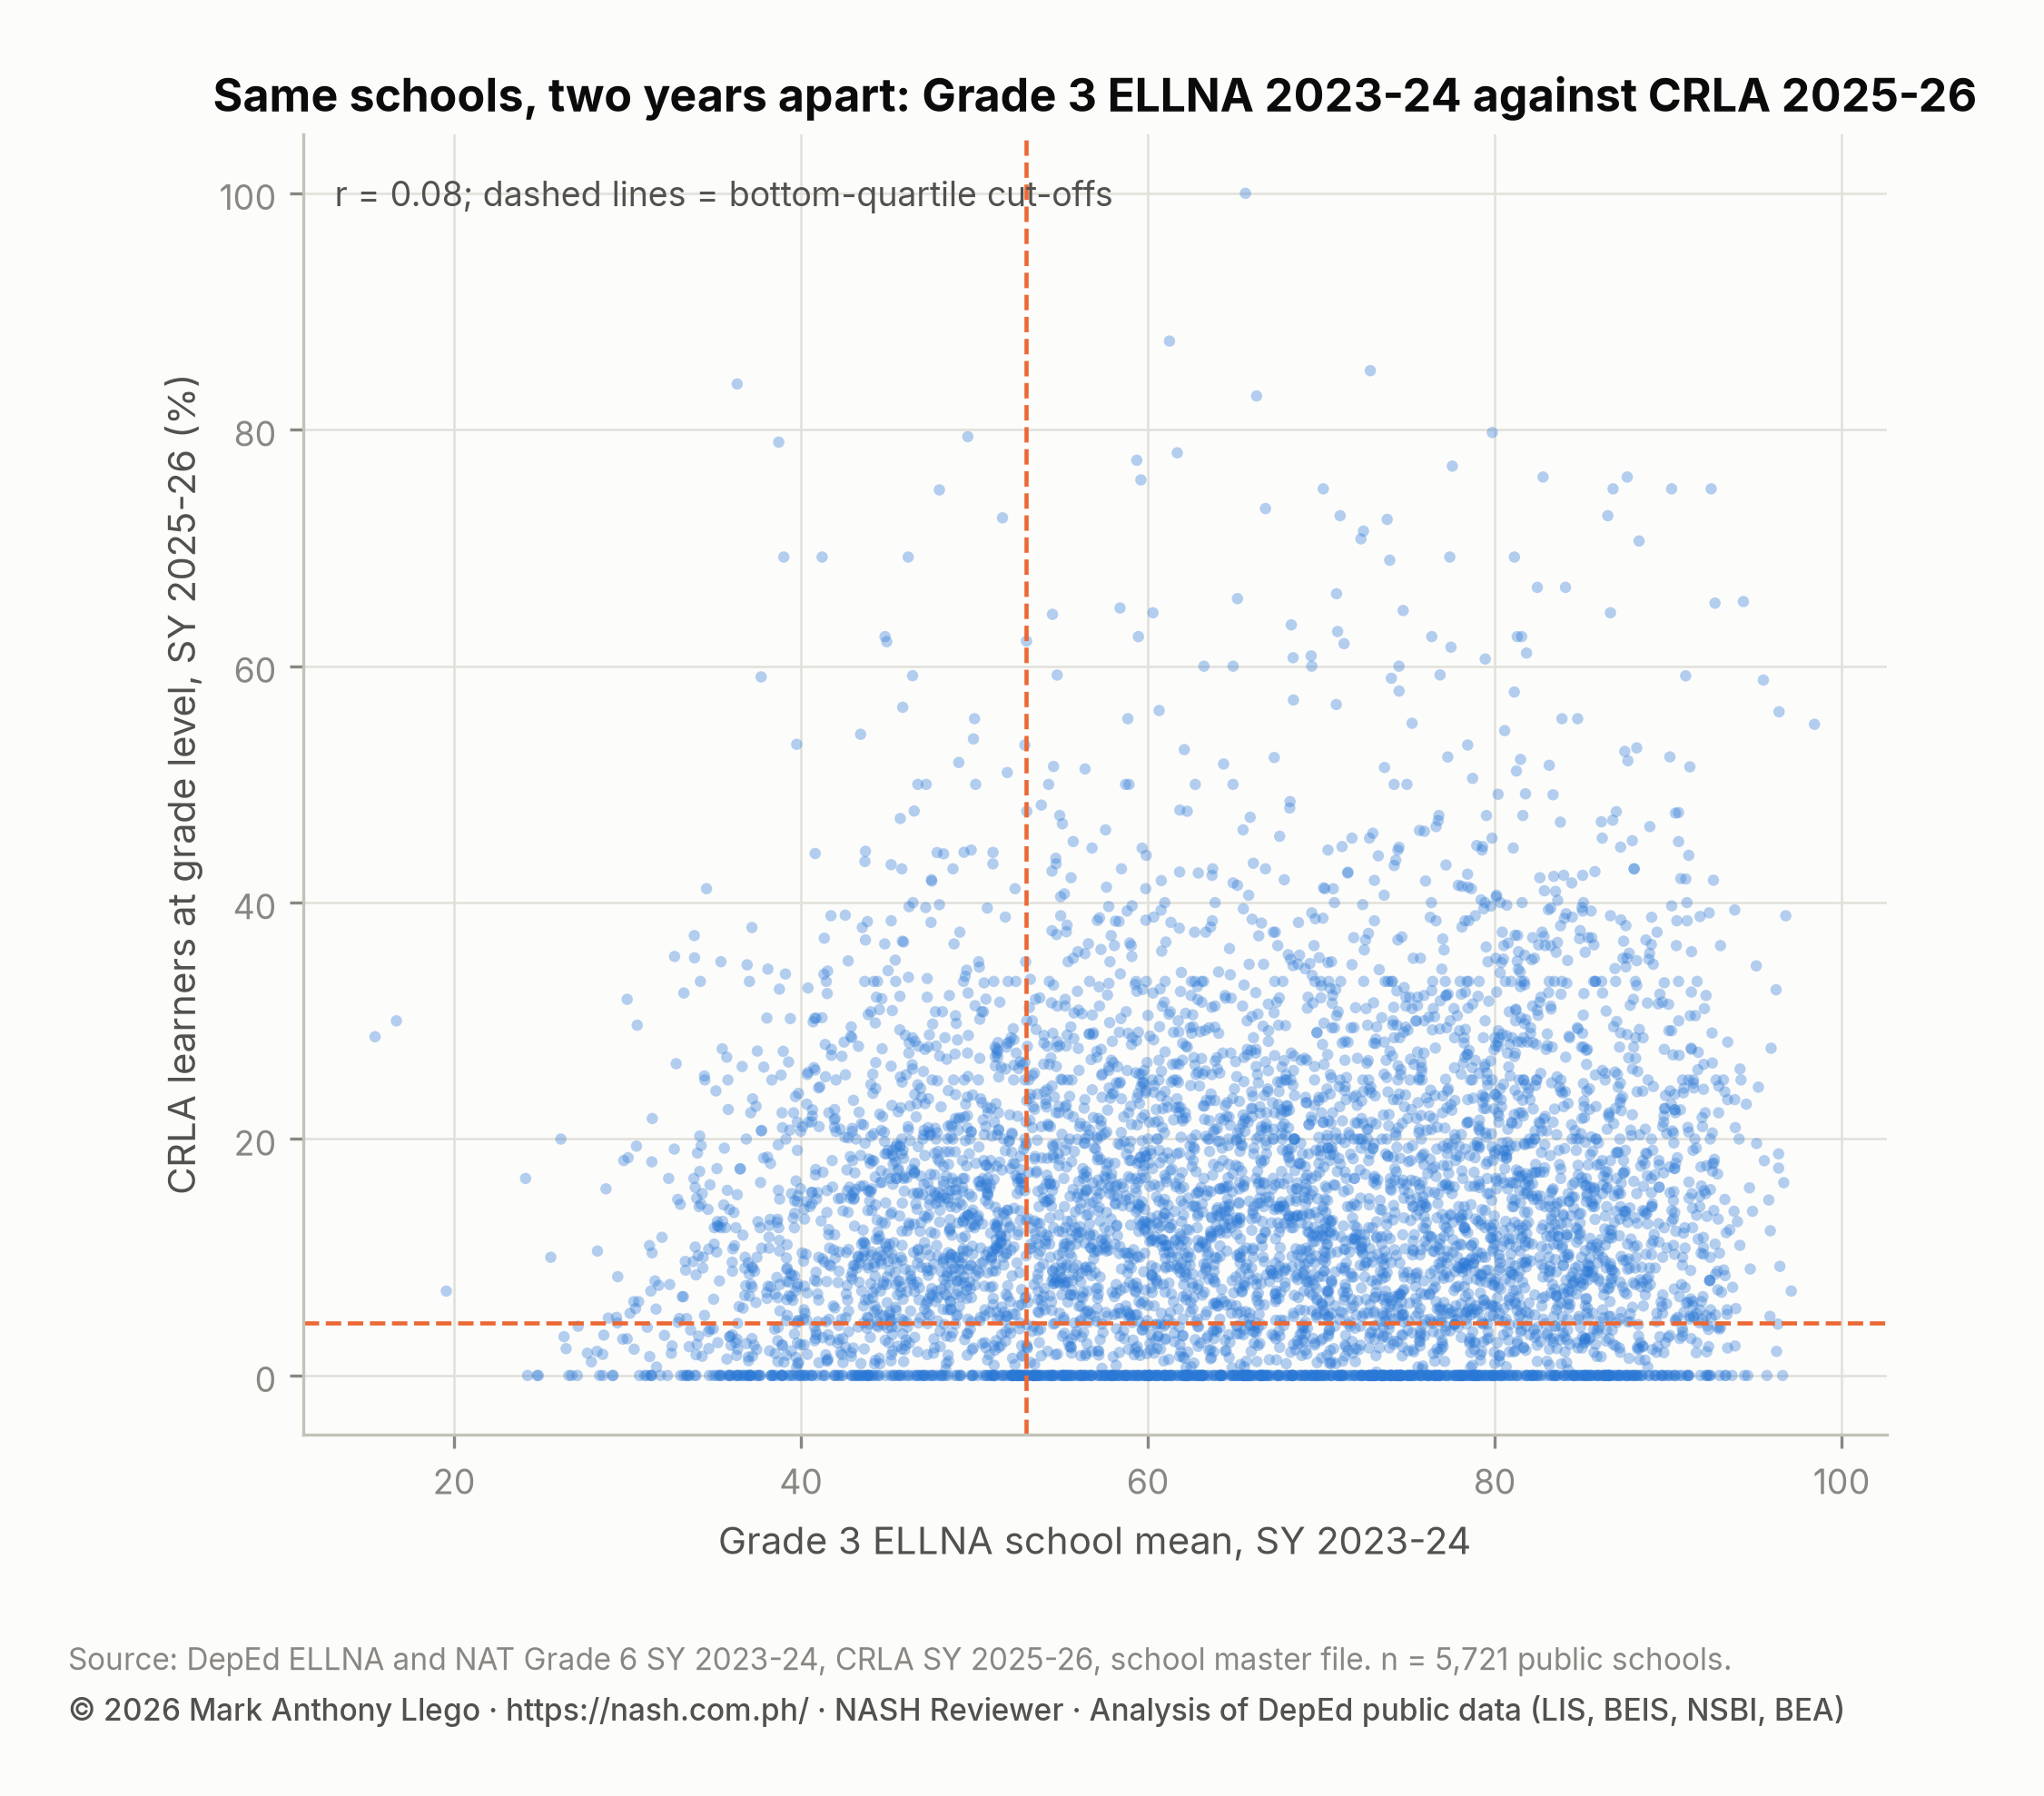
The correlation between a school’s SY 2023-2024 ELLNA mean and the share of its Grade 1 to 3 learners reading at grade level on the SY 2025-2026 CRLA is 0.08. Between the NAT and the CRLA it is also 0.08. In the quartile table, the ELLNA-to-CRLA pair shows 6.6% of schools in the bottom quarter on both, within a point of the 6.25% chance rate. 26.5% of bottom-quartile ELLNA schools are bottom-quartile on the CRLA, against 24.5% of other schools.
Three explanations are available, and they probably all apply. First, the CRLA is a teacher-administered reading screen that places each learner at one of five levels, not a standardized test scored centrally. The CRLA reading levels report found the same near-zero agreement with the ELLNA. Second, the learners are two cohorts apart. Third, the CRLA’s school-level share depends on which grades and languages a school assessed. What cannot be concluded is that early reading and later test results are unrelated in the same school. The two instruments do not agree closely enough to test that. PISA, TIMSS, SEA-PLM and the NAT covers EDCOM II’s finding that DepEd’s assessments are not linked to one another, and what it recommends for the testing system.
What a persistently low school looks like
| Indicator | Bottom quartile on both | Other assessed schools | Top quartile on both |
|---|---|---|---|
| Schools | 671 | 4213 | 664 |
| Median learners | 170 | 173 | 181.5 |
| Multigrade share of ES learners (median %) | 0 | 0 | 0 |
| Schools offering multigrade (%) | 24.1 | 19.2 | 14 |
| Learners per teacher (median) | 22 | 21.4 | 21.8 |
| Learners per classroom (median) | 24.7 | 23.8 | 23.9 |
| Schools with internet (%) | 75.7 | 79.3 | 83.6 |
| Academic computers per 100 learners (median) | 2 | 1.8 | 1.6 |
| Schools with makeshift rooms (%) | 26.5 | 26.4 | 27.9 |
| Annex or extension schools (%) | 0.3 | 0.4 | 0.2 |
| IP learners (median share %) | 0.2 | 0.2 | 0.2 |
| ELLNA test-takers (median) | 23 | 24 | 25 |
| NAT test-takers (median) | 6 | 6 | 6 |
Take the 671 schools in the bottom quarter on both the ELLNA and the NAT within their own division. Compare them with the 664 in the top quarter on both and the 4,213 in between. On the inputs the SY 2023-2024 files record, the three groups look very similar. The median persistently low school has 170 learners and the median top school 182. Learners per teacher are 22.0 against 21.8, and learners per classroom 24.7 against 23.9. A quarter of each group has a makeshift classroom. Academic computers per 100 learners are 2.0 against 1.6. Test-taker counts are the same, so the difference is not a sampling artifact of small schools.
Two inputs differ modestly in the expected direction. 24.1% of the persistently low schools offer multigrade classes, against 19.2% of the middle group and 14.0% of the persistently high schools. 75.7% report an internet connection, against 79.3% and 83.6%. Both findings are consistent with the school inputs and test results analysis. That analysis found multigrade organization and connectivity to be the inputs most reliably associated with results within divisions, and it cautioned that the associations are small. The larger point is that the inputs in the files do not identify these schools. Their results do.
By region, persistently low schools are 12.9% of the assessed schools in Region III, 12.6% in Region I, 12.0% in Region VIII, 11.8% in Region IX and 9.5% in CAR. They are spread across all five regions rather than concentrated in one.
Persistently low schools by division
| Division | Region | Schools with ELLNA and NAT | Bottom quartile on both (within division) | Top quartile on both | ELLNA mean of school means | NAT mean of school means |
|---|---|---|---|---|---|---|
| Bulacan | Region III | 173 | 16.2% | 14.5% | 65.2 | 62.9 |
| Pangasinan II, Binalonan | Region I | 182 | 15.4% | 15.4% | 58.8 | 53.9 |
| Tarlac | Region III | 206 | 15.0% | 13.1% | 77.5 | 66.7 |
| Mabalacat City | Region III | 40 | 15.0% | 12.5% | 51.3 | 49.7 |
| Dagupan City | Region I | 34 | 14.7% | 8.8% | 58.1 | 63 |
| Nueva Ecija | Region III | 246 | 14.6% | 14.6% | 75.3 | 68.3 |
| Ilocos Norte | Region I | 89 | 14.6% | 13.5% | 79.7 | 74.9 |
| Southern Leyte | Region VIII | 120 | 14.2% | 12.5% | 77 | 68.9 |
| Samar (Western Samar) | Region VIII | 314 | 14.0% | 11.1% | 74.7 | 67.1 |
| Biliran | Region VIII | 87 | 13.8% | 9.2% | 77.9 | 75.2 |
| Pangasinan I, Lingayen | Region I | 266 | 13.5% | 13.9% | 55 | 53.7 |
| Zamboanga del Sur | Region IX | 280 | 12.9% | 11.8% | 55.3 | 54.5 |
| Calbayog City | Region VIII | 149 | 12.8% | 12.1% | 74.4 | 73.1 |
| Northern Samar | Region VIII | 328 | 12.5% | 13.4% | 54.5 | 51.7 |
| Borongan City | Region VIII | 48 | 12.5% | 12.5% | 72 | 67.2 |
| Ormoc City | Region VIII | 80 | 12.5% | 10.0% | 74.6 | 73.6 |
| Science City of Muñoz | Region III | 32 | 12.5% | 6.2% | 55.9 | 56.5 |
| Kalinga | CAR | 56 | 12.5% | 12.5% | 67.1 | 58.7 |
| Pampanga | Region III | 215 | 12.1% | 10.2% | 59.2 | 58.8 |
| San Carlos City | Region I | 58 | 12.1% | 10.3% | 65.4 | 63.2 |
| Zamboanga del Norte | Region IX | 282 | 12.1% | 13.1% | 55.6 | 52 |
| Abra | CAR | 152 | 11.8% | 9.9% | 65.8 | 59.8 |
| Bataan | Region III | 69 | 11.6% | 14.5% | 72.1 | 62.4 |
| La Union | Region I | 156 | 11.5% | 11.5% | 66.4 | 64.5 |
| Urdaneta City | Region I | 44 | 11.4% | 9.1% | 67.6 | 68.1 |
| Zambales | Region III | 115 | 11.3% | 13.9% | 50.6 | 53.4 |
| Pagadian City | Region IX | 62 | 11.3% | 9.7% | 45.9 | 47.1 |
| Leyte | Region VIII | 507 | 10.7% | 11.2% | 76.3 | 73.9 |
| Catbalogan City | Region VIII | 48 | 10.4% | 12.5% | 64.1 | 58.6 |
| San Jose City | Region III | 48 | 10.4% | 12.5% | 61.8 | 61.9 |
| Eastern Samar | Region VIII | 170 | 10.0% | 9.4% | 70.5 | 66 |
| Ilocos Sur | Region I | 183 | 9.8% | 8.7% | 66.5 | 62.7 |
| Ifugao | CAR | 146 | 9.6% | 8.2% | 62.3 | 57.8 |
| Zamboanga Sibugay | Region IX | 131 | 9.2% | 13.0% | 63.1 | 59.3 |
| Tarlac City | Region III | 88 | 9.1% | 15.9% | 54.7 | 60.5 |
| Laoag City | Region I | 34 | 8.8% | 8.8% | 68.5 | 67.3 |
| City of San Jose Del Monte | Region III | 36 | 8.3% | 13.9% | 51.9 | 48.8 |
| Candon City | Region I | 25 | 8.0% | 8.0% | 48.1 | 45.4 |
| Aurora | Region III | 74 | 6.8% | 10.8% | 60 | 52.1 |
| Tacloban City | Region VIII | 46 | 6.5% | 10.9% | 67.1 | 57.7 |
| Apayao | CAR | 52 | 5.8% | 7.7% | 57.6 | 52.9 |
| Baguio City | CAR | 44 | 2.3% | 11.4% | 56.6 | 58.7 |
Because the quartiles here are taken within each division, the table measures how concentrated a division’s weakness is, not how weak the division is. Tarlac, Nueva Ecija and Ilocos Norte have some of the highest means in the five regions. Yet 15.0%, 14.6% and 14.6% of their schools are in their own bottom quarter on both tests. In those divisions the gap between the weakest schools and the rest is wide and stable. Bulacan (16.2%) and Pangasinan II (15.4%) have the highest shares. At the other end, Baguio City (2.3%), Apayao (5.8%), Tacloban City (6.5%) and Aurora (6.8%) have shares at or below the chance rate. Their low ELLNA schools are not their low NAT schools, which suggests year-to-year noise rather than a settled group of struggling schools.
Caveats
- A NAT school mean rests on about six learners and an ELLNA mean on about 24, so both carry sampling error. The shrunk-means correlation (0.63) is only slightly above the raw one (0.62), so the persistence is not an artifact of noise. If anything, noise understates it.
- The ELLNA and NAT measure different children in the same school. Persistence here is a property of schools, not of learners followed over time.
- The schools are DepEd’s selected set in five regions, not a national sample, and the selection rule is not published.
- Quartiles are a coarse cut. A school just above a cut-off on one test and just below it on the other is counted as inconsistent.
What this means for school heads
The practical conclusion is for division planners and for the school heads who will receive their support. Weakness measured by the two standardized tests is a stable feature of a minority of schools, not a matter of chance. School-targeted support, the kind the EDCOM II Final Report and the National Education Plan guide ask for, therefore has a target. For a school head, indicator 3.4.2 of the Philippine Professional Standards for School Heads (PPSSH) asks for “data-based interventions” built on learning outcomes. A school that is low on both Grade 3 and Grade 6 results has a whole-school problem, not a Grade 6 problem. A school whose CRLA profile looks fine while its ELLNA does not should trust neither instrument alone. The guide How to Read DepEd Data explains why.
Frequently asked questions
Are DepEd schools that score low on the ELLNA also low on the NAT?
Usually, yes. Among the 5,548 public schools with both results for SY 2023-2024, 56.5% of bottom-quarter ELLNA schools are bottom-quarter NAT schools, against 14.5% of other schools. The correlation between the two school means is 0.62.
Does a low ELLNA result predict a low CRLA result two years later?
Barely. The correlation is 0.08, and 26.5% of bottom-quarter ELLNA schools are bottom-quarter on the CRLA against 24.5% of other schools. The CRLA is a different kind of instrument and covers a different cohort.
What distinguishes persistently low DepEd schools in the data?
Not much that the files record. Their size, teacher and classroom ratios and equipment are close to other schools’. They are somewhat more likely to run multigrade classes (24.1% against 14.0% of persistently high schools) and somewhat less likely to have internet (75.7% against 83.6%).
Download the data
The cleaned, harmonized DepEd files behind this series are free to download in CSV and Parquet, with a codebook and checksums, under the terms of use set out in the release. Download Cleaned DepEd School Data, SY 2017-18 to 2025-26 documents every file and column. The files themselves are at data.nash.com.ph, starting with the README, the SY 2023-24 school master file (CSV, 8.0 MB) and the nine-year enrollment panel (Parquet, 17.2 MB).
More in this series
- ELLNA Grade 3 Results SY 2023-2024: DepEd Division Scores
- NAT Grade 6 Results SY 2023-2024: DepEd Division Scores
- CRLA Results SY 2025-2026: Reading Levels in Grades 1 to 3
- NAT Grade 6 SY 2023-2024: Private vs Public School Scores
- DepEd School Inputs vs Test Results: Multigrade and Internet
- DepEd Data for Aspiring School Heads: Where to Start
- For aspiring school heads: How to Read DepEd Data and the full report, Philippine basic education in numbers
Analysis and charts by Mark Anthony Llego for NASH Reviewer. Data: Department of Education ELLNA and NAT Grade 6 results SY 2023-24, CRLA SY 2025-26 and school characteristics SY 2023-24 (public datasets). Charts may be reused only with written permission from support@nash.com.ph.