The CRLA end-of-year results for SY 2025-26 cover 5,127,670 Grade 1–3 learners in 38,679 public schools across all 18 regions. Of these learners, 511,753 are struggling readers, or 10.0%: about one learner in 10. Another 47.6% read at grade level, so 52.4% were still below grade level at the end of the year. The figures come from the EDCOM II early-childhood (ECCD) dashboard as of 10 May 2026.
The Comprehensive Rapid Literacy Assessment (CRLA) is DepEd’s teacher-administered reading screen for the early grades. It places each learner at one of five levels: Low Emerging, High Emerging, Developing, Transitioning and At Grade Level. A struggling reader is a learner at either of the two Emerging levels. Struggling readers are most common in Grade 1 Mother Tongue (14.4%) and least common in Grade 3 Filipino (5.6%). By region, the share runs from NCR (5.3%) to BARMM (23.4%); by division, from 0.1% to 46.3%.
Key findings
- 511,753 of the 5,127,670 Grade 1–3 learners assessed at the end of SY 2025-26 are struggling readers (10.0%), and 47.6% read at grade level.
- Grade 1 Mother Tongue has the most struggling readers, 14.4%, and Grade 3 Filipino the fewest, 5.6%.
- The regional share of struggling readers runs from NCR (5.3%) to BARMM (23.4%), so the highest is 4.4 times the lowest. Of the 18 regions, 9 are above the national share.
- The three regions with the most struggling readers (in order: Region IV-A, BARMM, Region XII) hold 27.2% of the national total. Region IV-A has the most even though its share (6.7%) is below the national share.
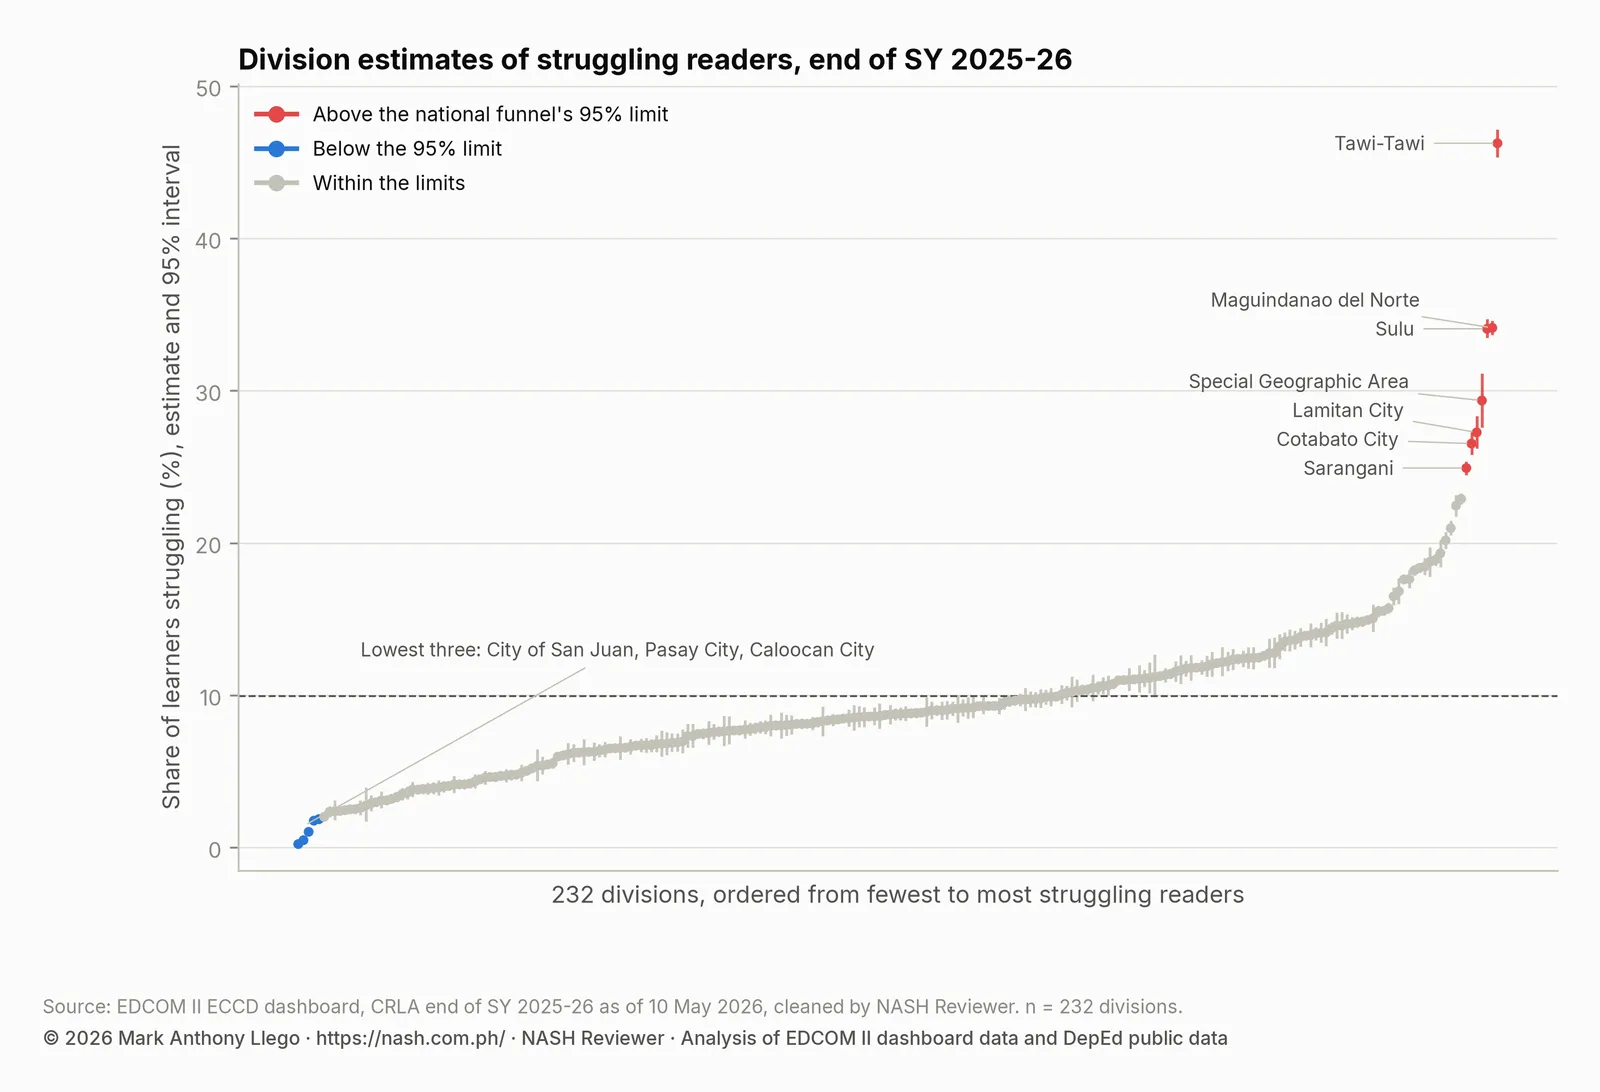
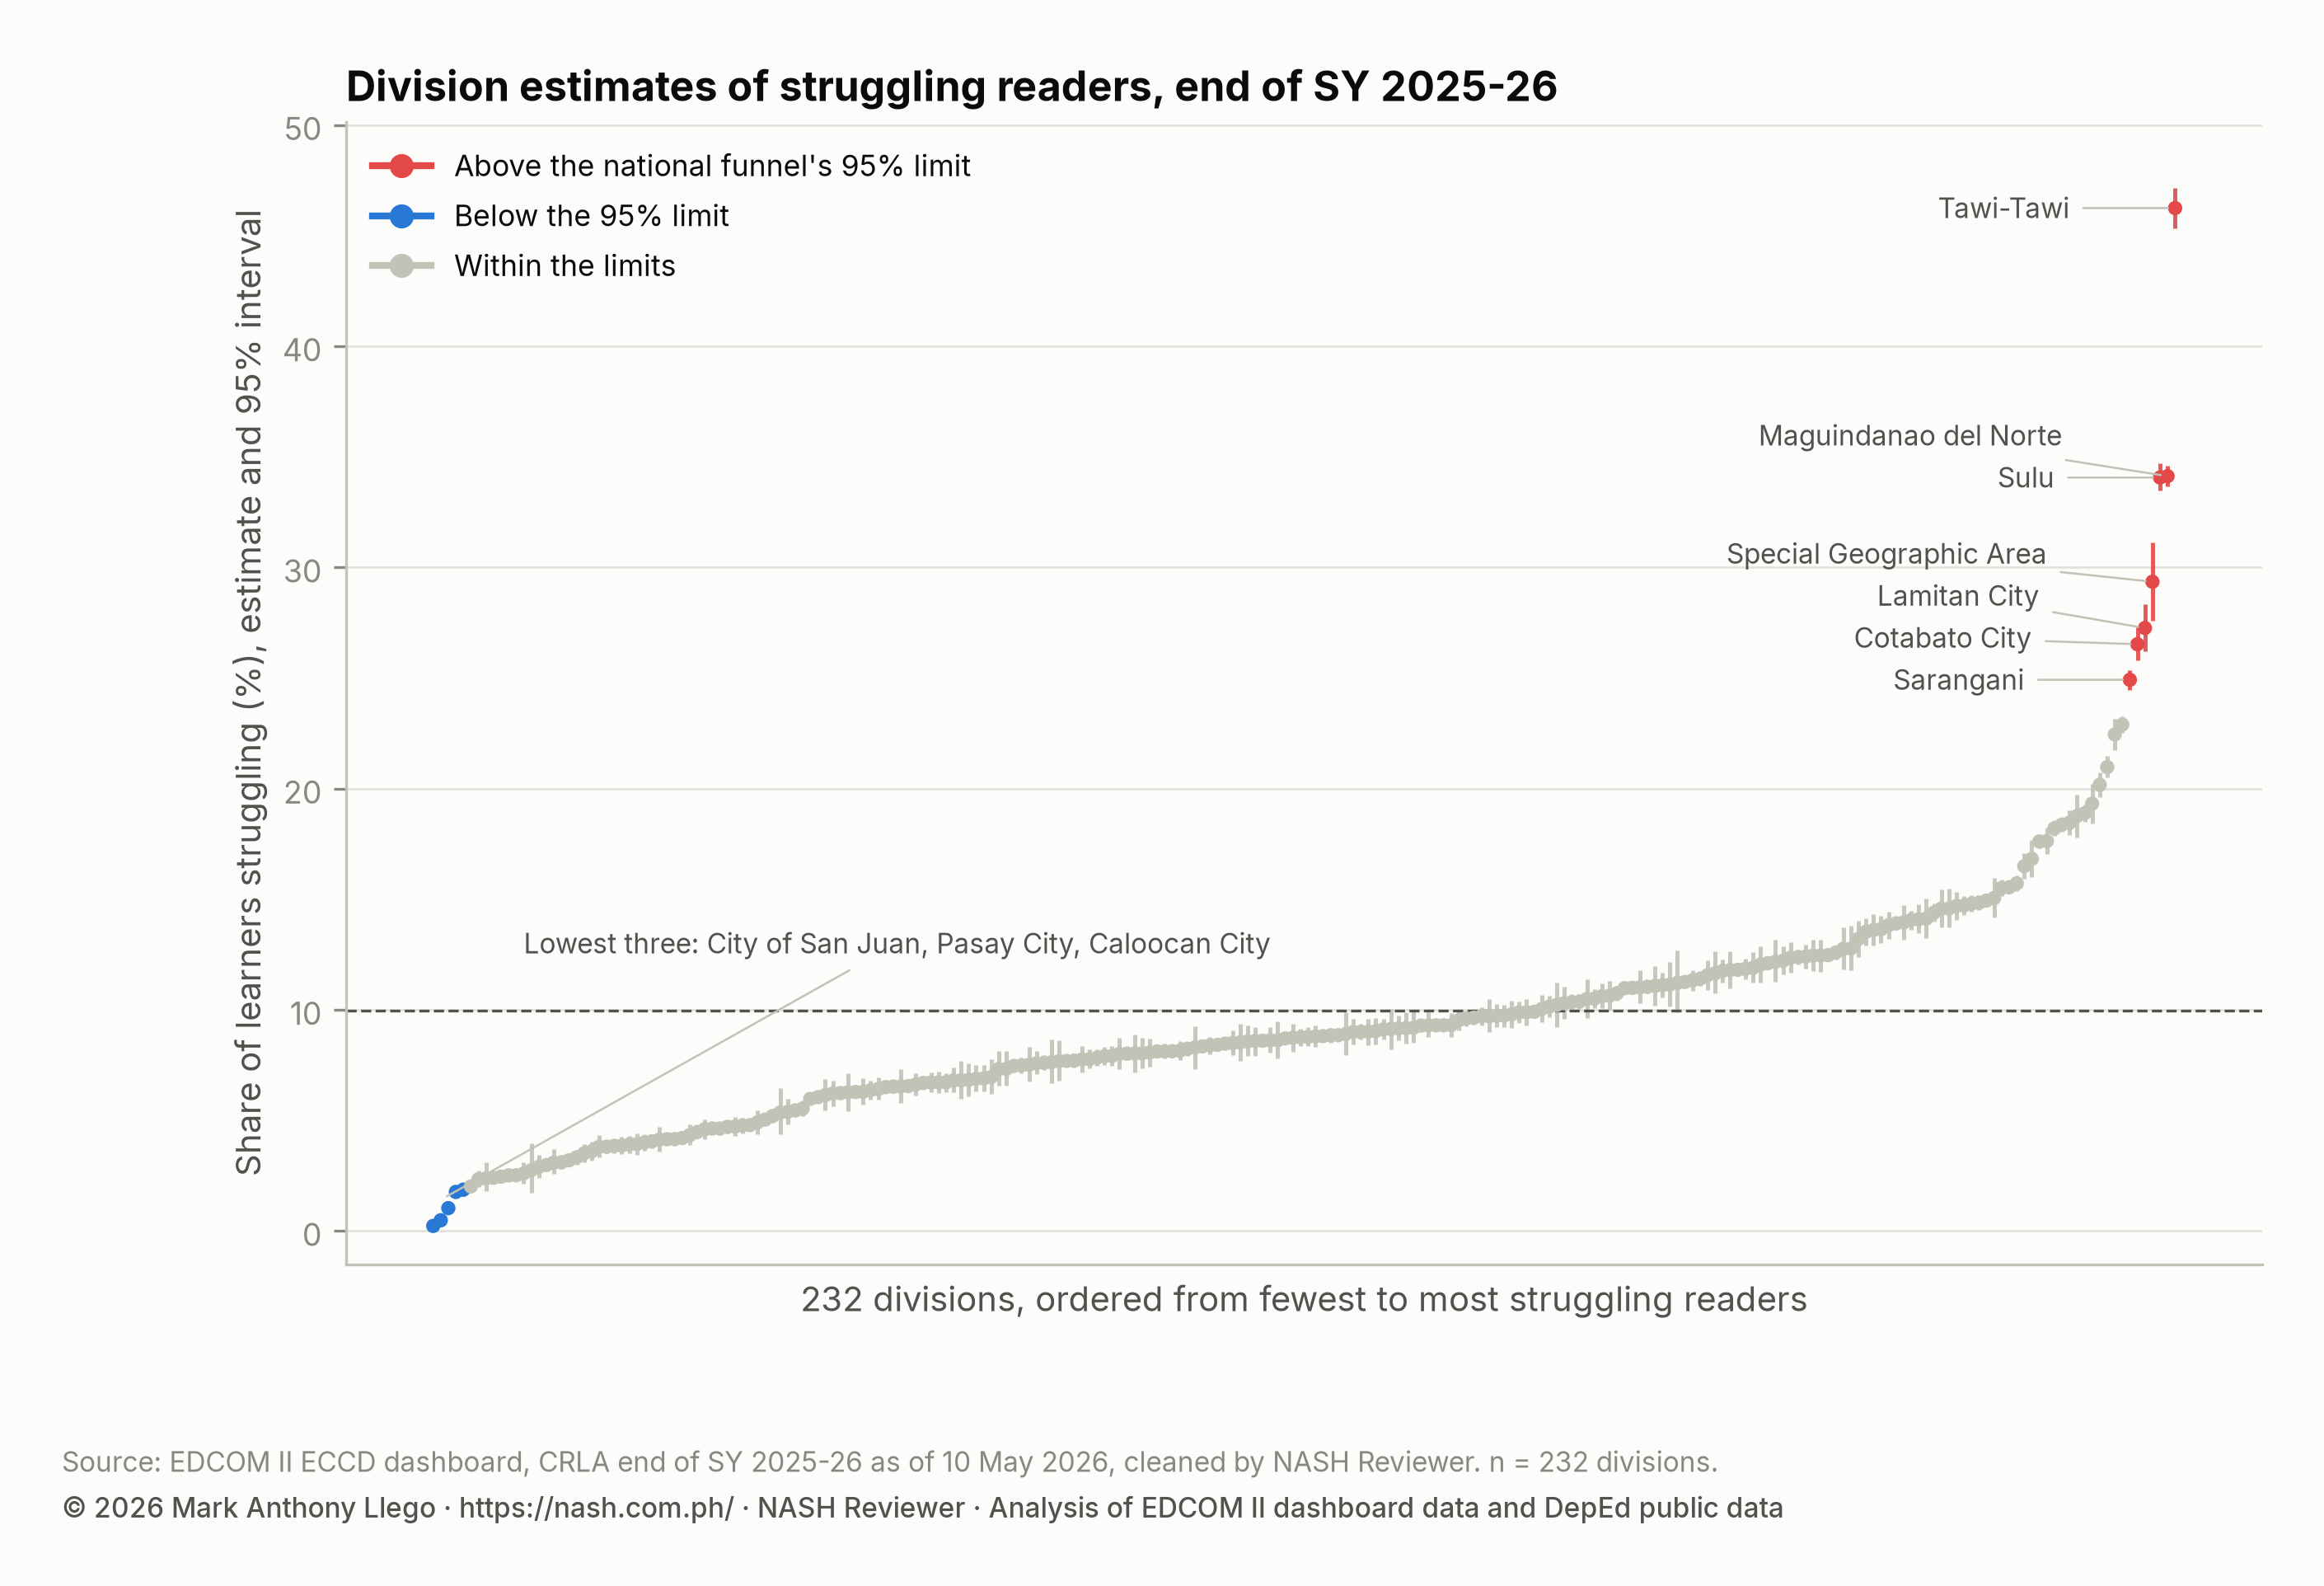
- Division estimates run from 0.2% (95% interval 0.1% to 0.4%) in City of San Juan to 46.2% (95% interval 45.3% to 47.2%) in Tawi-Tawi. 12 of the 232 divisions lie outside the national funnel’s 95% limits, and 2 are flagged at FDR 5%.
- DepEd’s selected-school CRLA file, reported earlier, put 15.7% at grade level. In the 6,061 schools found in both releases, the end-of-year shares at grade level are far higher in every grade and language, consistent with DepEd’s file being an earlier round of the same school year.
CRLA end-of-year results SY 2025-26 by reading level
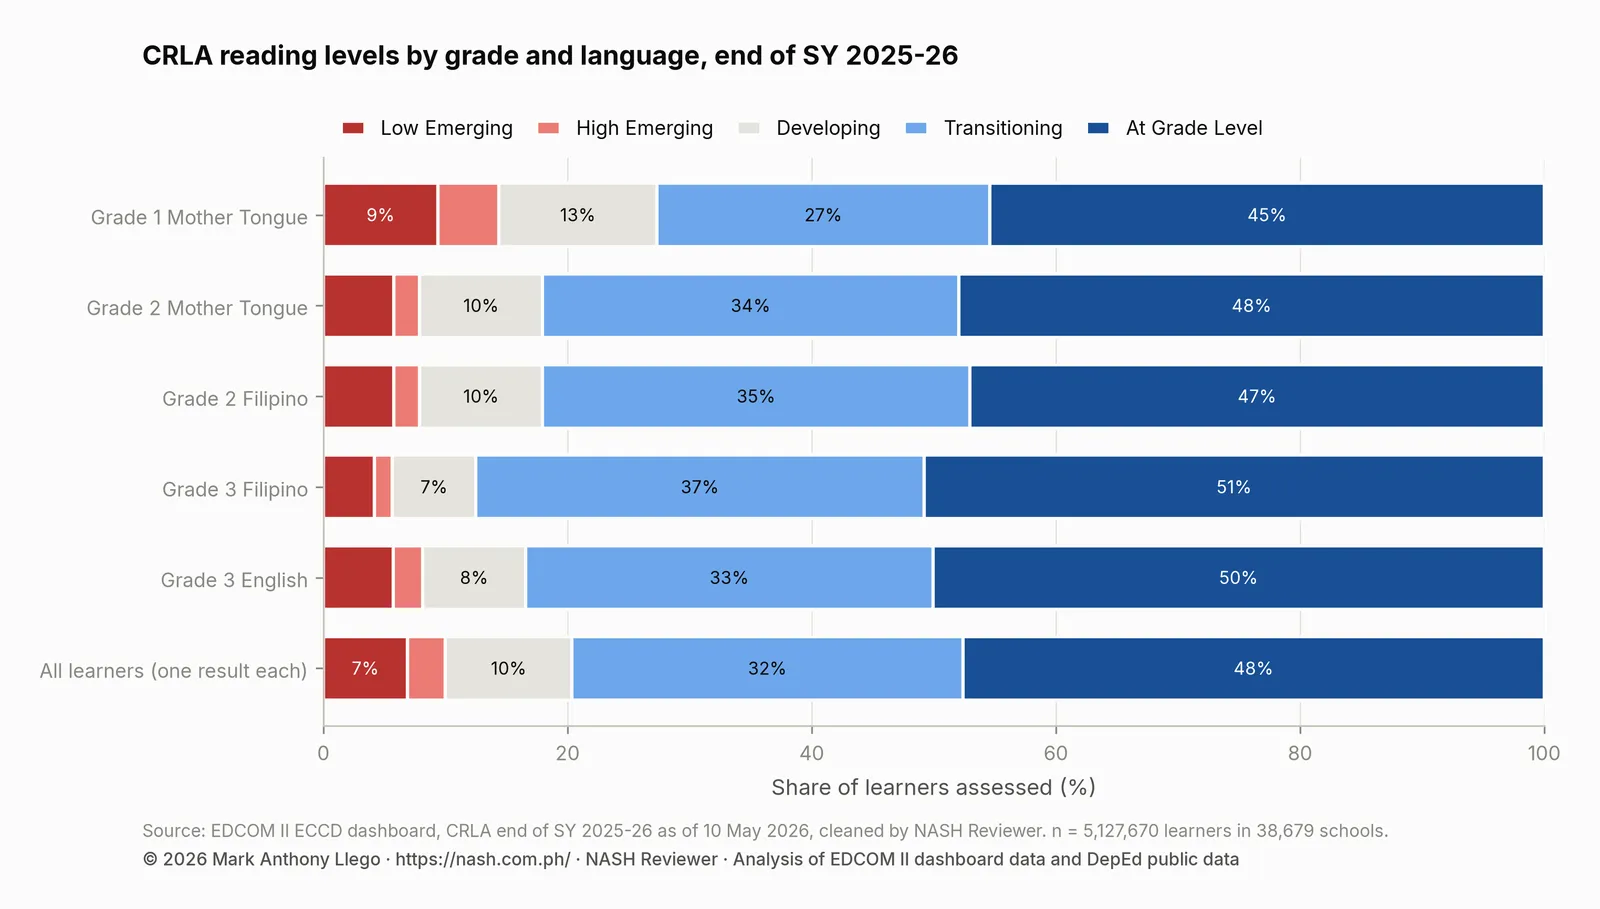
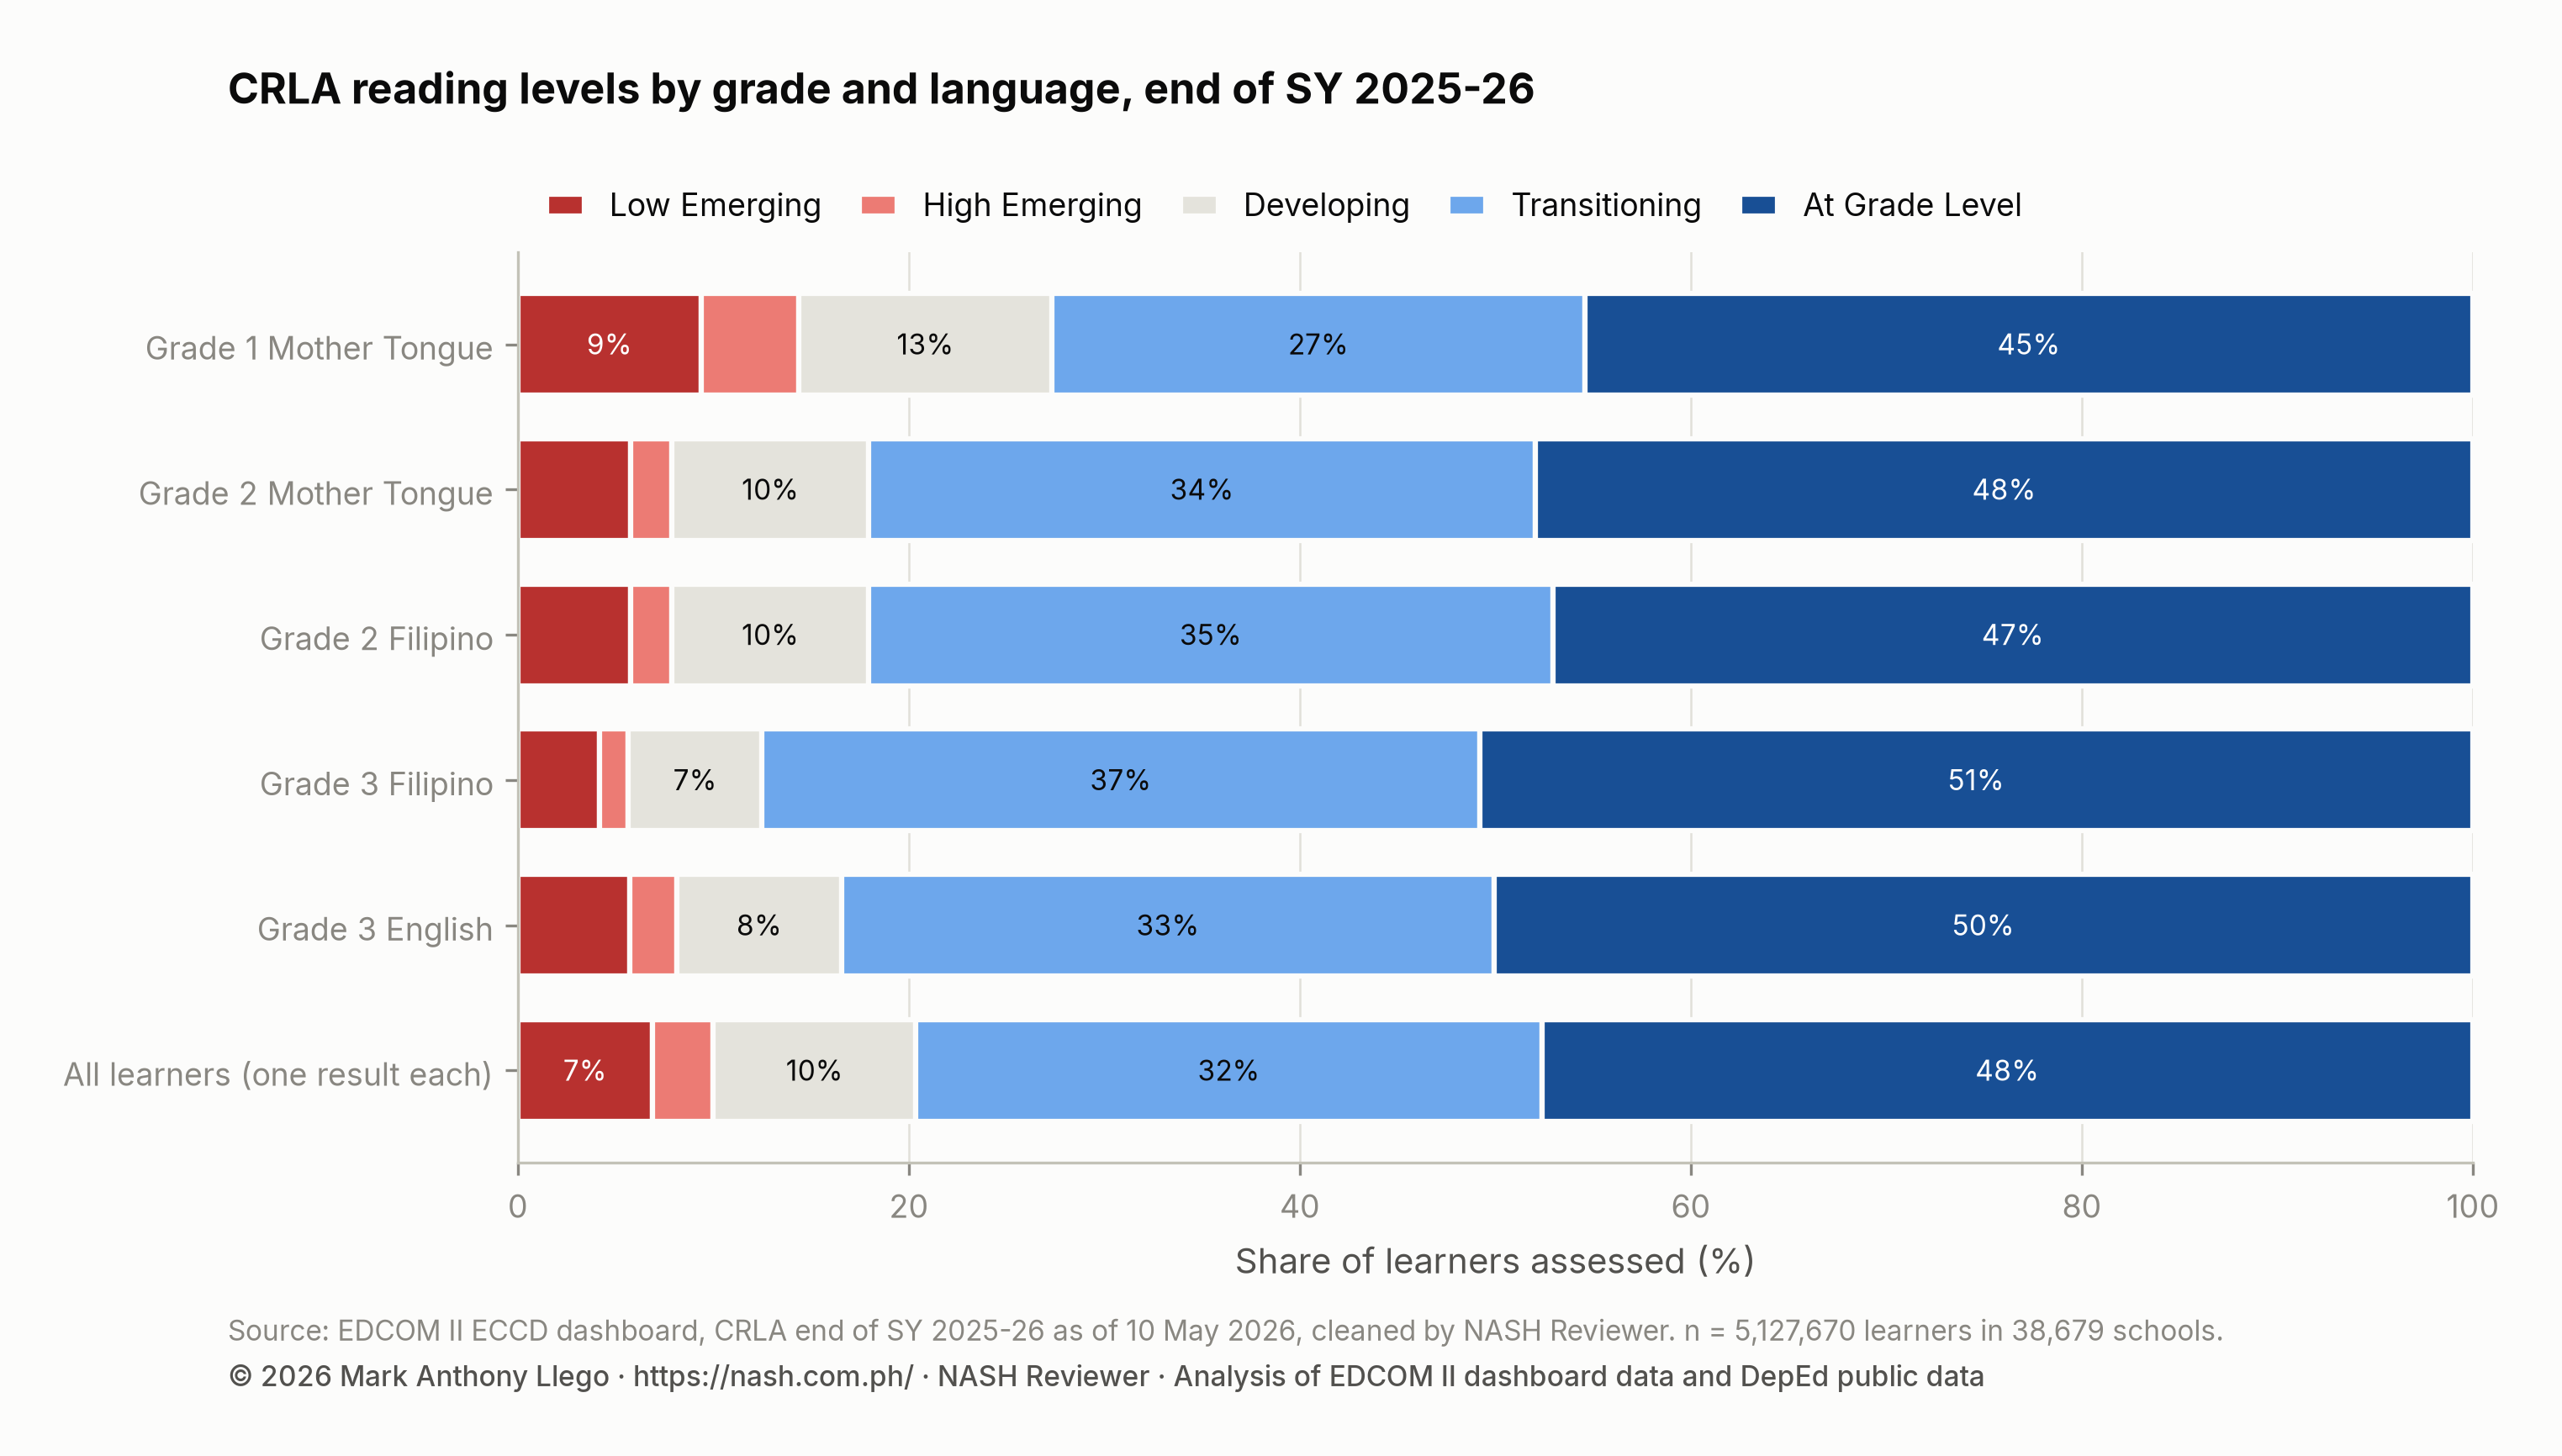
Each learner is counted once in the national total: Grade 1 learners by their Mother Tongue result, Grade 2 learners by Filipino and Grade 3 learners by English. On that basis, 6.9% of learners are Low Emerging (352,055) and 3.1% are High Emerging (159,698). A further 10.4% are Developing (532,502), 32.0% are Transitioning (1,640,942) and 47.6% are At Grade Level (2,442,473).
Developing and Transitioning learners are not struggling readers, but they are not yet at grade level either. With the struggling readers, they make up the 52.4% below grade level.
Because the CRLA covers almost every Grade 1–3 learner in public schools, the national and regional shares are population values: counts of the learners assessed, not estimates from a sample. They therefore carry no sampling intervals. Intervals appear only for divisions, where the question is what a division’s share says about its underlying rate.
Struggling readers by grade and language
The dashboard reports five grade-and-language blocks: Grade 1 in the Mother Tongue, Grade 2 in the Mother Tongue and Filipino, and Grade 3 in Filipino and English. The table shows the share at each level in each block and for all learners.
| Grade and language | Learners assessed | Low Emerging | High Emerging | Developing | Transitioning | At Grade Level | Struggling (Low + High Emerging) |
|---|---|---|---|---|---|---|---|
| Grade 1 Mother Tongue | 1,594,608 | 9.4% | 5.0% | 13.0% | 27.3% | 45.4% | 14.4% |
| Grade 2 Mother Tongue | 1,634,270 | 5.8% | 2.1% | 10.0% | 34.1% | 47.9% | 7.9% |
| Grade 2 Filipino | 1,693,777 | 5.8% | 2.1% | 10.1% | 35.0% | 47.1% | 7.9% |
| Grade 3 Filipino | 1,826,546 | 4.2% | 1.5% | 6.8% | 36.7% | 50.8% | 5.6% |
| Grade 3 English | 1,839,285 | 5.7% | 2.4% | 8.5% | 33.4% | 50.1% | 8.1% |
| All learners (one result each) | 5,127,670 | 6.9% | 3.1% | 10.4% | 32.0% | 47.6% | 10.0% |
Grade 1 Mother Tongue has the most struggling readers: 14.4%, made up of 9.4% Low Emerging and 5.0% High Emerging. It also has the smallest share at grade level, 45.4%. Grade 1 learners are the newest readers, so more of them are still at the start of reading.
Grade 2 results are almost the same in both languages: 7.9% struggling in the Mother Tongue and 7.9% in Filipino, with 47.9% and 47.1% at grade level. In Grade 3, Filipino has the fewest struggling readers of any block, 5.6%, and the largest share at grade level, 50.8%. Grade 3 English has more struggling readers (8.1%), although its share at grade level (50.1%) is close to that of Filipino.
These comparisons set different learners side by side in the same year; they do not follow the same children from grade to grade. CRLA by Language: Mother Tongue, Filipino and English compares the blocks in more detail.
CRLA results by region
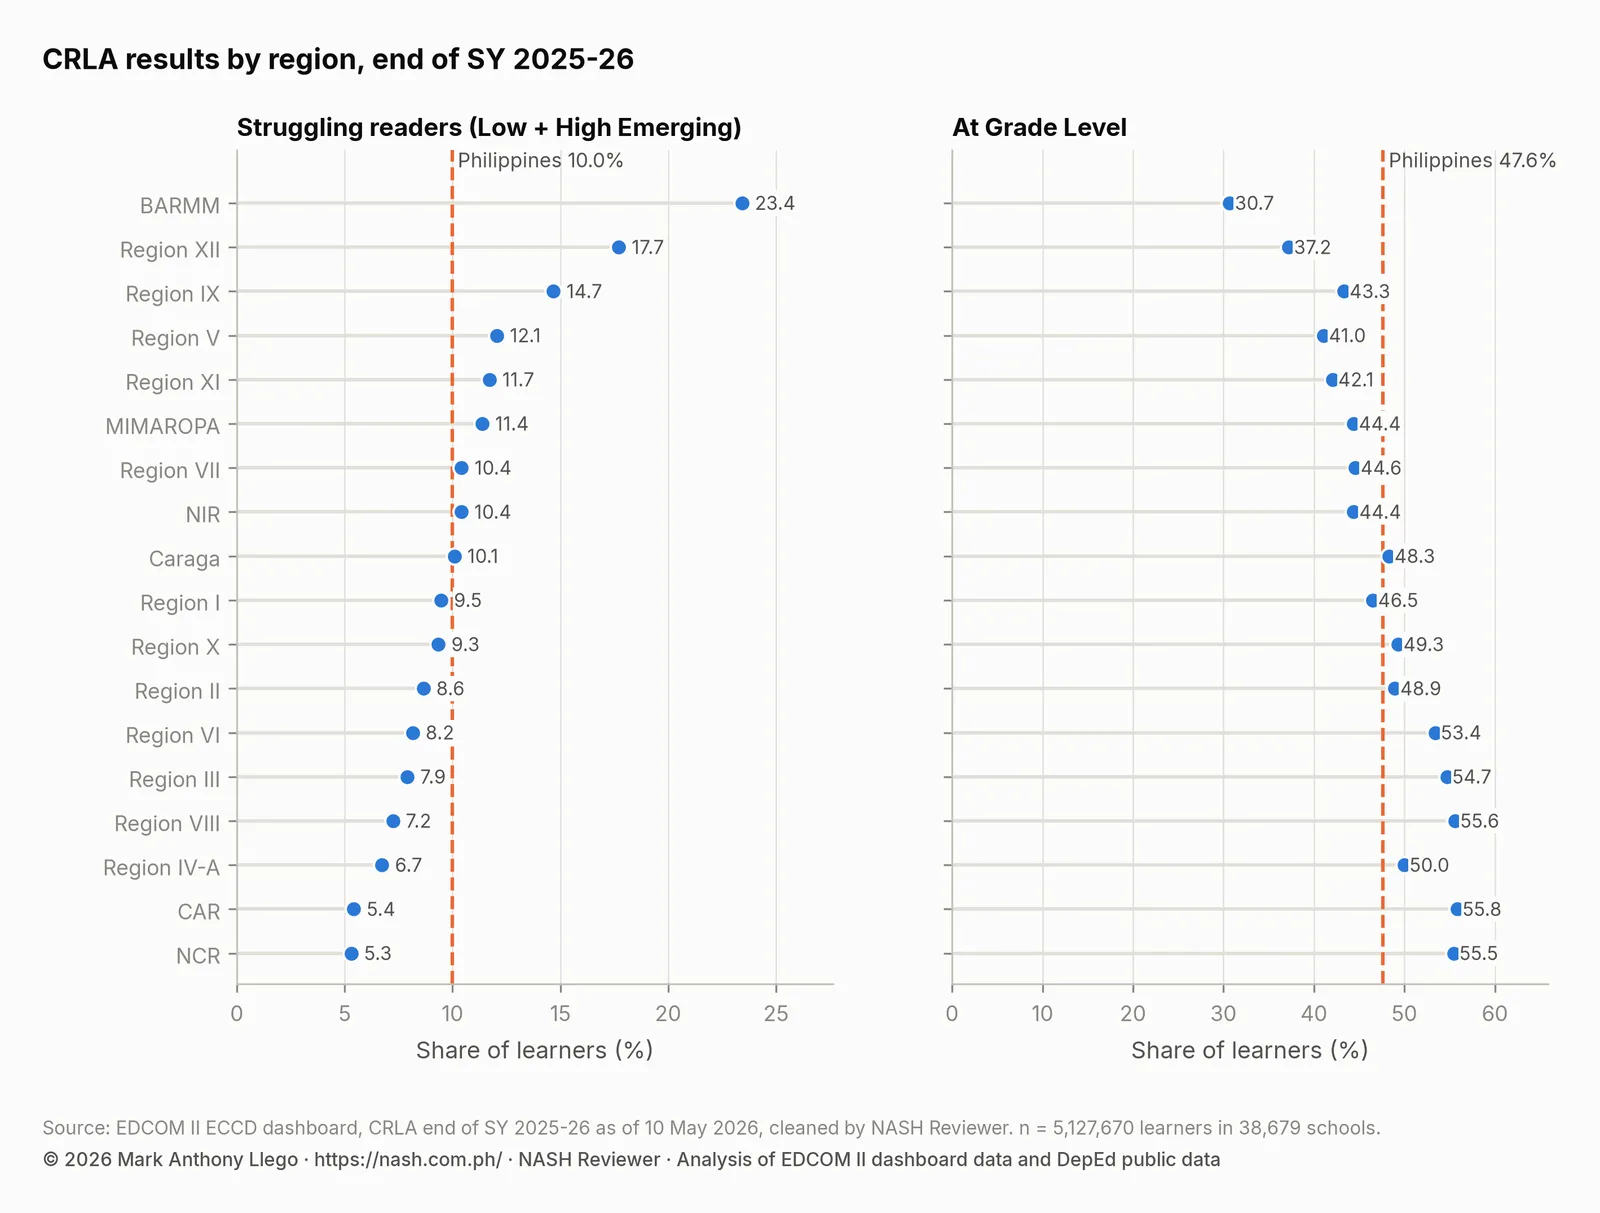
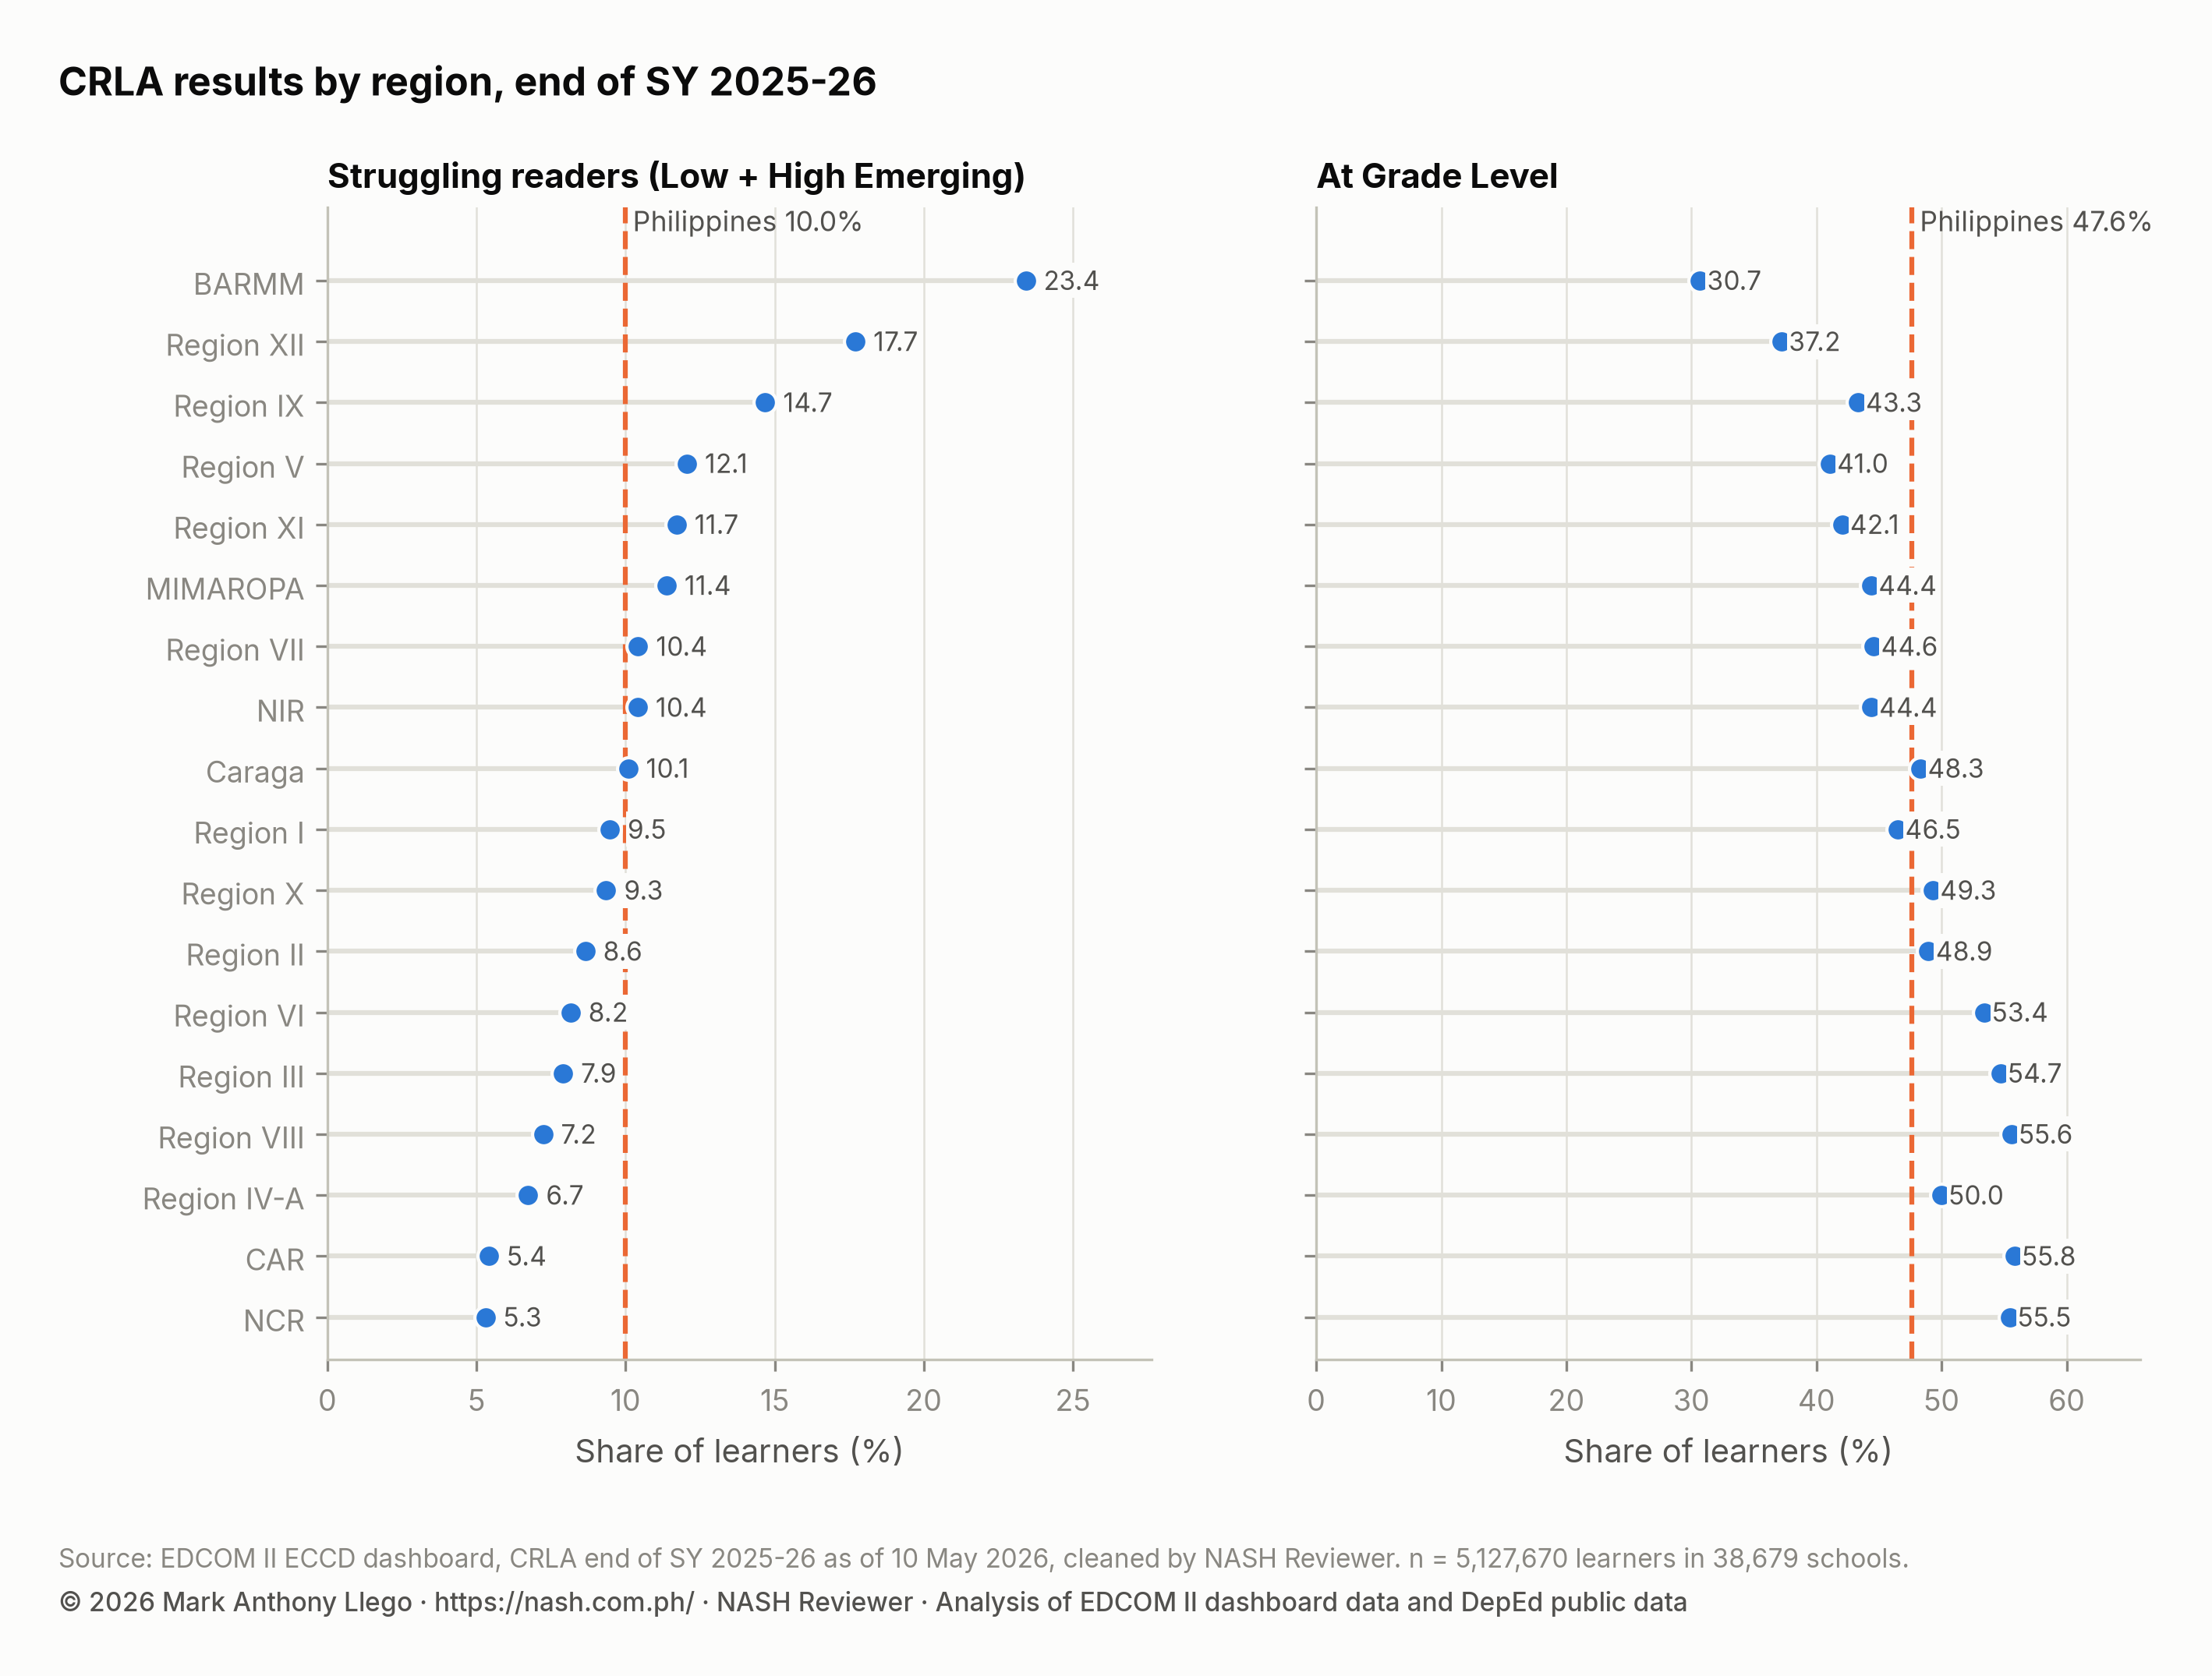
The share of struggling readers runs from NCR (5.3%) to BARMM (23.4%), and the highest regional share is 4.4 times the lowest. Of the 18 regions, 9 are above the national share of 10.0%. Every Mindanao region except Region X is among them.
The share at grade level follows a similar order. It is 55.8% in CAR and 55.5% in NCR, against 30.7% in BARMM. Region VIII combines a low share of struggling readers (7.2%) with one of the highest shares at grade level (55.6%).
These are results for places, not for individual children: every region has schools and learners at every reading level.
The table lists the regions from the lowest to the highest share of struggling readers, with the number of struggling readers and each region’s share of the national total.
| Region | Schools | Learners assessed | Struggling readers | Share struggling | Share of the country’s struggling readers | At Grade Level |
|---|---|---|---|---|---|---|
| NCR | 520 | 469,125 | 24,884 | 5.3% | 4.9% | 55.5% |
| CAR | 1,500 | 75,844 | 4,112 | 5.4% | 0.8% | 55.8% |
| Region IV-A | 2,754 | 724,571 | 48,777 | 6.7% | 9.5% | 50.0% |
| Region VIII | 3,656 | 245,652 | 17,765 | 7.2% | 3.5% | 55.6% |
| Region III | 3,024 | 520,994 | 41,175 | 7.9% | 8.0% | 54.7% |
| Region VI | 2,433 | 199,208 | 16,243 | 8.2% | 3.2% | 53.4% |
| Region II | 2,212 | 164,618 | 14,237 | 8.6% | 2.8% | 48.9% |
| Region X | 2,176 | 273,425 | 25,563 | 9.3% | 5.0% | 49.3% |
| Region I | 2,409 | 218,318 | 20,669 | 9.5% | 4.0% | 46.5% |
| Caraga | 1,706 | 159,091 | 16,044 | 10.1% | 3.1% | 48.3% |
| NIR | 1,742 | 254,077 | 26,444 | 10.4% | 5.2% | 44.4% |
| Region VII | 2,189 | 320,467 | 33,390 | 10.4% | 6.5% | 44.6% |
| MIMAROPA | 1,924 | 186,639 | 21,230 | 11.4% | 4.1% | 44.4% |
| Region XI | 1,749 | 274,481 | 32,147 | 11.7% | 6.3% | 42.1% |
| Region V | 3,162 | 346,762 | 41,812 | 12.1% | 8.2% | 41.0% |
| Region IX | 2,310 | 250,036 | 36,716 | 14.7% | 7.2% | 43.3% |
| Region XII | 1,744 | 236,985 | 41,972 | 17.7% | 8.2% | 37.2% |
| BARMM | 1,469 | 207,377 | 48,573 | 23.4% | 9.5% | 30.7% |
Where the struggling readers are: counts and rates
A region’s rate and its number of struggling readers tell different stories. The three regions with the most struggling readers (in order: Region IV-A, BARMM, Region XII) together hold 27.2% of the country’s struggling readers.
BARMM and Region XII are on that list because their rates are high: 23.4% and 17.7%. Region IV-A is on it because it is large. Its rate is 6.7%, below the national share, but it assessed 724,571 learners, the most of any region. That gives it 48,777 struggling readers, 9.5% of the national total. Region III is similar, with a rate of 7.9% and 41,175 struggling readers.
Large regions hold many struggling readers even at moderate rates. Support that goes only where rates are highest would miss many of them. Where Struggling Readers Are Concentrated looks at this pattern in more detail.
CRLA results by division
The 232 divisions range from 762 learners assessed in the smallest to 121,080 in the largest. Their raw shares of struggling readers run from 0.1% to 46.3%. A fair comparison needs three things: an estimate that allows for size, a measure of how certain each division’s position is, and a check that allows for the many divisions compared at once. How to Read a School’s CRLA Results Fairly sets out the full method; a short version follows.
Division estimates and their 95% intervals
The division figures are empirical Bayes estimates: weighted averages of each division’s own share and the national rate. A small division is pulled further toward the national rate, because a small group can show a high or low share by chance. A large division stays close to its own share.
The size of the pull is set from the data. Divisions differ a great deal from one another, so the national rate says little about any one division: in the model it counts as much as 26.7 learners. Even the smallest division assessed 762 learners, so the pull is small for every division. Tawi-Tawi, for example, has a raw share of 46.3% and an estimate of 46.2% (95% interval 45.3% to 47.2%).
Each estimate comes with a 95% interval: the range that, under the model, is very likely to contain the division’s underlying rate. For City of San Juan, the division with the fewest struggling readers, the estimate is 0.2% (95% interval 0.1% to 0.4%). A share this close to zero is worth a routine data check, as any unusual pattern is. CRLA Schools With No Struggling Readers: A Data Check explains how such checks are done.
Rank intervals: a division’s rank is uncertain
A league table gives each division a single rank, but that rank is uncertain. To measure how uncertain, the analysis takes 4,000 draws of plausible division rates from the model, a step called posterior simulation. It ranks the divisions in each draw and records a 95% interval for each division’s rank. Rank 1 is the division with the fewest struggling readers.
For the median division, the 95% interval for its rank is 14 places wide. Two divisions a few places apart therefore often cannot be told apart. Ranks are firm only for a few divisions near the two ends of the list: City of San Juan ranks 1 (95% interval 1 to 1), and Tawi-Tawi ranks 232 (95% interval 232 to 232).
The national funnel plot
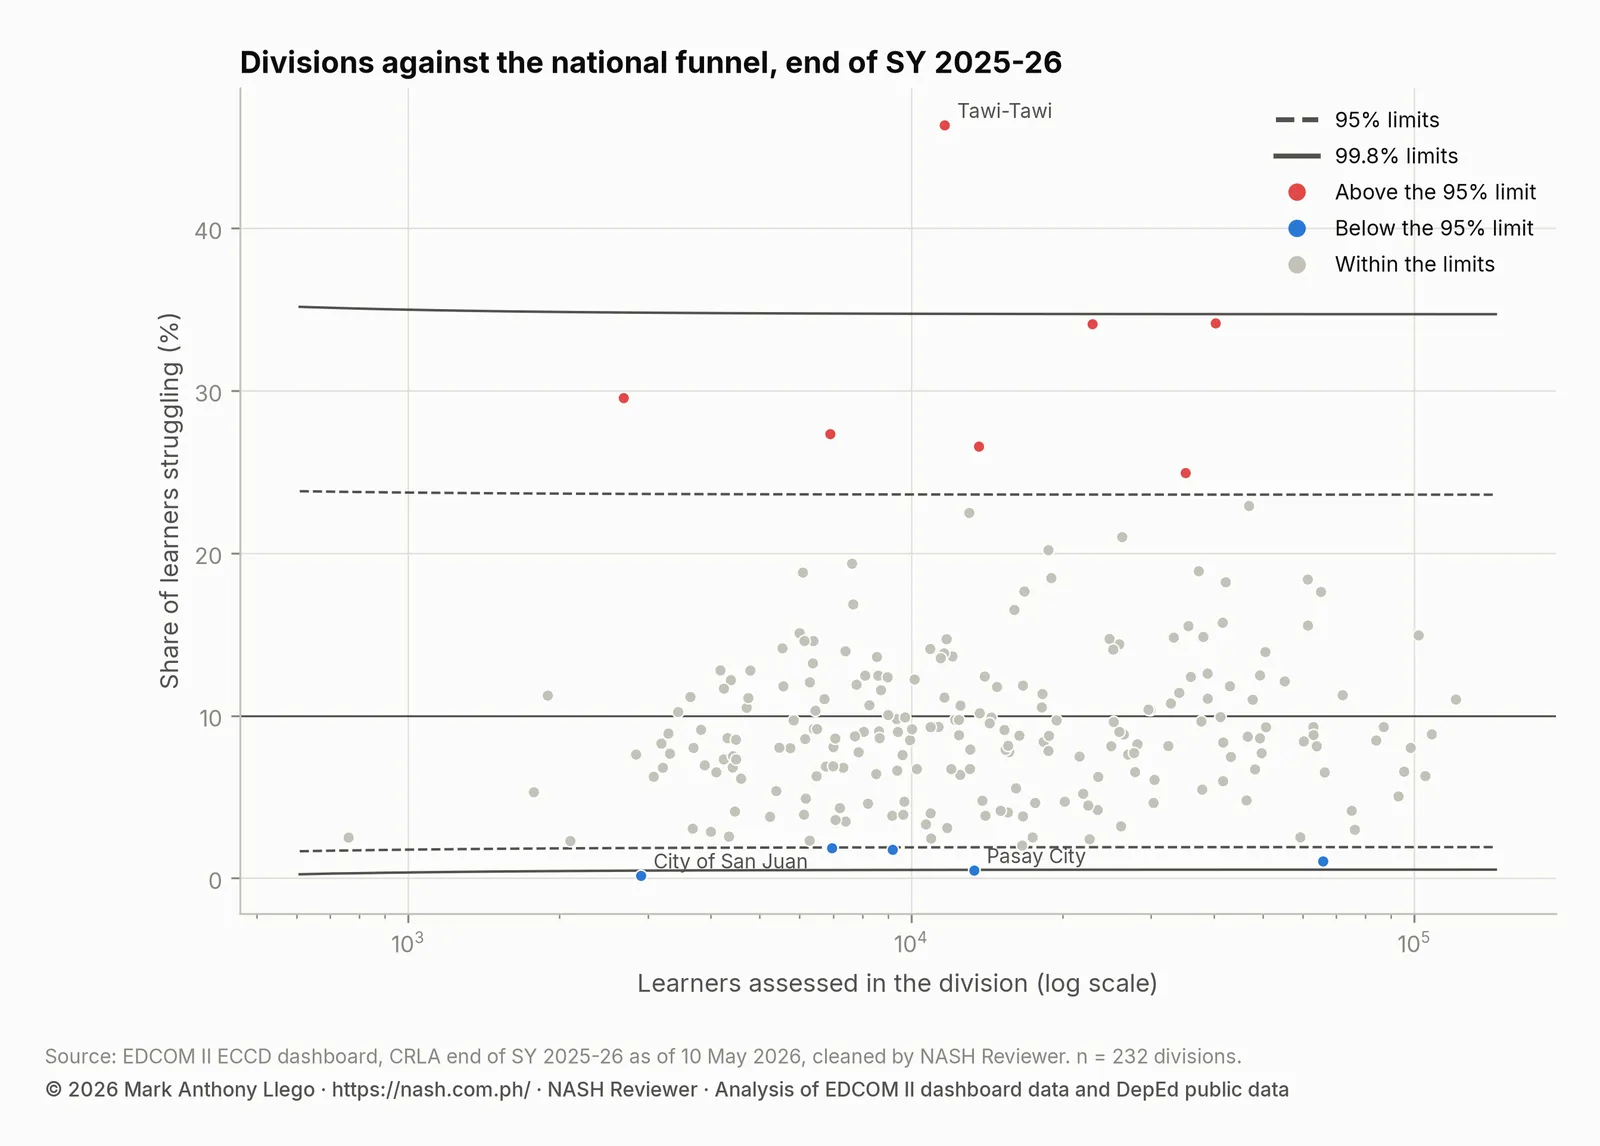
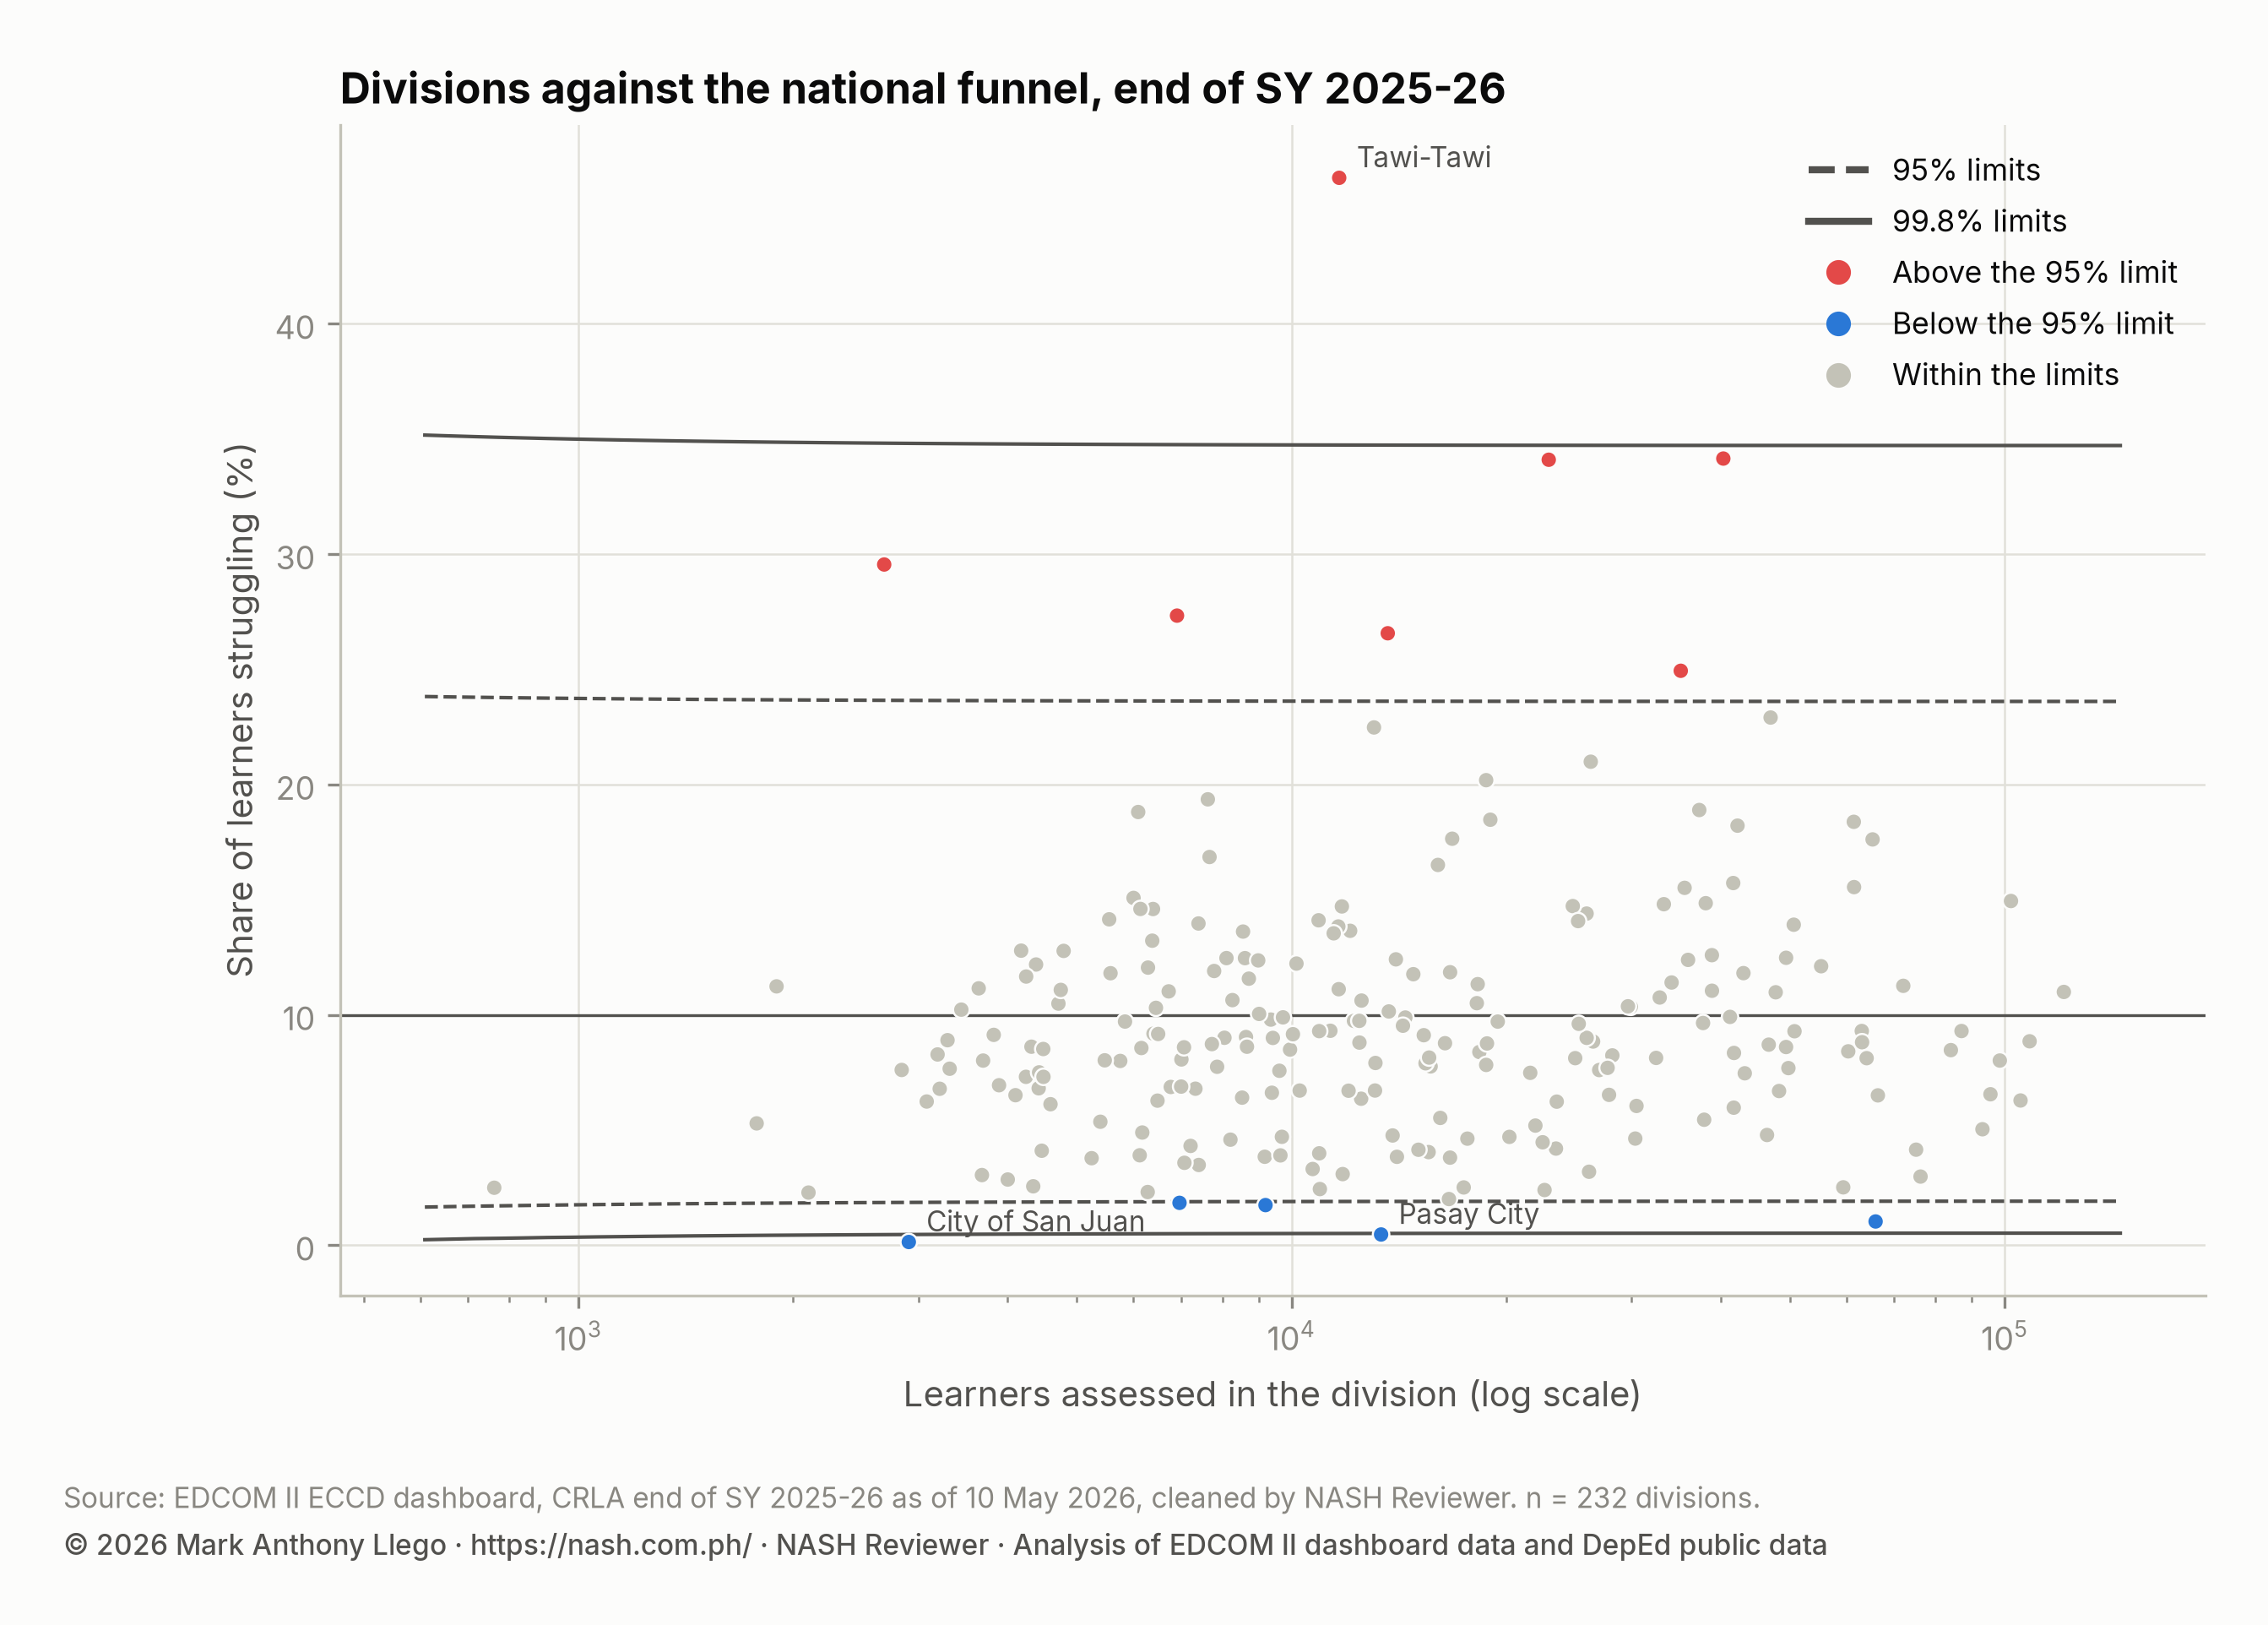
A funnel plot shows each division’s share against the number of learners it assessed, with limits drawn around the national rate. The 95% limits mark the range that most divisions of a given size fall within; the 99.8% limits mark a wider range that only a very unusual division falls outside.
The limits allow for the real spread between divisions, not only for chance, so they stay wide even for the largest divisions. A division outside them is unusual compared with other divisions, not just with the national rate.
Of the 232 divisions, 220 lie within the 95% limits. On the high side, 1 division, Tawi-Tawi, lies above the 99.8% limit, and 6 more lie between the 95% and 99.8% limits. On the low side, 2 divisions, including City of San Juan, lie below the 99.8% limit, and 3 more lie between the two limits.
Above the 95% limit, from the highest share down: Tawi-Tawi, Maguindanao del Norte, Sulu, Special Geographic Area, Lamitan City, Cotabato City, Sarangani. Below it, from the lowest share up: City of San Juan, Pasay City, Caloocan City, Sto. Tomas City, Mt. Province. Sulu is counted in Region IX, following the PSGC. With 232 divisions, about one in twenty would be expected outside the 95% limits even if every division followed the usual spread, so a place outside them is a reason to look closer, not a verdict.
The false discovery rate check
Testing 232 divisions at once raises the chance of false alarms. The Benjamini–Hochberg procedure sets a stricter bar that holds a 5% false discovery rate (q = 0.05): on average, no more than one in twenty of the divisions it flags is expected to be a false alarm. Each division’s test asks how likely a share this far from the national rate would be for a division of its size, given the usual spread between divisions.
On this check, 2 divisions stand out: 1 above the national rate (Tawi-Tawi) and 1 below it (City of San Juan). Once the number of comparisons is allowed for, the data cannot tell the other divisions outside the funnel limits apart from the normal spread between divisions.
The table lists the 12 divisions outside the 95% funnel limits, with each one’s estimate, rank interval, funnel position and FDR result.
| Division | Region | Learners | Share struggling | Estimate (95% interval) | Rank of 232 (95% interval) | Funnel | Flagged at FDR 5% |
|---|---|---|---|---|---|---|---|
| Tawi-Tawi | BARMM | 11,664 | 46.3% | 46.2% (45.3%–47.2%) | 232 (232–232) | above 99.8% limit | yes |
| Maguindanao del Norte | BARMM | 40,320 | 34.1% | 34.1% (33.7%–34.6%) | 231 (230–231) | above 95% limit | no |
| Sulu | Region IX | 22,946 | 34.1% | 34.1% (33.5%–34.7%) | 230 (230–231) | above 95% limit | no |
| Special Geographic Area | BARMM | 2,684 | 29.5% | 29.4% (27.6%–31.1%) | 229 (229–229) | above 95% limit | no |
| Lamitan City | BARMM | 6,909 | 27.3% | 27.3% (26.2%–28.3%) | 228 (227–228) | above 95% limit | no |
| Cotabato City | BARMM | 13,644 | 26.6% | 26.5% (25.8%–27.3%) | 227 (227–228) | above 95% limit | no |
| Sarangani | Region XII | 35,143 | 24.9% | 24.9% (24.5%–25.4%) | 226 (226–226) | above 95% limit | no |
| Mt. Province | CAR | 6,965 | 1.8% | 1.9% (1.6%–2.2%) | 5 (4–7) | below 95% limit | no |
| Sto. Tomas City | Region IV-A | 9,194 | 1.7% | 1.8% (1.5%–2.0%) | 4 (4–6) | below 95% limit | no |
| Caloocan City | NCR | 65,928 | 1.0% | 1.0% (1.0%–1.1%) | 3 (3–3) | below 95% limit | no |
| Pasay City | NCR | 13,354 | 0.5% | 0.5% (0.4%–0.6%) | 2 (2–2) | below 99.8% limit | no |
| City of San Juan | NCR | 2,906 | 0.1% | 0.2% (0.1%–0.4%) | 1 (1–1) | below 99.8% limit | yes |
CRLA Variation: School, Division or Region? splits the variation in reading results between schools, divisions and regions.
Why these results differ from DepEd’s CRLA file
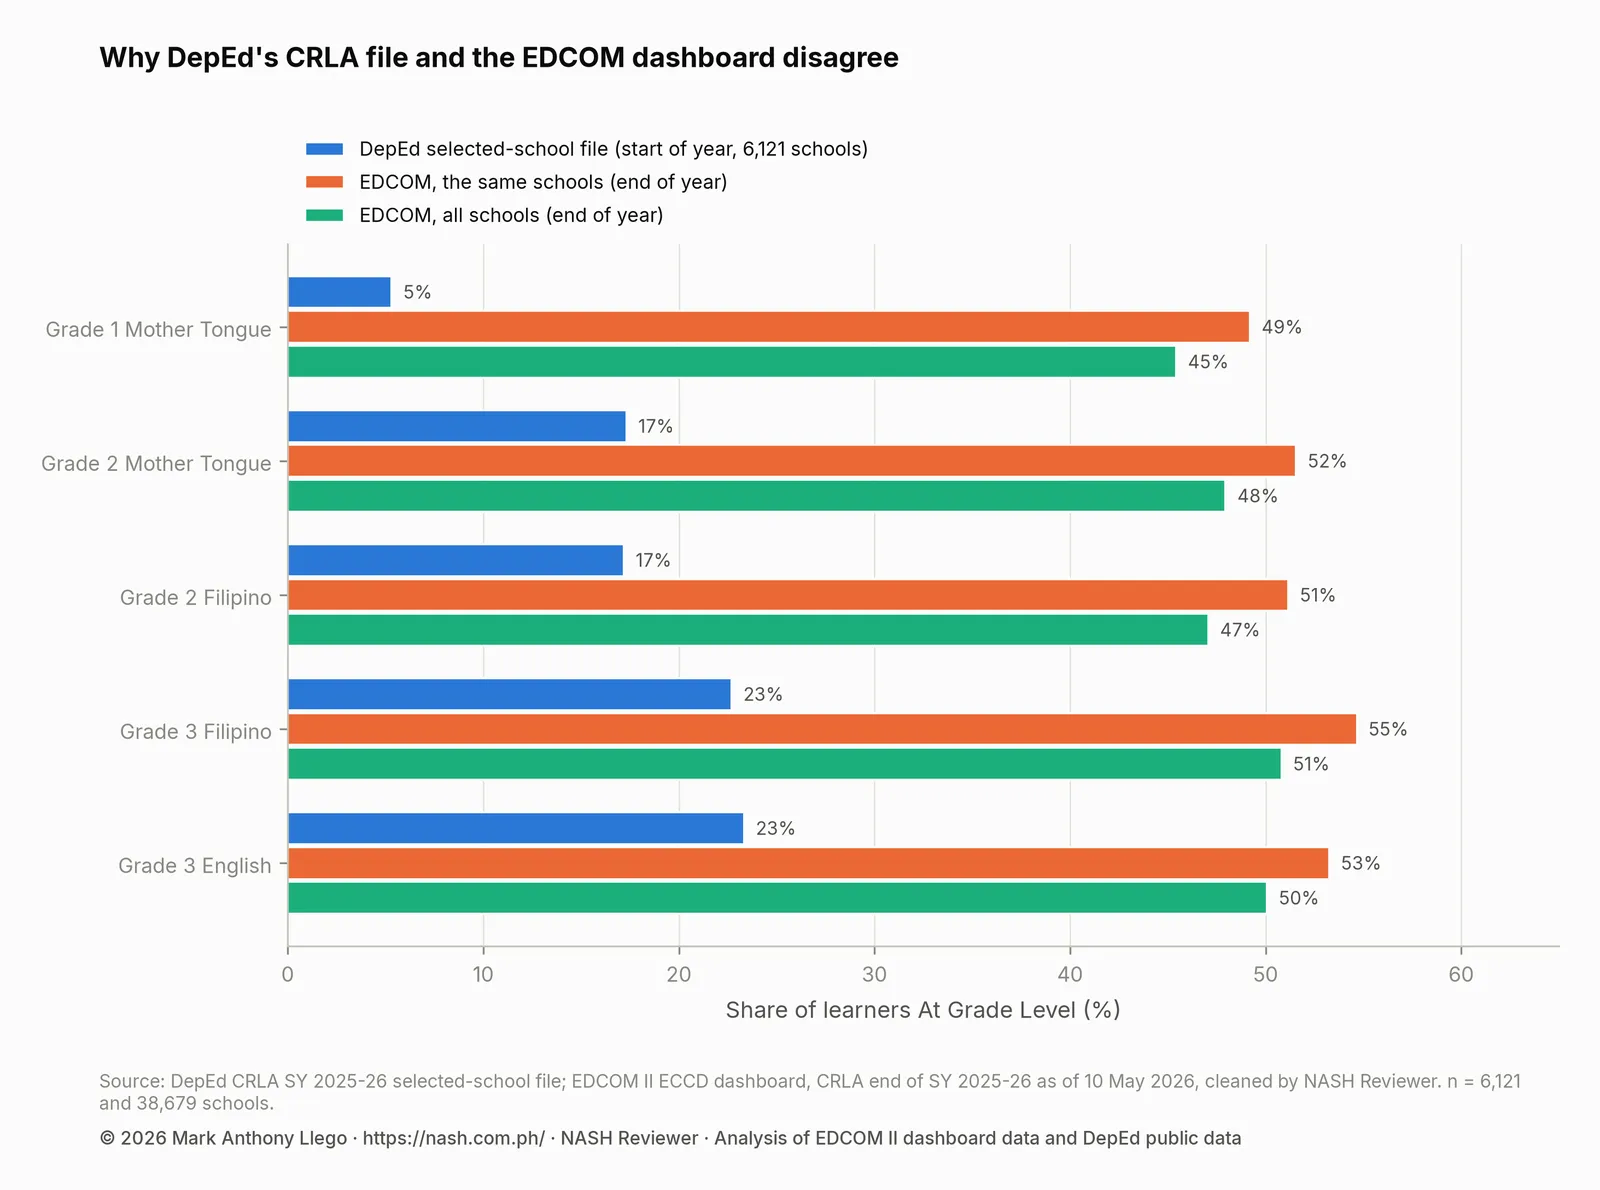
The earlier post CRLA Results SY 2025-2026 used DepEd’s selected-school CRLA file. That file covers 647,681 learners in 6,121 schools. Its headline shares are 15.7% at grade level and 30.3% Low Emerging, far from the end-of-year figures in this post.
The two releases differ mainly in timing. The comparison in CRLA Start vs End of SY 2025-26 in the Same Schools matched the 6,061 schools found in both. Among the 5,980 with Grade 1 Mother Tongue results on the dashboard, 89.5% have Grade 1 Mother Tongue learner counts that agree within ±15%, consistent with the two releases covering the same learners in the same school year. DepEd’s share at grade level is also lower in every grade-and-language block.
That pattern is consistent with DepEd’s file being an earlier round of the same school year. DepEd’s file does not name its round, but DepEd’s download package dates it 28 September 2025, before the mid-year assessment window opened, so the start of the year is the only round it could hold.
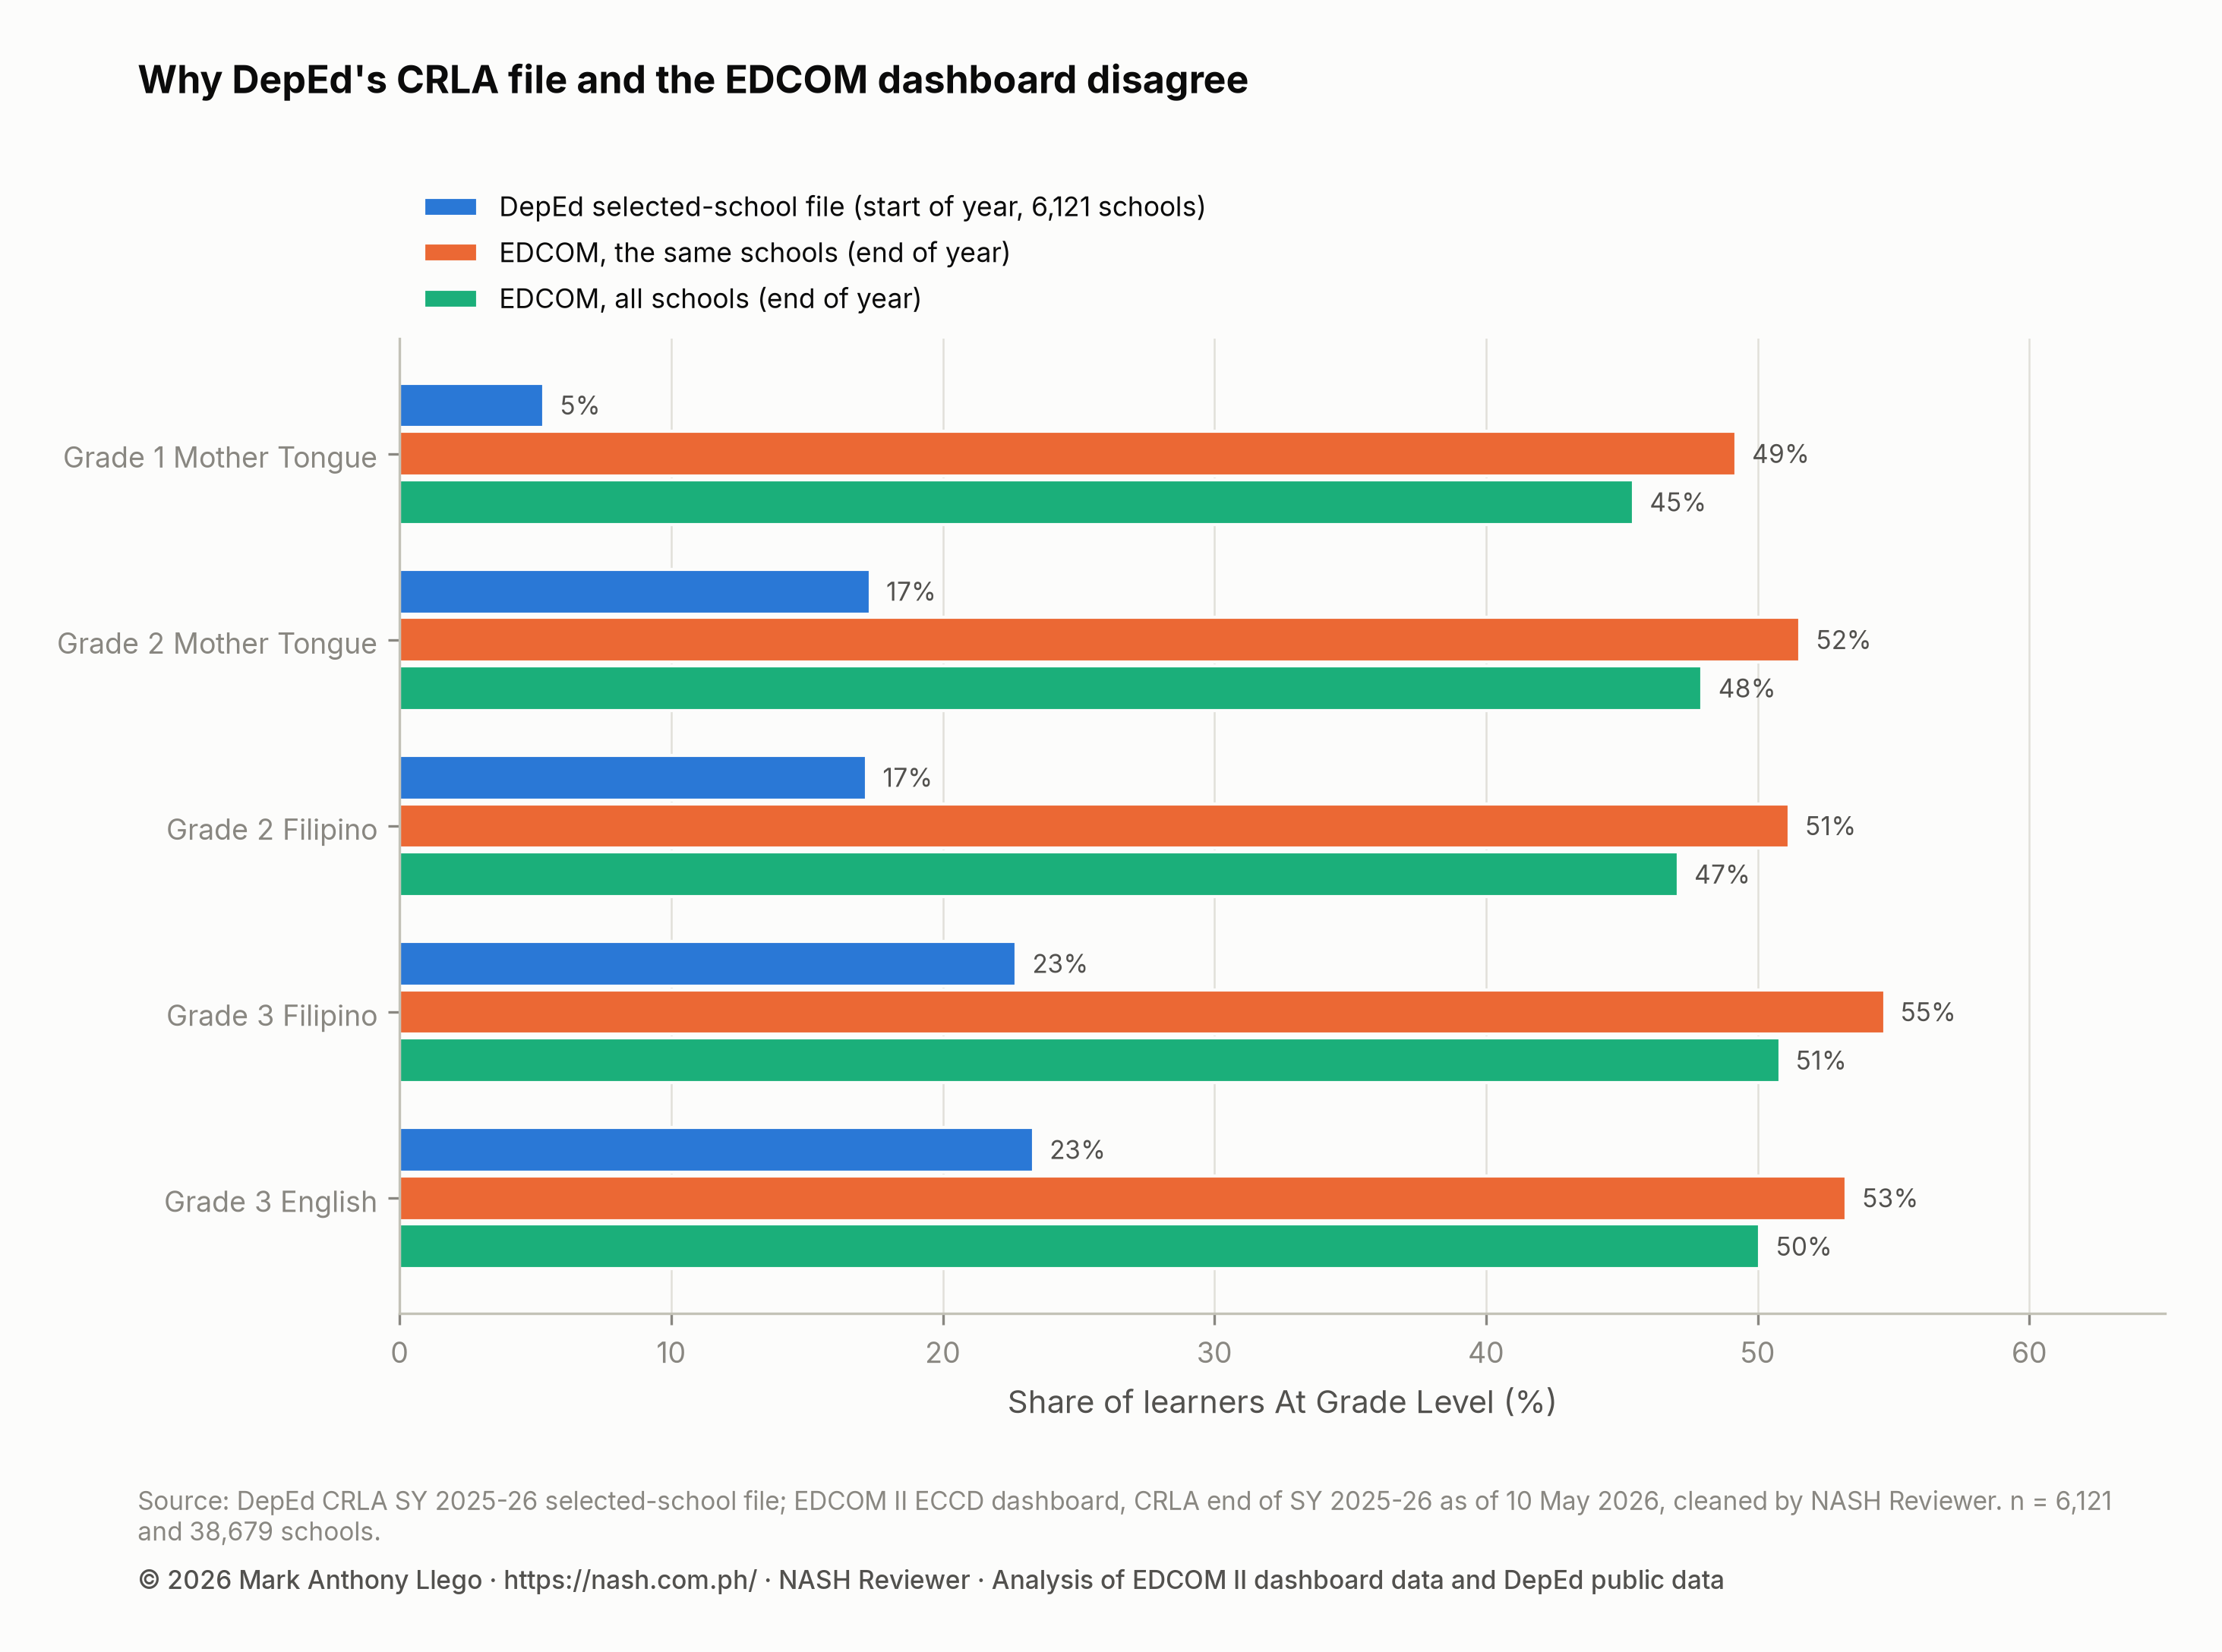
The table compares the share at grade level in three sources: DepEd’s file, the same schools on the EDCOM dashboard at the end of the year, and all EDCOM schools.
| Grade and language | DepEd file, start of year (6,121 schools) | EDCOM, same schools, end of year | EDCOM, all schools, end of year |
|---|---|---|---|
| Grade 1 Mother Tongue | 5.3% | 49.2% | 45.4% |
| Grade 2 Mother Tongue | 17.3% | 51.6% | 47.9% |
| Grade 2 Filipino | 17.2% | 51.2% | 47.1% |
| Grade 3 Filipino | 22.7% | 54.7% | 50.8% |
| Grade 3 English | 23.3% | 53.3% | 50.1% |
In Grade 1 Mother Tongue, 5.3% of learners were at grade level in DepEd’s file, against 49.2% in the same schools at the end of the year. In Grade 3 English, the figures are 23.3% and 53.3%. The gap is widest in Grade 1, as would be expected of a start-of-year round, when many Grade 1 learners are only beginning to read.
School selection plays a smaller part. At the end of the year, the selected schools read a little better than all EDCOM schools, which have 45.4% at grade level in Grade 1 Mother Tongue and 50.1% in Grade 3 English. Neither release is wrong; they measure different points in the school year. Comparing a school’s results across them would mix a start-of-year screen with an end-of-year one.
What this means for school heads
Compare like with like. A start-of-year CRLA and an end-of-year CRLA answer different questions. The first shows where learners begin; the second shows where they stand after a year of teaching. Compare a school’s results with the same round in other schools, never across rounds.
Plan for Grade 1. Grade 1 Mother Tongue has the most struggling readers at the end of the year, 14.4%. Learners who finish Grade 1 at the Emerging levels need a reading plan ready at the start of Grade 2.
Look past the struggling readers. Of all learners, 10.4% are Developing and 32.0% are Transitioning. They are nearer to grade level than the struggling readers, and Transitioning is the largest group below it, so reading plans should cover them as well as the struggling readers.
Count learners, not only rates. A school with a low share of struggling readers can still have many of them if it is large, as Region IV-A shows at the regional level. Planning reading support by the number of learners as well as the rate keeps large schools from being overlooked.
Read ranks with their intervals. A division’s or school’s rank is uncertain, and most cannot be told apart from neighbors a few places away. Use the funnel plot and the FDR check before treating any rank as a verdict, and treat an unusually low or high result first as a reason to check the data.
How these numbers were made
- Source: CRLA results at the end of SY 2025-26 for public schools, from the EDCOM II early-childhood (ECCD) dashboard as of 10 May 2026, cleaned by NASH Reviewer. How the EDCOM Dashboard Data Was Cleaned documents every rule.
- Learners: each learner is counted once in national and regional totals (Grade 1 Mother Tongue + Grade 2 Filipino + Grade 3 English). Struggling readers are Low Emerging plus High Emerging.
- Regions: the 18 regions of the PSGC, with Sulu in Region IX and the Negros Island Region (NIR) as its own region.
- National and regional shares: learners at a level divided by learners assessed. They are population values and have no sampling intervals.
- Divisions: beta-binomial empirical Bayes estimates toward the national rate, with the concentration fitted by maximum likelihood (26.7). The 95% intervals and rank intervals come from 4,000 posterior draws.
- Funnel and FDR: 95% and 99.8% limits from the same beta-binomial model at each division size; two-sided tail probabilities from that model, with Benjamini–Hochberg at q = 0.05.
- Reconciliation: DepEd’s selected-school CRLA file (6,121 schools, available from DepEd) matched to the dashboard by school ID (6,061 schools in both). DepEd’s download package dates its file 28 September 2025, before the mid-year assessment window; the start-of-year label comes from that date and the comparison in CRLA Start vs End of SY 2025-26 in the Same Schools.
Limits
The national and regional shares are near-census population values for the learners whose results were on the dashboard on 10 May 2026. Learners not assessed, or entered later, are not counted, and the dashboard may change after that date.
This post uses no school inputs. Posts in the series that do use them take them from DepEd’s SY 2023-24 files, two school years before the assessment.
Divisions are administrative units that differ in size, geography and the mix of schools they contain. A division’s share describes the place as a whole, not any individual school or child within it.
The round of DepEd’s selected-school file rests on the file’s date and the comparison with the dashboard, because the file does not name it; a file date records when the file was saved, not when learners were assessed. Finally, the CRLA is a teacher-administered screen, and its results depend on how consistently it is given and recorded, which this analysis cannot observe.
Frequently asked questions
What share of Grade 1 to 3 learners are struggling readers at the end of SY 2025-26?
About one learner in 10: 511,753 of the 5,127,670 Grade 1–3 learners assessed in public schools, or 10.0%, are Low Emerging or High Emerging on the CRLA. Another 47.6% read at grade level. The rest are Developing or Transitioning.
Which region has the most struggling readers on the CRLA?
By share, the highest is BARMM (23.4%) and the lowest NCR (5.3%). By number, Region IV-A has the most, 48,777, because it assessed the most learners, even though its rate is below the national share.
Why are the EDCOM CRLA results so different from DepEd’s CRLA file?
Mainly because of timing. In the 6,061 schools found in both, DepEd’s file is consistent with an earlier round of the same school year, most likely the start of the year, while the EDCOM dashboard shows the end of the year. DepEd’s file does not name its round, but its date in DepEd’s package falls before the mid-year assessment window.
Which divisions have the most and the fewest struggling readers?
Tawi-Tawi (BARMM) has the highest estimate, 46.2% (95% interval 45.3% to 47.2%). City of San Juan (NCR) has the lowest, 0.2% (95% interval 0.1% to 0.4%). They are the 2 divisions that stand out at FDR 5%.
Download the data
The cleaned EDCOM II dashboard data behind this series are free to download for personal study; to reuse them, email support@nash.com.ph for written permission first. How the EDCOM Dashboard Data Was Cleaned explains every table and cleaning rule. The files are at data.nash.com.ph: start with the README, then the school table with CRLA results and school inputs (Parquet), the school estimates (CSV), the division estimates (CSV) and the municipal table (CSV). The DepEd school files used for school inputs are described in Download Cleaned DepEd School Data.
Every file, with its rows, columns and checksum, is listed on the EDCOM II CRLA data page. To cite the data: Llego, M. A. (2026). EDCOM II early-childhood dashboard data, cleaned, version 1. NASH Reviewer. https://nash.com.ph/edcom-data
More in this series
- CRLA End-of-Year Results SY 2025-26: All 18 Regions
- CRLA Start vs End of SY 2025-26 in the Same Schools
- CRLA by Language: Mother Tongue, Filipino and English
- How to Read a School’s CRLA Results Fairly
- CRLA Variation: School, Division or Region?
- Where Struggling Readers Are Concentrated
- School Resources and CRLA Reading Results
- CRLA Results in Schools With and Without a Principal
- Action Research and Thesis Topics on Reading (CRLA)
- CRLA Reading Hotspots: A Map of Struggling Readers
- Stunting, Day Care Centers and Early Reading
- Literacy and Nutrition Programs Compared With Need
- CRLA Schools With No Struggling Readers: A Data Check
- How the EDCOM Dashboard Data Was Cleaned
- Regional reports: NCR, CAR, Region I, Region II, Region III, Region IV-A, MIMAROPA, Region V, Region VI, NIR, Region VII, Region VIII, Region IX, Region X, Region XI, Region XII, Caraga, BARMM
- Earlier reports: CRLA Results SY 2025-2026 (DepEd’s selected-school file), Do the Same DepEd Schools Lag on the ELLNA, NAT and CRLA?, DepEd School Inputs vs Test Results, EDCOM II Final Report: Guide for Aspiring School Heads, DepEd Data for Aspiring School Heads: Where to Start
Analysis and charts by Mark Anthony Llego for NASH Reviewer. Data: EDCOM II early-childhood dashboard and Department of Education public datasets. NASH Reviewer is not affiliated with EDCOM II or DepEd. Charts may be reused only with written permission from support@nash.com.ph.