Struggling readers are concentrated in a small share of the Philippines’ public schools. In the Comprehensive Rapid Literacy Assessment (CRLA) at the end of SY 2025-26, 511,753 learners in Grades 1–3 were struggling readers, meaning they read at the Low Emerging or High Emerging level. Half of them are in just 3,475 schools, 9.0% of the 38,679 schools with results. The top 10% of schools by count hold 52.7% of all struggling readers, while 8,543 schools (22.1%) report none.
That concentration matters when support is limited, but how schools are chosen matters as much as how many. In a simulation with support for one thousand schools, picking the schools with the most struggling readers covers 25.4% of them, the most that any thousand schools hold, while picking the schools with the highest share struggling covers only 9.2%, because a list built on rates fills up with small schools.
Key findings
- Half of all struggling readers are in 3,475 schools, 9.0% of the schools with CRLA results, and the top 10% of schools by count (3,868 schools) hold 52.7% of struggling readers but only 33.7% of learners.
- The top 1% of schools (387) hold 14.0% of struggling readers and 7.5% of learners, while 8,543 schools (22.1%) report no struggling readers at all.
- Across divisions, the top 10% (23 of 232 divisions) hold 39.6% of struggling readers and 33 divisions hold half; the five with the most are, in order: Camarines Sur, Maguindanao del Norte, Cebu, North Cotabato, Zamboanga City.
- The Gini index of struggling-reader counts across schools is 0.70, against 0.56 for learners, so part of the concentration is simply school size; with schools ordered by rate, the concentration index is 0.52.
- With support for one thousand schools, choosing by count reaches 25.4% of all struggling readers (the most possible, by construction), by count × rate 21.3%, by empirical Bayes rate 10.6% and by raw rate 9.2%.
- Rate-based lists fill up with small schools: the median school chosen by raw rate has 60 learners assessed, against 588 for the median school chosen by count and 71 for the median school overall.
- BARMM has the most schools in the national top 10% by count, and in NCR nearly half of all schools are in that group even though NCR has the lowest share of struggling readers of any region (5.3%).
Where struggling readers are concentrated among schools
Picture every public school lined up from the one with the most struggling readers to the one with the fewest. The table shows how many schools sit at the front of that line, and what share of the nation’s struggling readers and of its learners they hold.
| Schools ranked by number of struggling readers | Schools | Share of all struggling readers | Share of all learners assessed |
|---|---|---|---|
| Top 1% | 387 | 14.0% | 7.5% |
| Top 5% | 1,934 | 36.9% | 22.9% |
| Top 10% | 3,868 | 52.7% | 33.7% |
| Top 20% | 7,736 | 71.3% | 48.5% |
The front of the line carries far more than its share. The top 10% of schools hold 52.7% of struggling readers, more than half, and the top 20% hold 71.3%. The same schools are also large: the top 10% hold 33.7% of all learners assessed and the top 20% hold 48.5%. Their share of struggling readers is still well above their share of learners, so on average they are both larger and have a higher share of their learners struggling than the rest.
At the other end of the line, 8,543 schools (22.1%) report no struggling readers at all. A zero can be a real result, especially in a small school, or it can reflect how results were recorded. CRLA Schools With No Struggling Readers: A Data Check looks at these schools as a data check, not as a judgment about them.
Which divisions have the most struggling readers
The same pattern holds one level up, though less sharply. Of the 232 divisions, the top 10% by count (23 divisions) hold 39.6% of all struggling readers, and 33 divisions together hold half. The five divisions with the most struggling readers are, in order: Camarines Sur, Maguindanao del Norte, Cebu, North Cotabato, Zamboanga City.
A division’s count reflects its size as well as its reading results, so large divisions rise to the top of any list of counts. Division rates with their intervals are in CRLA End-of-Year Results SY 2025-26: All 18 Regions.
How to read a Lorenz curve and the Gini index
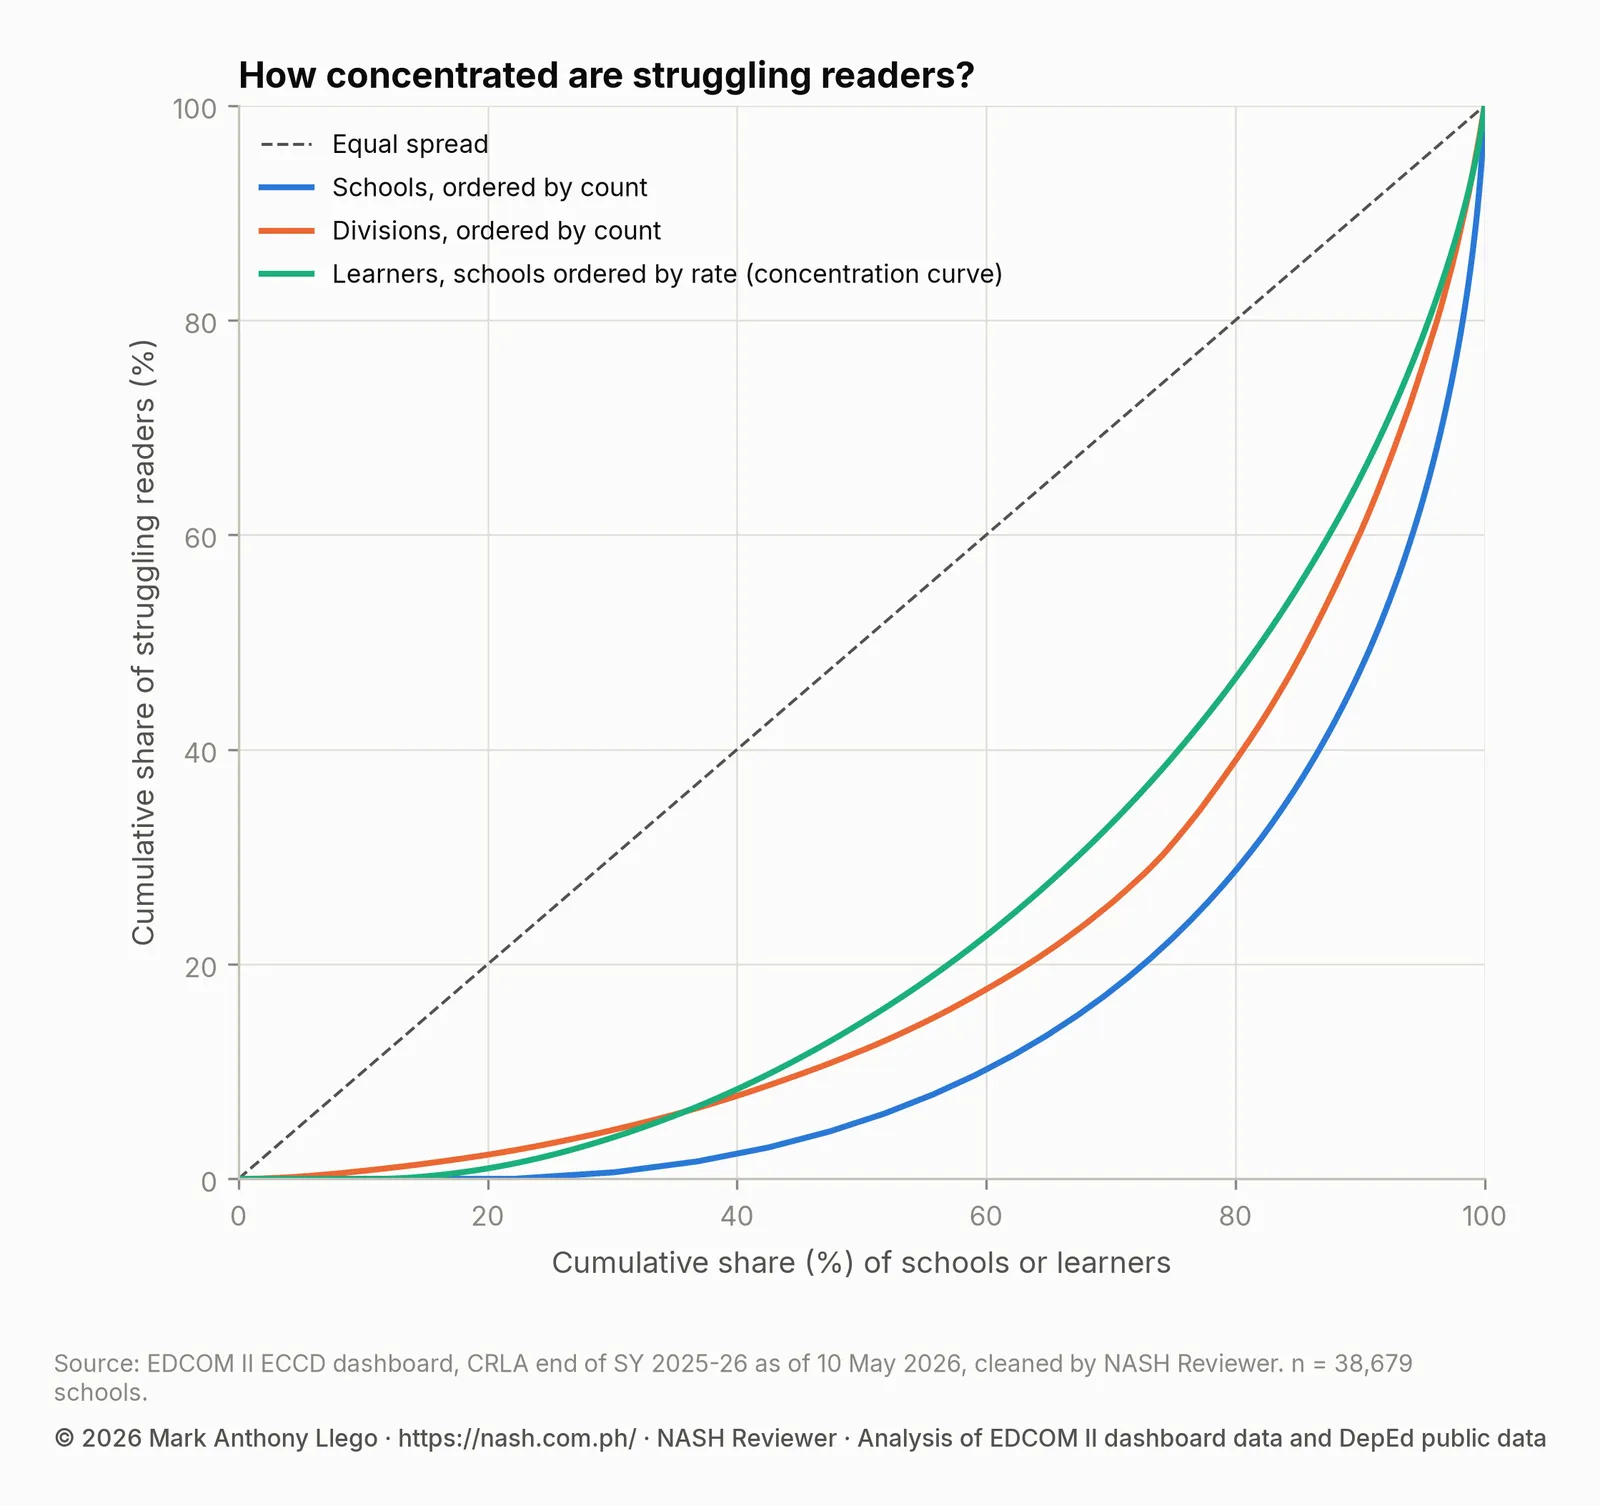
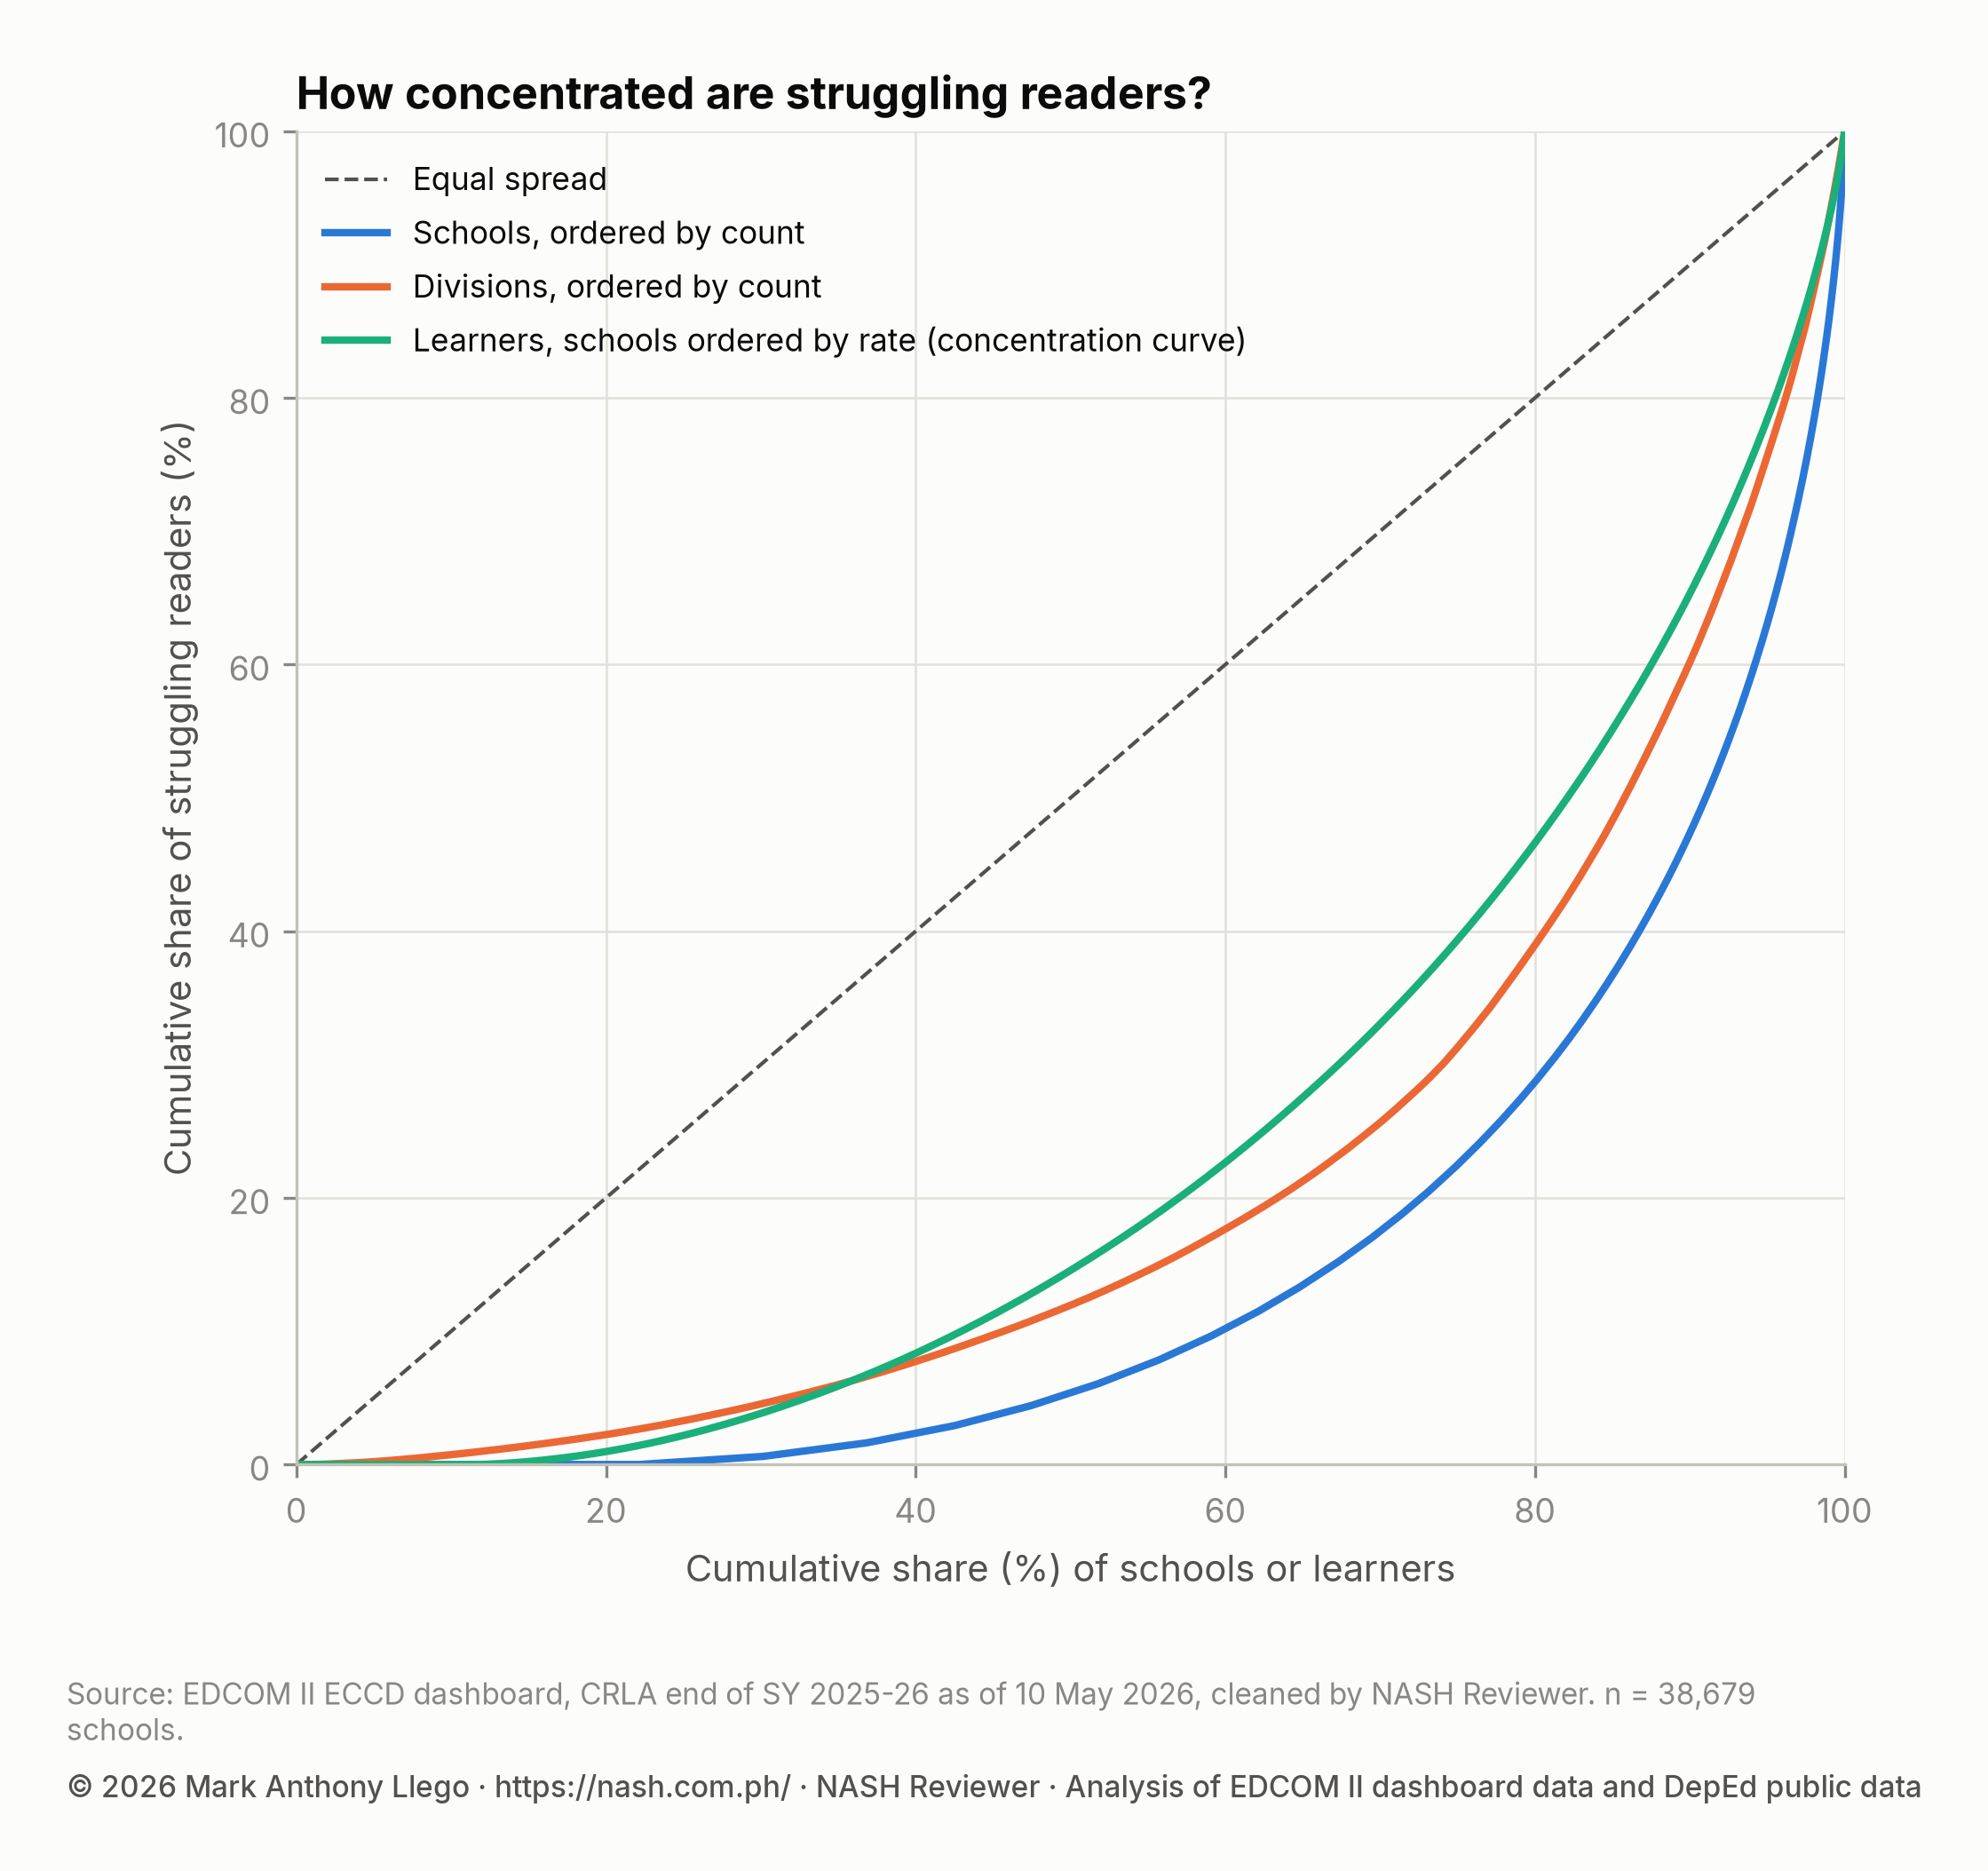
A Lorenz curve is a picture of concentration. Line the schools up from the fewest struggling readers to the most, then walk along the line. At each step, the curve plots the share of schools passed so far (across) against the share of all struggling readers in those schools (up). If every school had the same number of struggling readers, the curve would follow the diagonal: a fifth of the schools would hold a fifth of the readers.
The more concentrated the need, the further the curve sags below the diagonal. The Gini index condenses that sag into one number, from zero (every school has the same count) to one (a single school has every struggling reader). Across schools, the Gini index of struggling-reader counts is 0.70. Across divisions it is 0.57, lower partly because each division pools many schools, so high and low counts even out.
Why school size matters for the Gini index
A Gini index of counts mixes two things: how big schools are and how many of their learners struggle. Learners themselves are spread unevenly across schools: the Gini index of learners across schools is 0.56.
If every school had exactly the same share of struggling readers, counts would be spread exactly like learners, and their Gini index would also be 0.56. The rise from there to 0.70 reflects differences in rates between schools, including the many schools that report none. A high Gini of counts, on its own, does not show that some schools teach reading less well.
The concentration curve: ordering schools by rate
The third line in the chart sets school size aside. It orders schools by their rate, the share of their own learners who are struggling, and moves along learners instead of schools. Its summary, the concentration index, is read on the same scale as a Gini index: zero would mean every school has the same rate. At 0.52, rates differ widely between schools, so struggling readers are clustered among the learners in high-rate schools, even after school size is taken out.
How to target reading support: four ways to choose schools
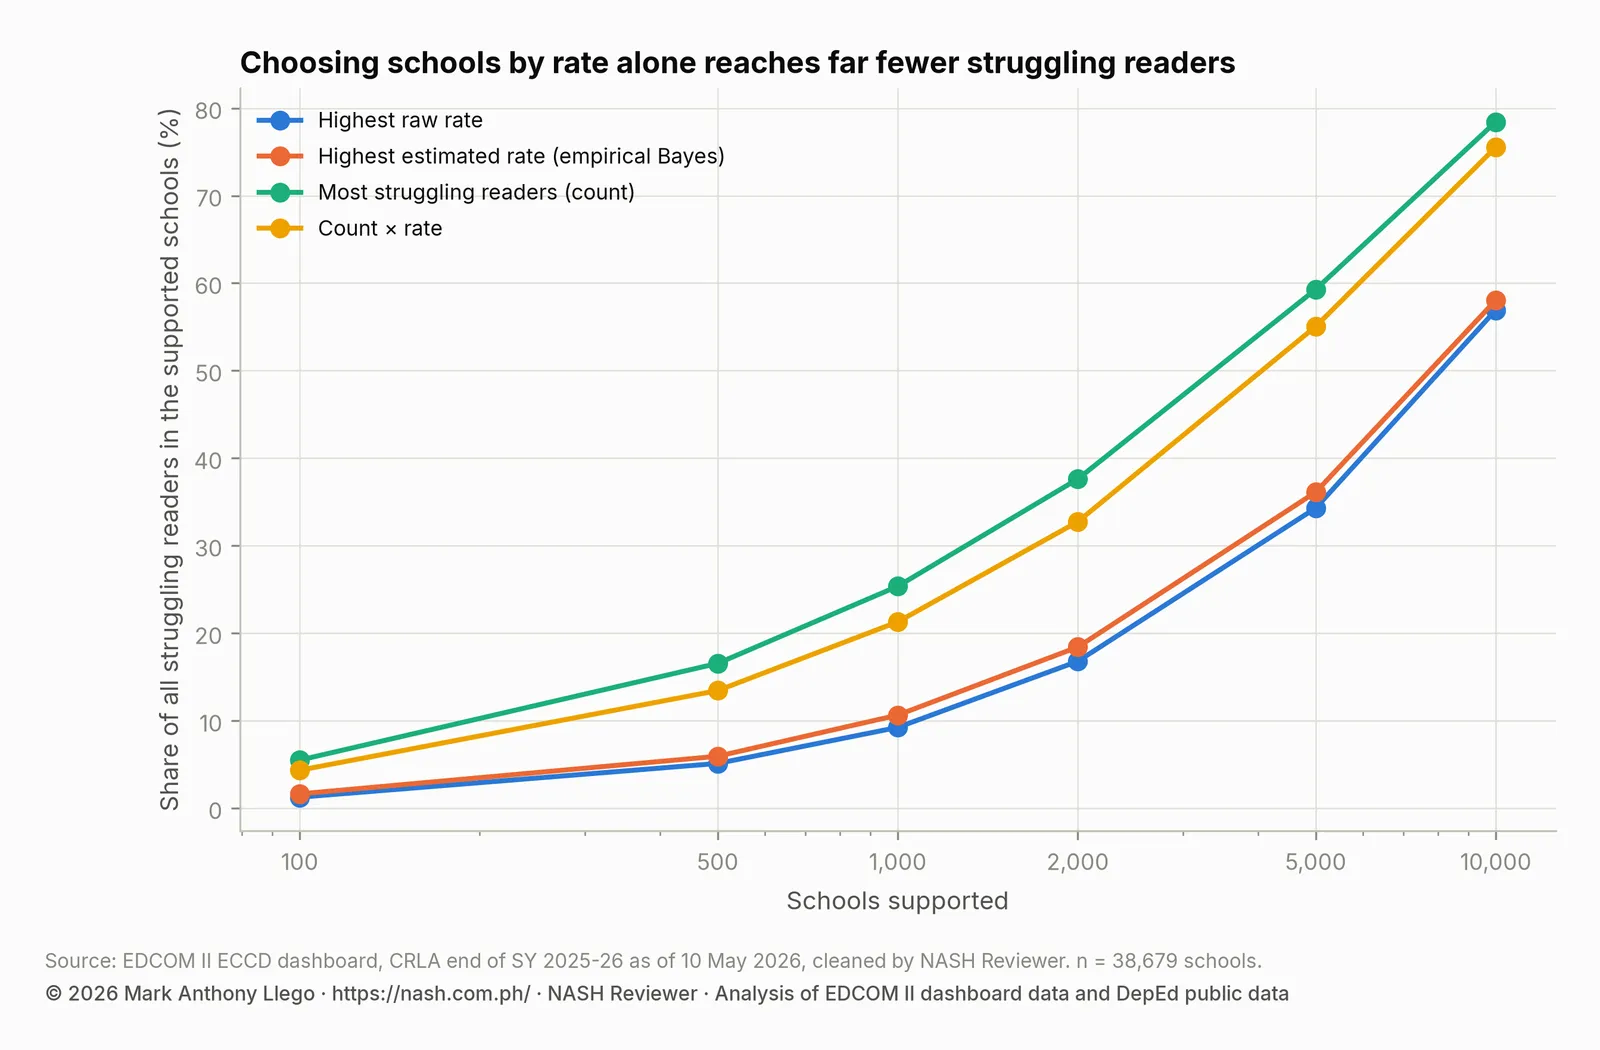
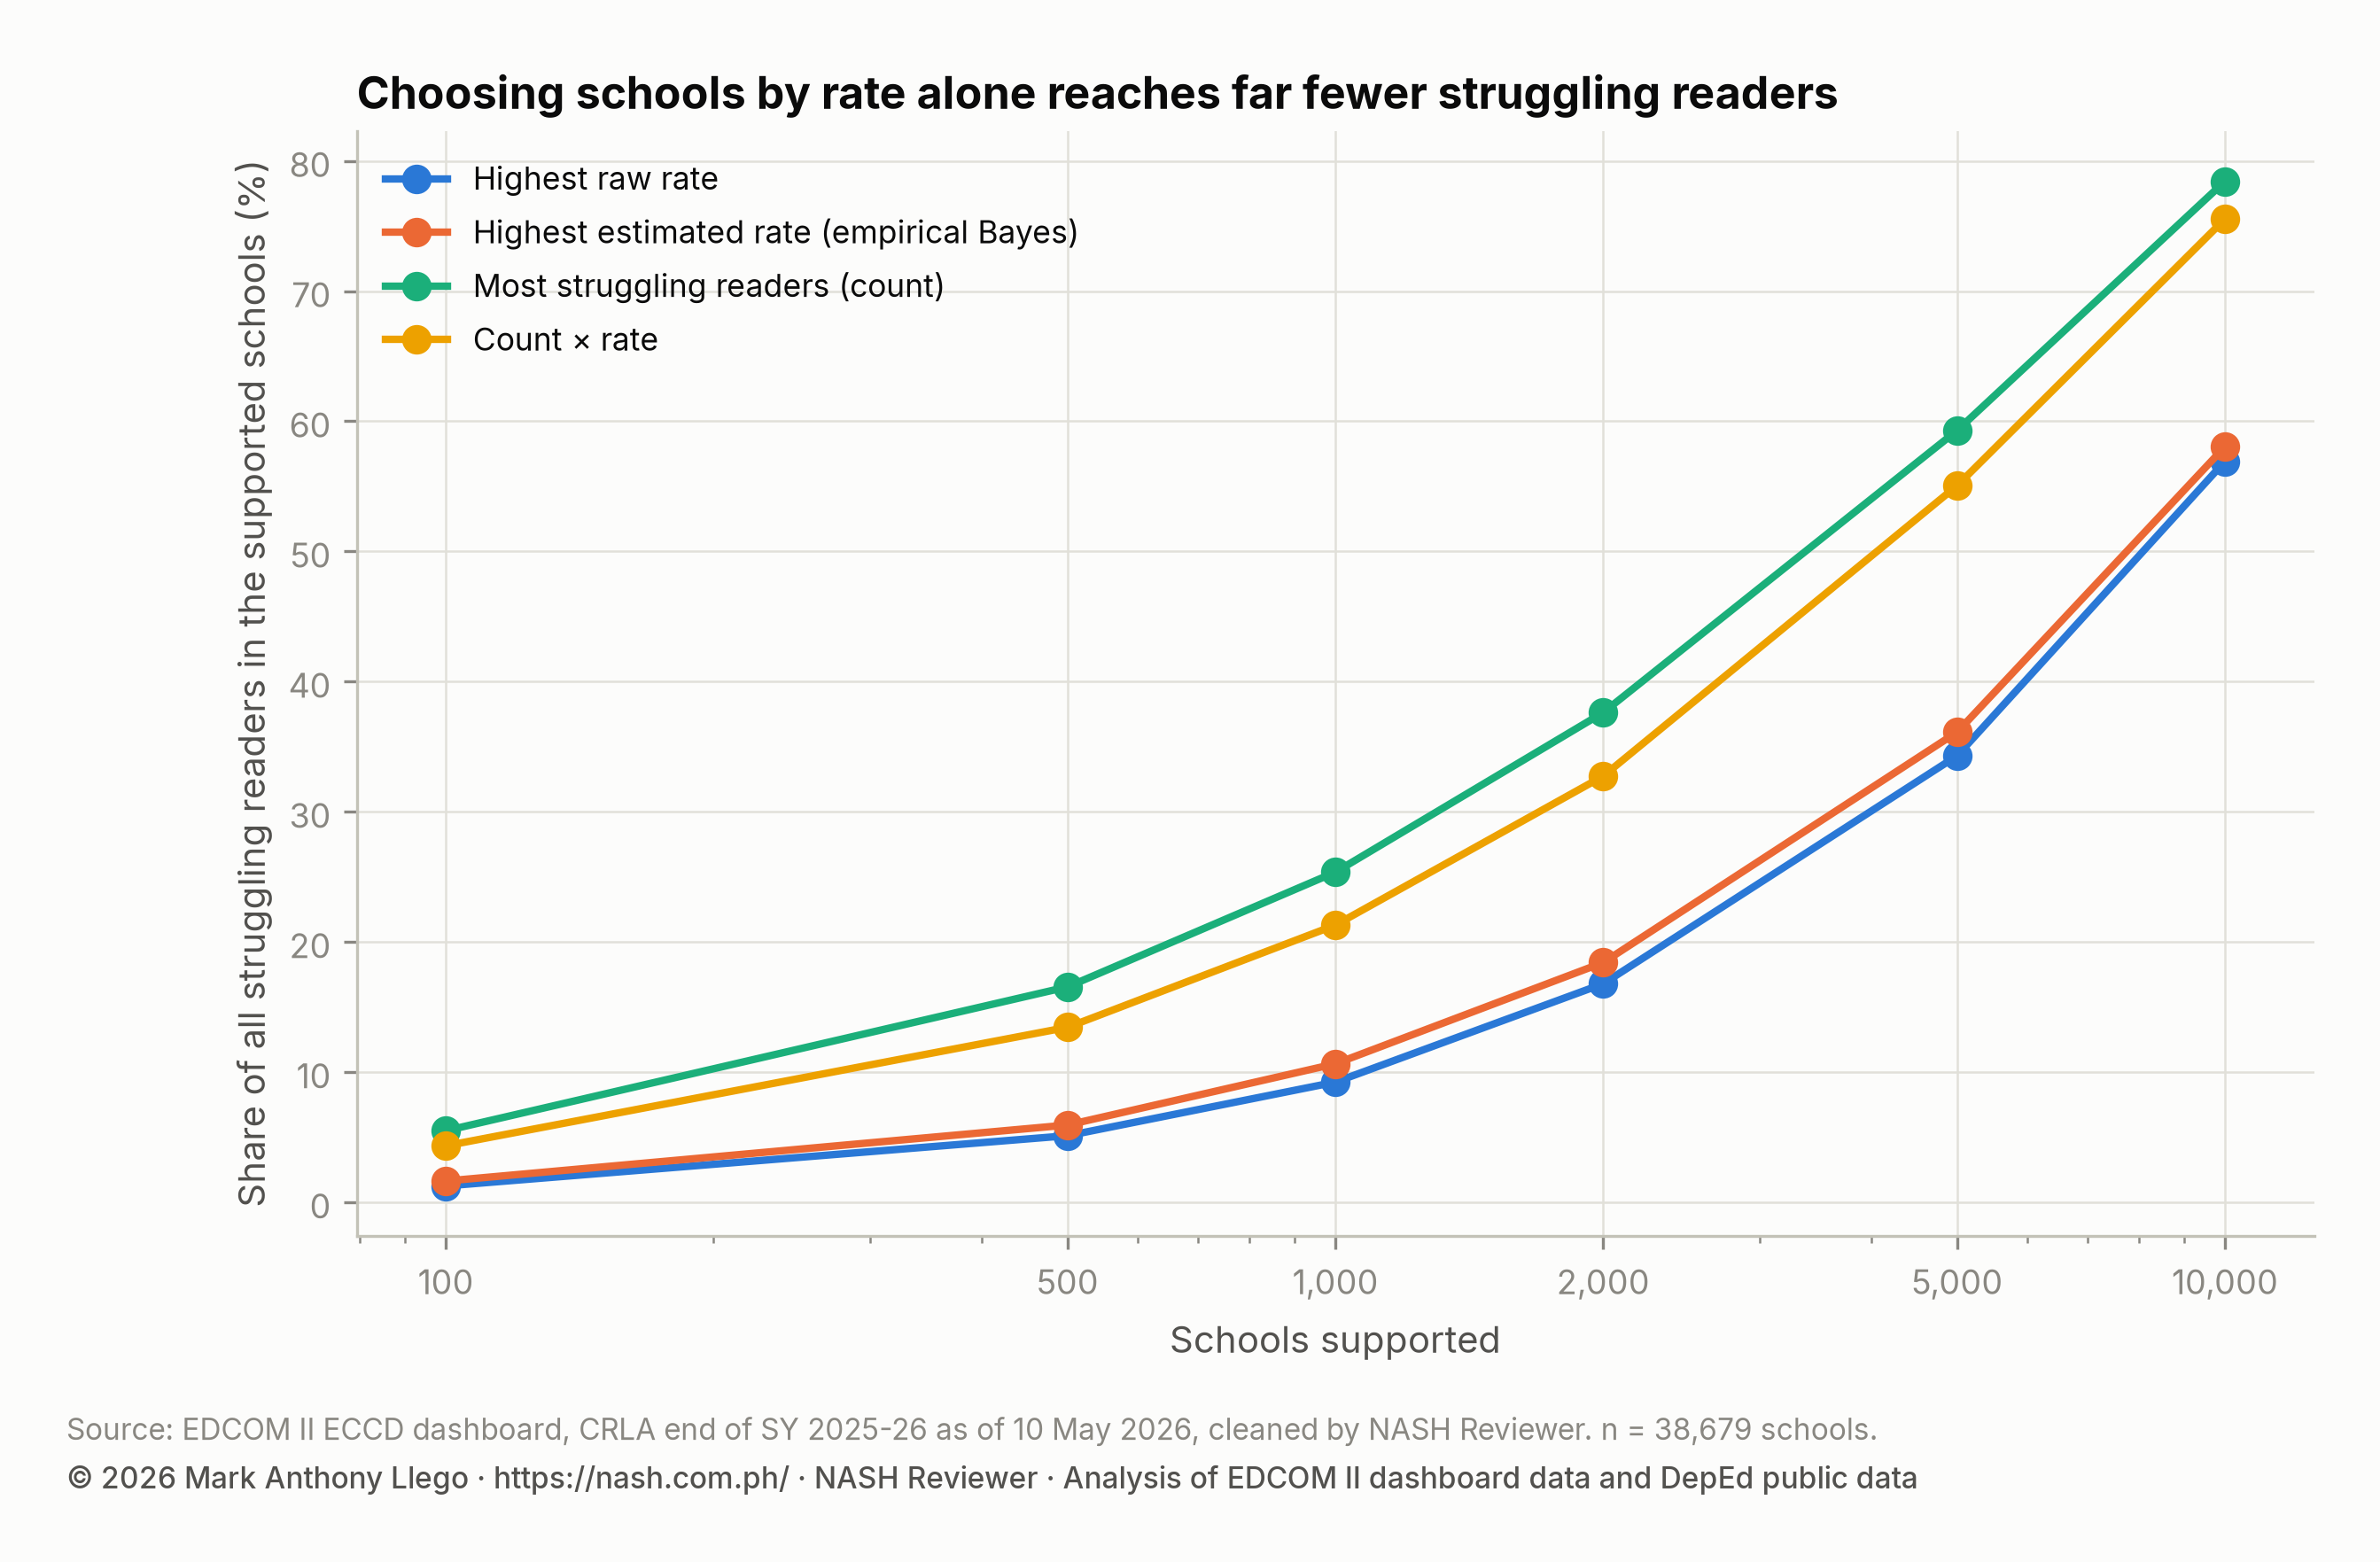
Suppose a division, a region or a national program can support only a fixed number of schools, anywhere from one hundred to ten thousand. The simulation ranks all schools under four rules and takes the top of each list:
- Highest raw rate: the schools with the largest share of struggling readers, as reported.
- Highest estimated rate (empirical Bayes): the same idea, but each school’s rate is first adjusted for how many learners it rests on.
- Most struggling readers (count): the schools with the largest number of struggling readers.
- Count × rate: the number of struggling readers multiplied by the share struggling, which favors schools that have both.
Each rule is scored by one measure: the share of all struggling readers in the country who are in the chosen schools.
A raw rate from a small school is unstable: in a school with five learners assessed, one child more or less moves the rate by a large step. The empirical Bayes estimate pulls each school’s rate toward its region’s overall rate, and pulls hardest when the school has few learners, so that a handful of results cannot by themselves put a school at the top of the list. How to Read a School’s CRLA Results Fairly explains these estimates.
The table shows, for each number of schools supported, how many struggling readers the chosen schools hold under each rule, with the share of the national total in parentheses.
| Schools supported | Highest raw rate | Highest estimated rate (empirical Bayes) | Most struggling readers (count) | Count × rate |
|---|---|---|---|---|
| 100 | 6,440 (1.3%) | 8,362 (1.6%) | 28,144 (5.5%) | 22,219 (4.3%) |
| 500 | 26,183 (5.1%) | 30,383 (5.9%) | 84,695 (16.5%) | 68,796 (13.4%) |
| 1,000 | 47,243 (9.2%) | 54,454 (10.6%) | 129,794 (25.4%) | 108,982 (21.3%) |
| 2,000 | 85,915 (16.8%) | 94,250 (18.4%) | 192,528 (37.6%) | 167,538 (32.7%) |
| 5,000 | 175,577 (34.3%) | 184,879 (36.1%) | 303,456 (59.3%) | 281,781 (55.1%) |
| 10,000 | 291,341 (56.9%) | 297,077 (58.1%) | 401,417 (78.4%) | 386,591 (75.5%) |
Choosing by count is best by construction
The count rule must come out on top, because the score is itself a count: the schools with the most struggling readers are, by definition, the set of that size holding the most struggling readers, so on this year’s data no other list of the same length can beat it. The count line is a ceiling, and the useful comparisons are how close the other rules come to it.
The comparison is also in-sample. Each rule is built and scored on the same year’s results, so the simulation shows how the rules differ on SY 2025-26, not how well any of them would find next year’s struggling readers.
Rate-only lists reach far fewer struggling readers
With support for one thousand schools, the raw-rate rule reaches 9.2% of all struggling readers (47,243 learners), against 25.4% (129,794) for the count rule. The reason is school size. The median school chosen by raw rate has 60 learners assessed, while the median school chosen by count has 588. With one hundred schools the contrast is sharper still: 52 learners against 1,120. A very small school needs only a few struggling readers to post a high rate.
The rate lists do find schools where need is intense. Among all learners in the thousand schools chosen by raw rate, 59.0% are struggling readers, against 17.1% in the schools chosen by count. That is the trade-off: a rate list finds small schools where most children struggle, and a count list finds large schools with many struggling readers alongside many learners who are not struggling.
Empirical Bayes reaches more than raw rates
Adjusting rates for school size helps at every number of schools. With one thousand schools, the empirical Bayes rule reaches 10.6%, against 9.2% for raw rates, and its median school is larger (71 learners). The gain is modest because the estimate still ranks schools by rate, but it is less likely to choose a school on the strength of a few learners’ results.
Count × rate balances reach and intensity
The count × rate rule sits between the two. With one thousand schools it reaches 21.3% of all struggling readers, not far below the count rule’s 25.4%. The share struggling among learners in its chosen schools is 30.6%, well above the count rule’s 17.1%, and its median school has 201 learners assessed. For a program that works with whole schools, that balance means less support is spread over learners who are not struggling.
Which regions have the most high-count schools
The national top 10% of schools by count are not spread evenly across the 18 regions. The table shows how many of each region’s schools are in that group, what share of the region’s schools that is, and how many struggling readers they hold.
| Region | Schools | Schools in the national top 10% by count | Share of the region’s schools | Struggling readers in those schools |
|---|---|---|---|---|
| BARMM | 1,469 | 469 | 31.9% | 39,075 |
| Region IV-A | 2,754 | 398 | 14.5% | 29,300 |
| Region XII | 1,744 | 370 | 21.2% | 26,340 |
| Region III | 3,024 | 319 | 10.5% | 19,665 |
| Region XI | 1,749 | 285 | 16.3% | 17,735 |
| Region V | 3,162 | 285 | 9.0% | 14,972 |
| Region IX | 2,310 | 257 | 11.1% | 22,307 |
| NCR | 520 | 256 | 49.2% | 21,821 |
| Region VII | 2,189 | 255 | 11.6% | 23,080 |
| NIR | 1,742 | 206 | 11.8% | 11,576 |
| Region X | 2,176 | 195 | 9.0% | 12,231 |
| MIMAROPA | 1,924 | 144 | 7.5% | 8,238 |
| Region I | 2,409 | 120 | 5.0% | 5,961 |
| Caraga | 1,706 | 87 | 5.1% | 4,287 |
| Region VI | 2,433 | 76 | 3.1% | 5,096 |
| Region VIII | 3,656 | 73 | 2.0% | 4,394 |
| Region II | 2,212 | 52 | 2.4% | 2,397 |
| CAR | 1,500 | 21 | 1.4% | 988 |
BARMM has the most schools in the group, and a larger share of its schools are in it than in any region except NCR. BARMM also has the highest share of struggling readers of any region, 23.4%. Region XII, with the second-highest share (17.7%), is third by number of schools in the group.
Region IV-A comes second for a different reason. Its share struggling is low (6.7%), but it has more learners than any other region (724,571). NCR shows the same effect more strongly: its share of struggling readers, 5.3%, is among the lowest of any region, yet nearly half of its schools are in the national top 10%, because its 469,125 learners attend comparatively few, large schools.
At the other end, Region VIII has more schools than any other region but few in the group, and CAR has the fewest. Both have many schools for their number of learners, and small schools rarely reach a high count even when their rate is high. These are statements about places and schools, not individual children: a struggling reader in a small school in CAR needs the same help as one in a large school in NCR. CRLA Reading Hotspots: A Map of Struggling Readers maps where high rates cluster.
What this means for school heads and division planners
Combine counts and rates. A count shows where the most learners needing help are; a rate shows where need is most intense. A shortlist built only on rates will be dominated by small schools, and one built only on counts by large schools where most learners are not struggling. Ranking by count × rate, or reading the two lists side by side, gives a fairer picture than either alone.
Small schools with high rates still matter for equity. They add little to national totals, so a rule that maximizes the number of children reached will pass them by, yet the children in them need help just as much. Planners can reach them in other ways, such as district-level coaching or shared materials, rather than leaving them off the list.
Read rates with intervals. A school’s rate from a few dozen learners can swing widely by chance alone. Estimates that adjust for school size, with 95% intervals, show which high rates are clearly high and which the data cannot tell apart from the regional rate.
For a school head, the same logic applies inside one school. In a large school, even a modest share struggling means many children, enough for regular small-group sessions. In a small school, a high share may mean a few children who each need an individual plan.
How these numbers were made
The data are the CRLA results at the end of SY 2025-26, as of 10 May 2026, from the EDCOM II early-childhood (ECCD) dashboard, for public schools. Each learner is counted once (Grade 1 Mother Tongue, Grade 2 Filipino and Grade 3 English), and struggling readers are those at Low Emerging or High Emerging. The analysis covers 38,679 schools with at least one learner assessed, 5,127,670 learners and 511,753 struggling readers (10.0%). Regions follow the 18 regions of the Philippine Standard Geographic Code (PSGC), with Sulu in Region IX and the Negros Island Region (NIR) as its own region.
For the concentration figures, schools are ranked by their number of struggling readers, and the number of schools for half is the smallest number of top-ranked schools whose struggling readers add up to half the national total. The Gini index is one minus twice the area under the Lorenz curve. The concentration index orders schools by raw rate and moves along learners.
The targeting simulation ranks schools under each rule, breaks ties in favor of the larger school, and takes the top of the list for six numbers of schools. The empirical Bayes rate uses each school’s region as the reference group, with the strength of the pull estimated from the spread of school rates in that region. School size here means learners assessed, not enrollment.
Limits
The analysis uses one year. Concentration can shift from year to year, and the simulation is an in-sample comparison of rules, not a forecast.
Counts depend on enrollment and on how many learners were assessed: large schools rise to the top of count lists whatever their rate, and a school that assessed only some of its learners shows a smaller count than its true need.
The share struggling ignores Developing readers. Another 532,502 learners (10.4%) read at the Developing level, a group slightly larger than the struggling readers. A school with many Developing readers but few struggling ones does not rank high here, though its learners also need support.
Each learner is counted in one language per grade, so a learner struggling only in a language not counted is left out. The figures describe schools and places, not individual children, and show where need sits, not why.
Frequently asked questions
How concentrated are struggling readers in Philippine public schools?
Highly concentrated. Half of all struggling readers in Grades 1–3 are in 9.0% of public schools with CRLA results, and the top 10% of schools by count hold 52.7%. Part of this is school size: those schools also hold 33.7% of learners.
What does the Gini index mean for school data?
The Gini index summarizes how unevenly something is spread across schools, from zero (all equal) to one (one school has everything). For struggling-reader counts it is 0.70, but learners themselves have a Gini of 0.56, so part of that figure is school size.
Should reading support go to schools with the highest share of struggling readers?
Not by rate alone. With support for one thousand schools, choosing by raw rate reaches 9.2% of all struggling readers, against 21.3% by count × rate, because rate lists fill with small schools. Rates still matter for equity, so combine counts and rates and read rates with their intervals.
Which divisions have the most struggling readers in the CRLA?
The five divisions with the most struggling readers are, in order: Camarines Sur, Maguindanao del Norte, Cebu, North Cotabato, Zamboanga City. The top 10% of divisions by count hold 39.6% of all struggling readers. A high count often reflects a large division, so read its share struggling alongside it.
Why do so many schools report no struggling readers?
In all, 8,543 schools (22.1%) report none. Some may be genuine results and some may reflect how results were recorded. CRLA Schools With No Struggling Readers: A Data Check examines them as a data check.
Download the data
The cleaned EDCOM II dashboard data behind this series are free to download for personal study; to reuse them, email support@nash.com.ph for written permission first. How the EDCOM Dashboard Data Was Cleaned explains every table and cleaning rule. The files are at data.nash.com.ph: start with the README, then the school table with CRLA results and school inputs (Parquet), the school estimates (CSV), the division estimates (CSV) and the municipal table (CSV). The DepEd school files used for school inputs are described in Download Cleaned DepEd School Data.
Every file, with its rows, columns and checksum, is listed on the EDCOM II CRLA data page. To cite the data: Llego, M. A. (2026). EDCOM II early-childhood dashboard data, cleaned, version 1. NASH Reviewer. https://nash.com.ph/edcom-data
More in this series
- CRLA End-of-Year Results SY 2025-26: All 18 Regions
- CRLA Start vs End of SY 2025-26 in the Same Schools
- CRLA by Language: Mother Tongue, Filipino and English
- How to Read a School’s CRLA Results Fairly
- CRLA Variation: School, Division or Region?
- Where Struggling Readers Are Concentrated
- School Resources and CRLA Reading Results
- CRLA Results in Schools With and Without a Principal
- Action Research and Thesis Topics on Reading (CRLA)
- CRLA Reading Hotspots: A Map of Struggling Readers
- Stunting, Day Care Centers and Early Reading
- Literacy and Nutrition Programs Compared With Need
- CRLA Schools With No Struggling Readers: A Data Check
- How the EDCOM Dashboard Data Was Cleaned
- Regional reports: NCR, CAR, Region I, Region II, Region III, Region IV-A, MIMAROPA, Region V, Region VI, NIR, Region VII, Region VIII, Region IX, Region X, Region XI, Region XII, Caraga, BARMM
- Earlier reports: CRLA Results SY 2025-2026 (DepEd’s selected-school file), Do the Same DepEd Schools Lag on the ELLNA, NAT and CRLA?, DepEd School Inputs vs Test Results, EDCOM II Final Report: Guide for Aspiring School Heads, DepEd Data for Aspiring School Heads: Where to Start
Analysis and charts by Mark Anthony Llego for NASH Reviewer. Data: EDCOM II early-childhood dashboard and Department of Education public datasets. NASH Reviewer is not affiliated with EDCOM II or DepEd. Charts may be reused only with written permission from support@nash.com.ph.