In the CRLA results for SY 2025-26, the Cordillera Administrative Region (CAR) has one of the smallest shares of struggling readers in the country. The Comprehensive Rapid Literacy Assessment (CRLA) is DepEd’s early-grade reading screen, and a struggling reader is a learner at its two lowest levels, Low Emerging or High Emerging. By the end of the year, 4,112 of CAR’s 75,844 assessed Grade 1–3 learners, or 5.4%, were struggling readers, against 10.0% nationally; 55.8% read at grade level, against 47.6%. On that share its rank is 2 of the 18 regions, behind only NCR.
Two things set the Cordillera apart. Its schools are small and often multigrade: 1,500 schools with results share those learners, and 40.2% offered multigrade classes in SY 2023-24, against 15.3% nationally. And the low regional share hides a wide spread, from Mt. Province (1.8%) to Abra (9.0%) by division, with every one of the five places with the highest estimated shares in Abra.
Key findings
- 5.4% of CAR’s learners are struggling readers, against 10.0% nationally, and the region holds 0.8% of the country’s struggling readers.
- Every grade-and-language block in CAR beats the national share at grade level; the lead is widest in Grade 3 English (+13.1 points), with 63.1% at grade level, and narrowest in Grade 2 Mother Tongue (+3.7 points).
- Abra (9.0%) has the highest division share, and Mt. Province lies below the national funnel limits.
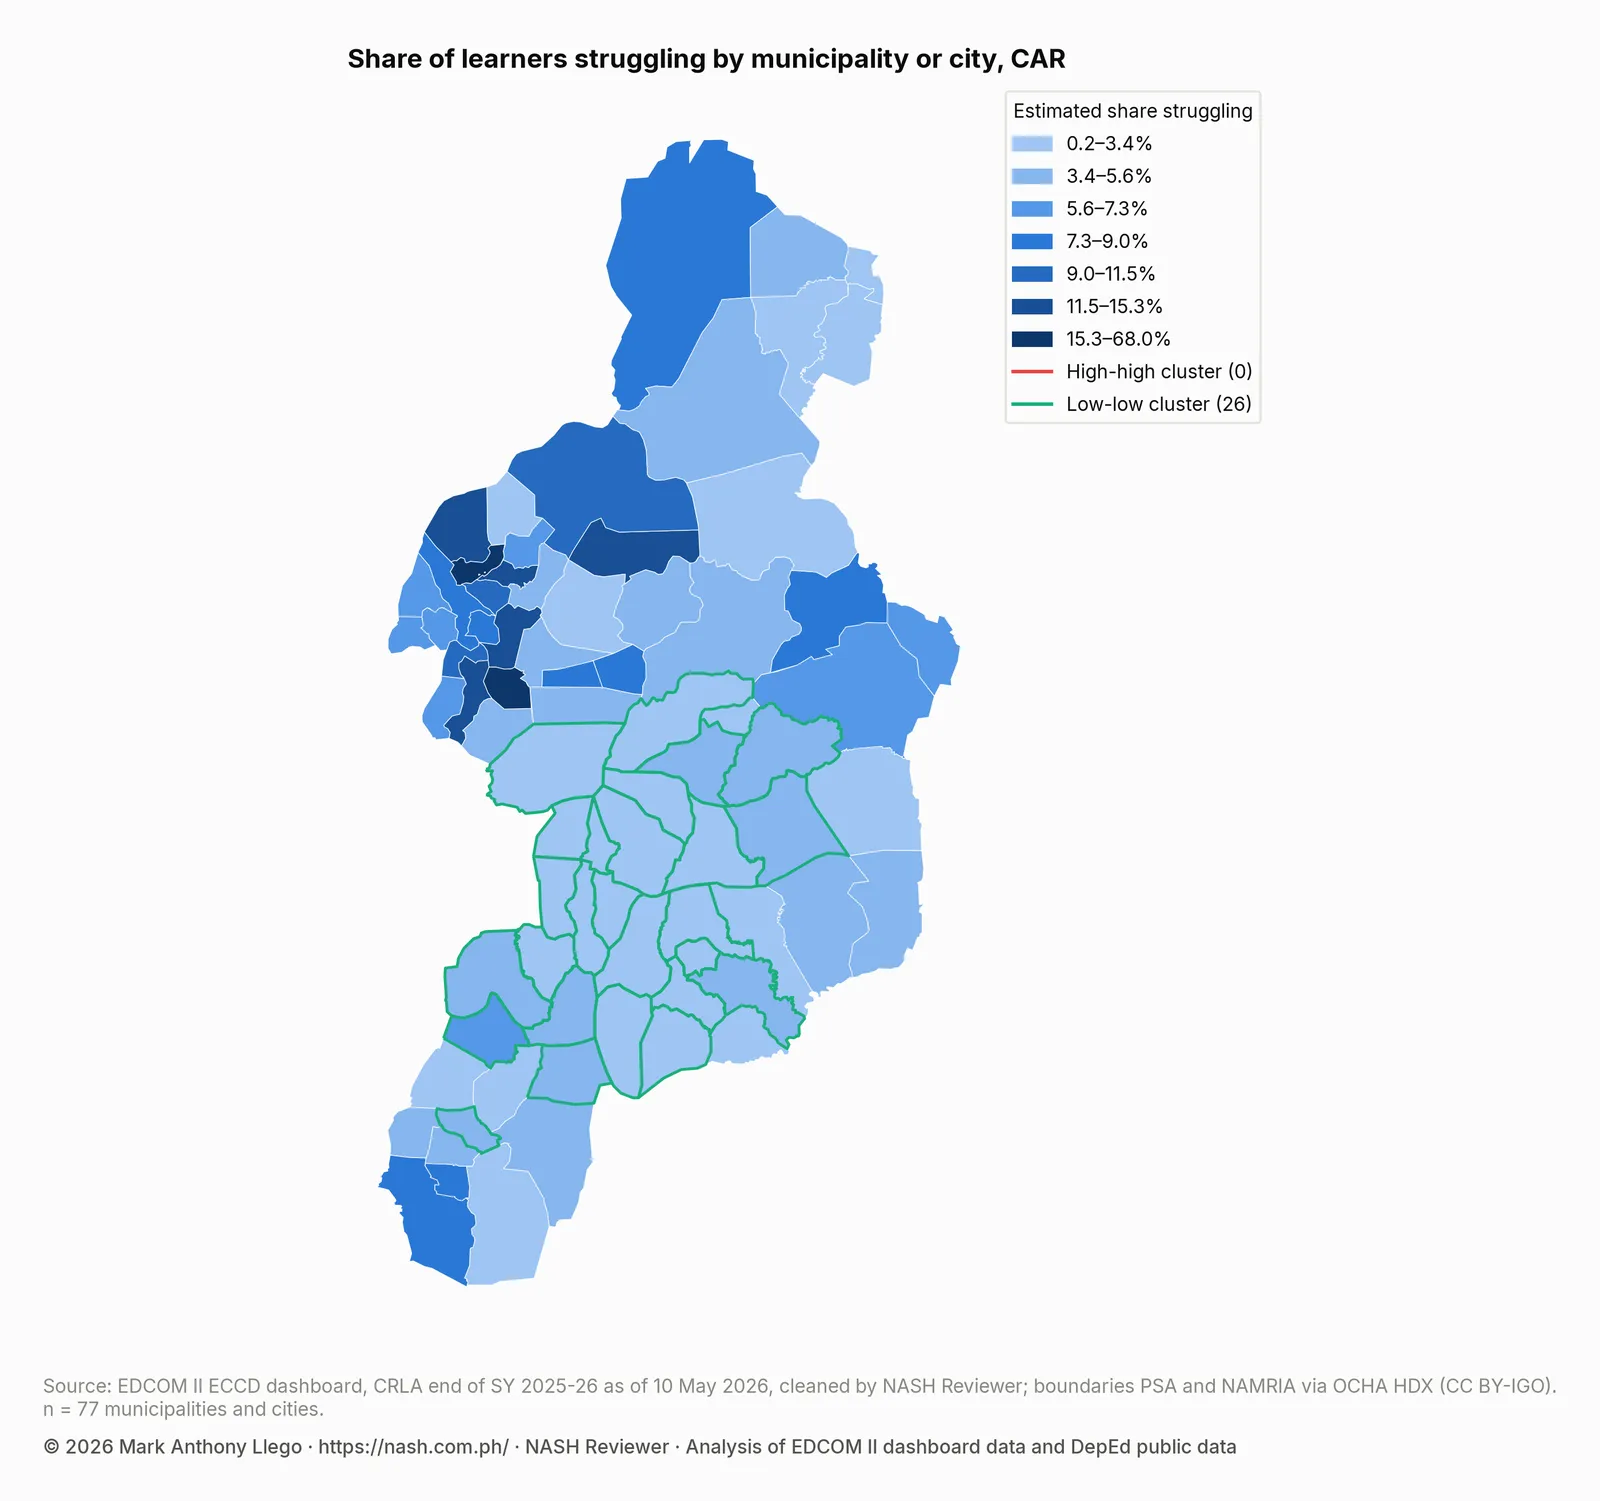
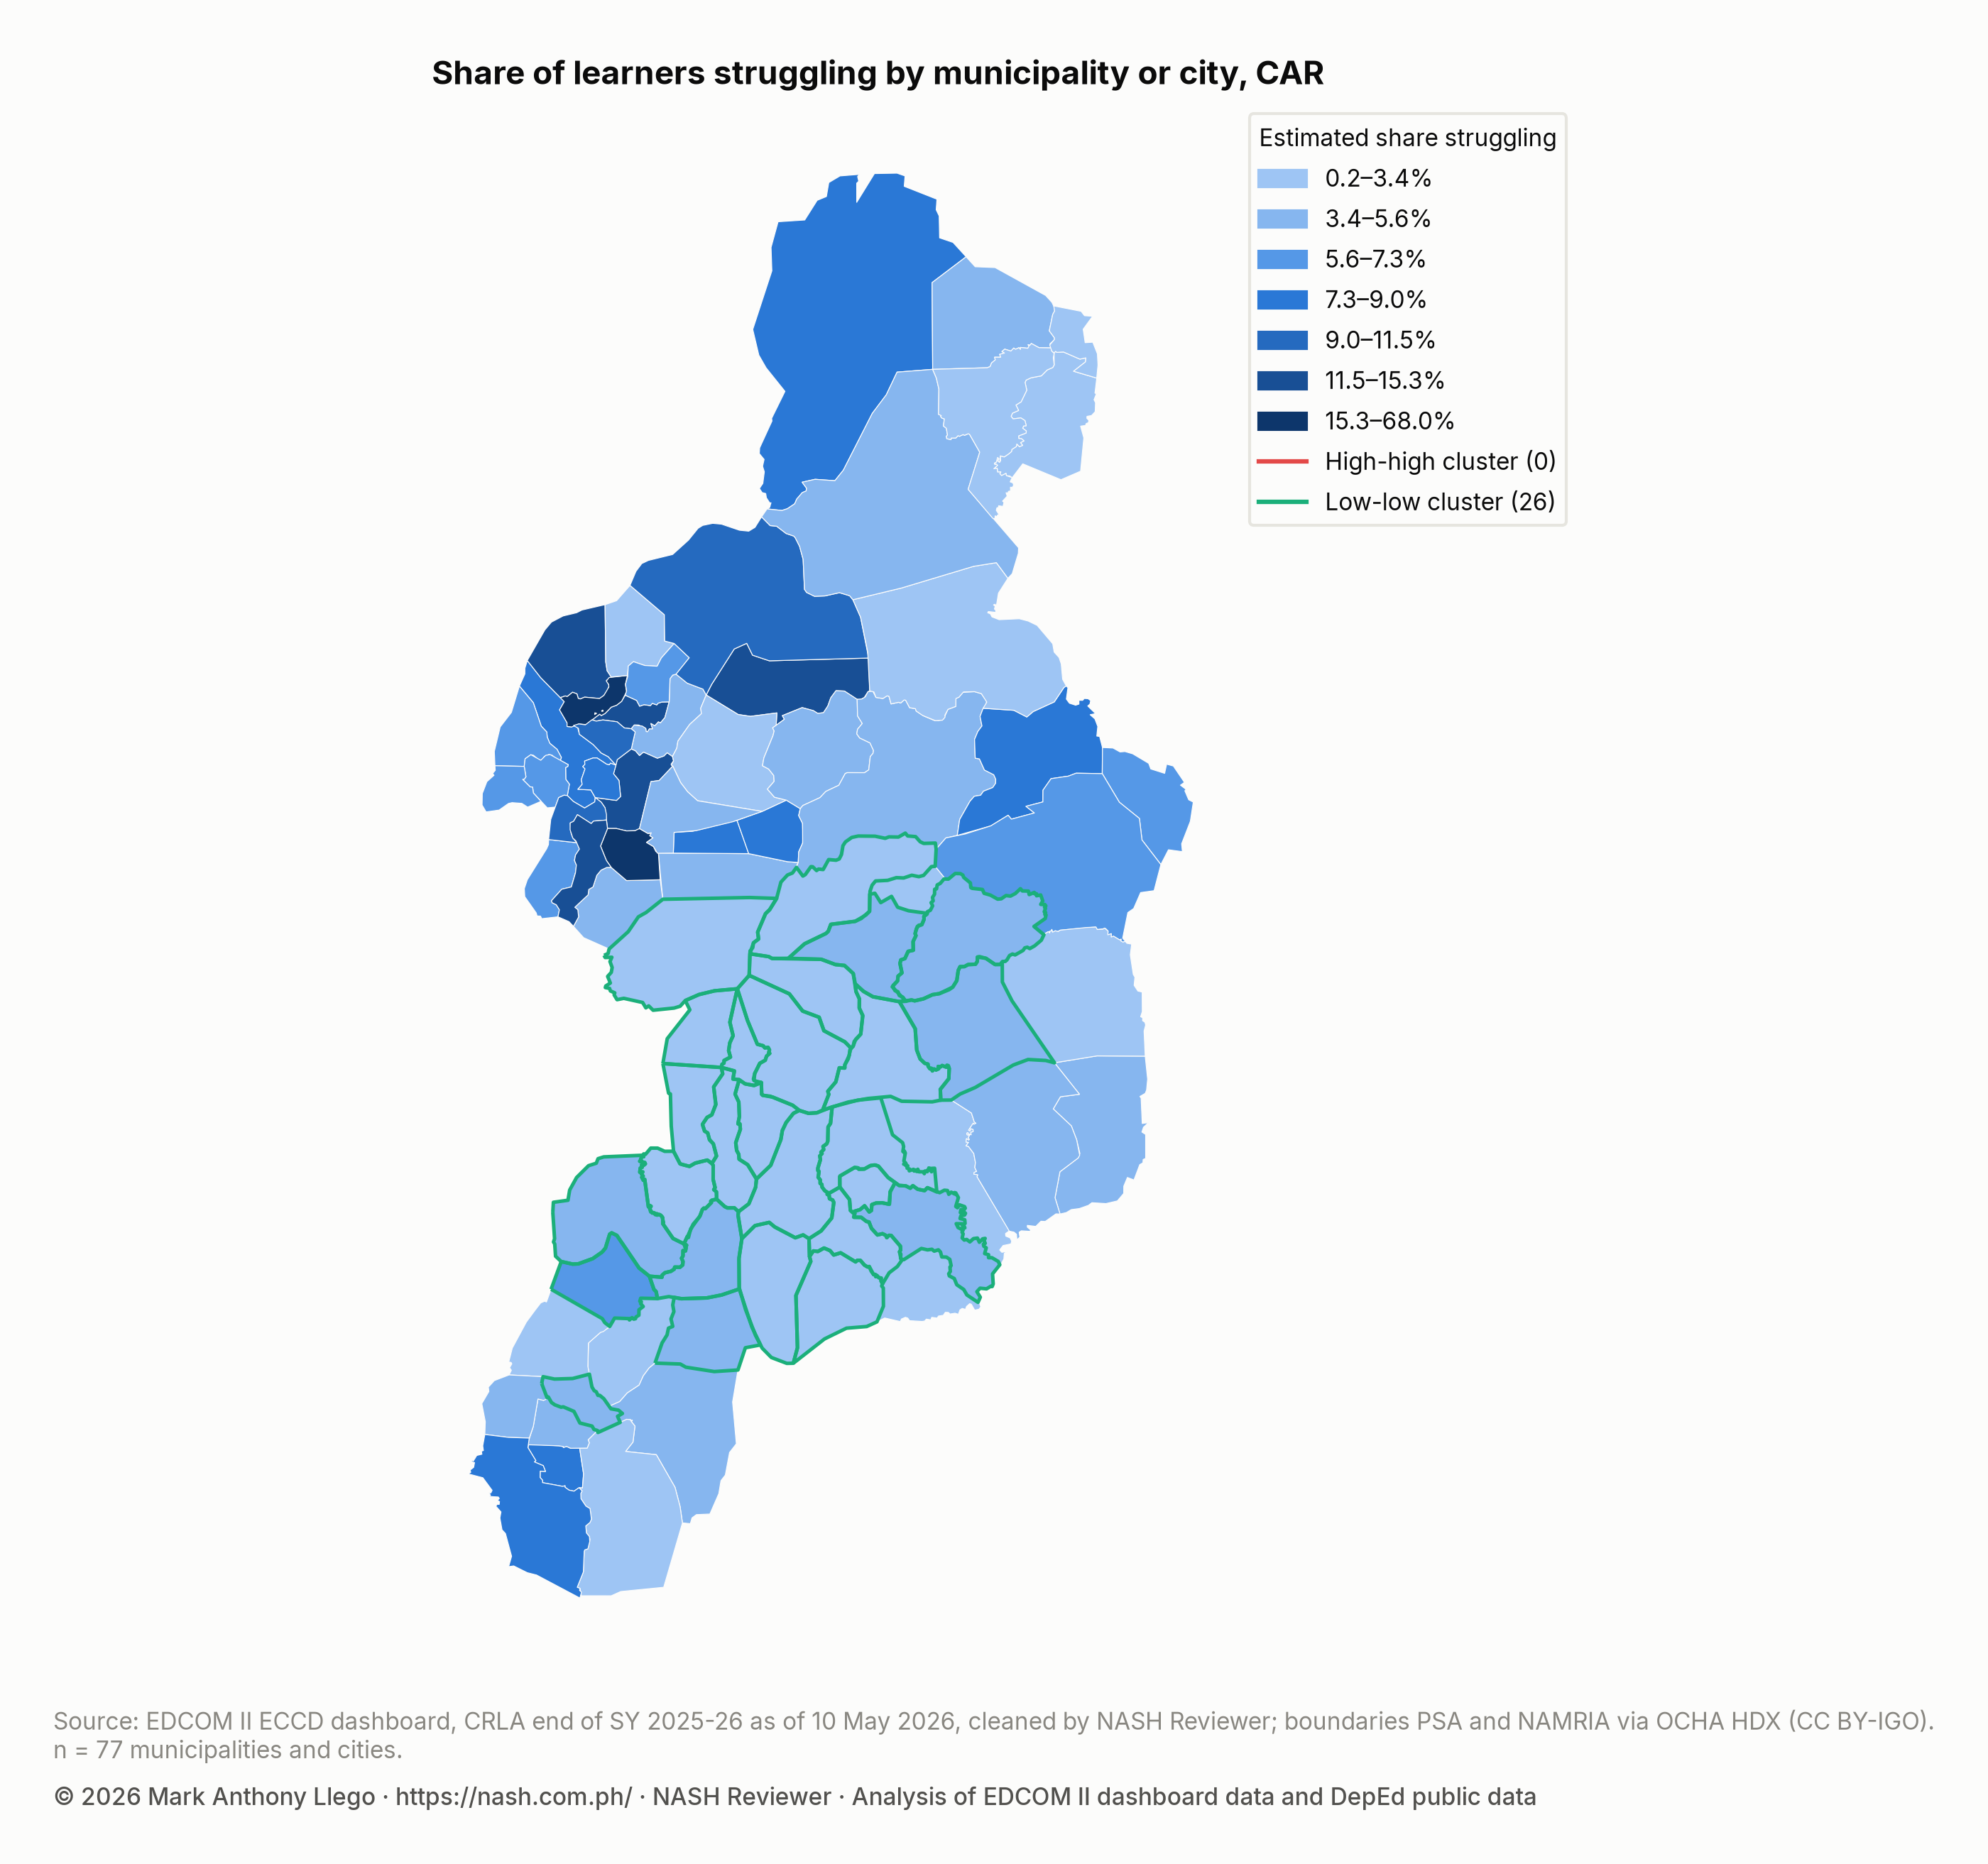
- 26 of CAR’s 77 municipalities and cities form low-low clusters and 0 form high-high clusters; the highest estimated shares are all in Abra.
- Stunting among children aged 0–2 is highest in Mountain Province (7.1%), against 4.3% nationally, while the Mt. Province division has the region’s lowest share of struggling readers.
- The median CAR school had 15.2 learners per teacher, against 22.8 nationally, and 33.8% of schools report a School Principal, against 40.7%.
- CAR schools matched to DepEd’s start-of-year file moved from 13.8% at grade level to 54.0% by the end of the year.
Reading levels by grade and language in CAR
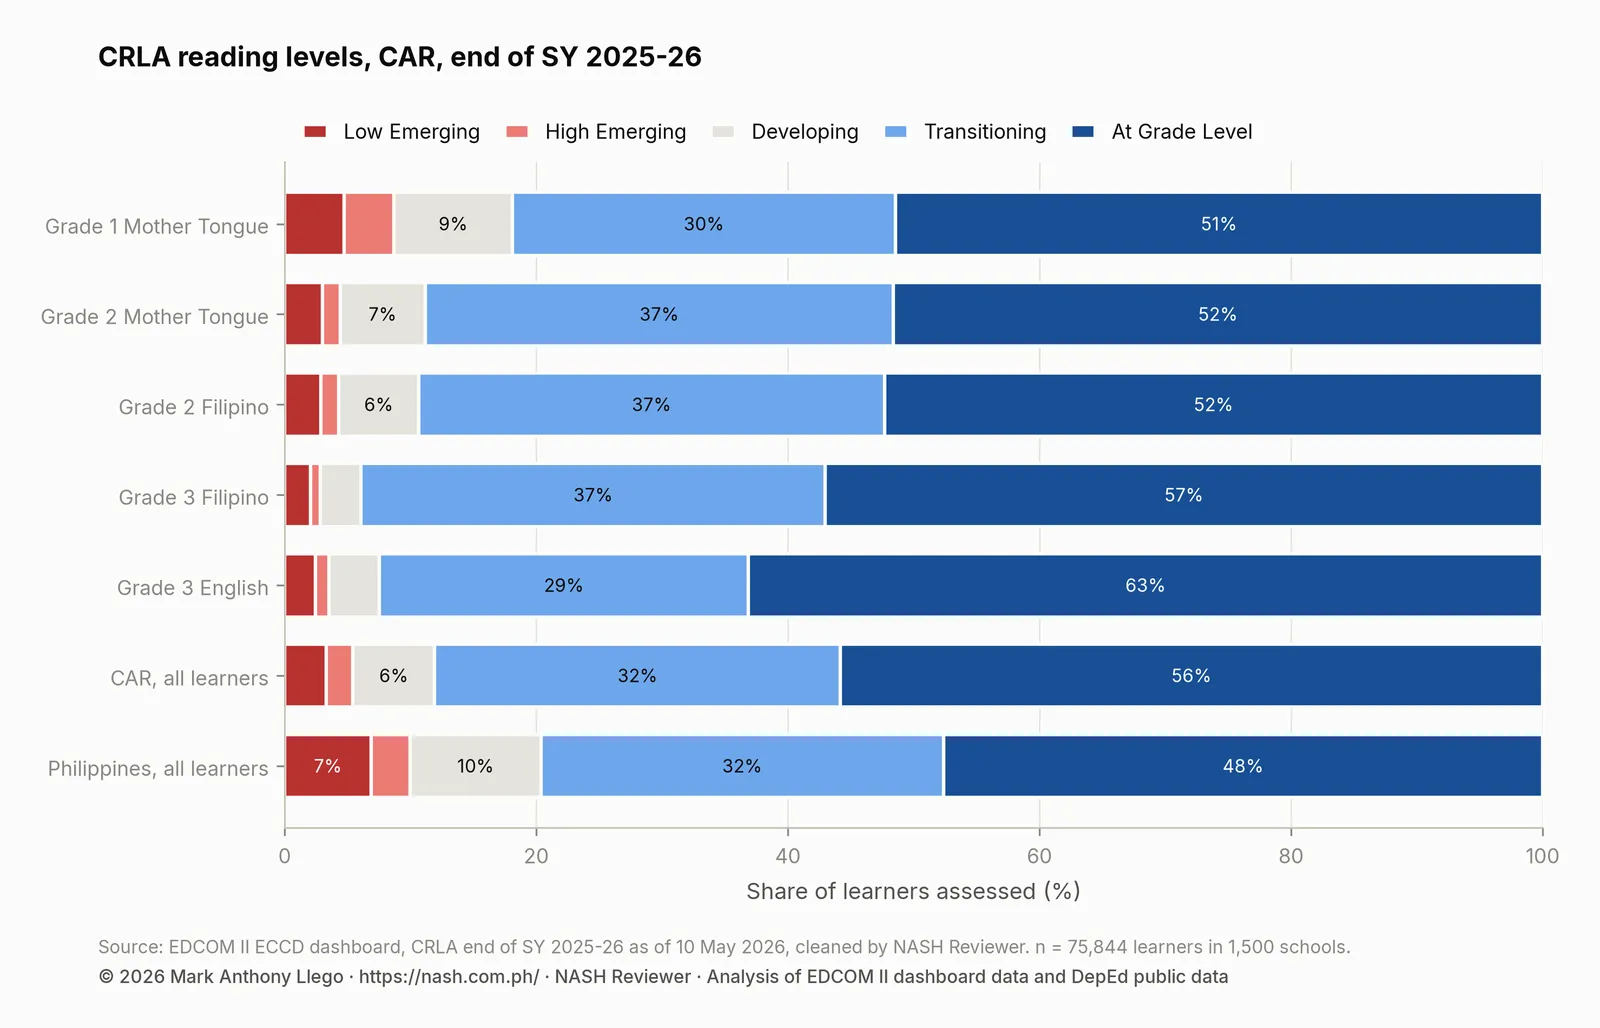
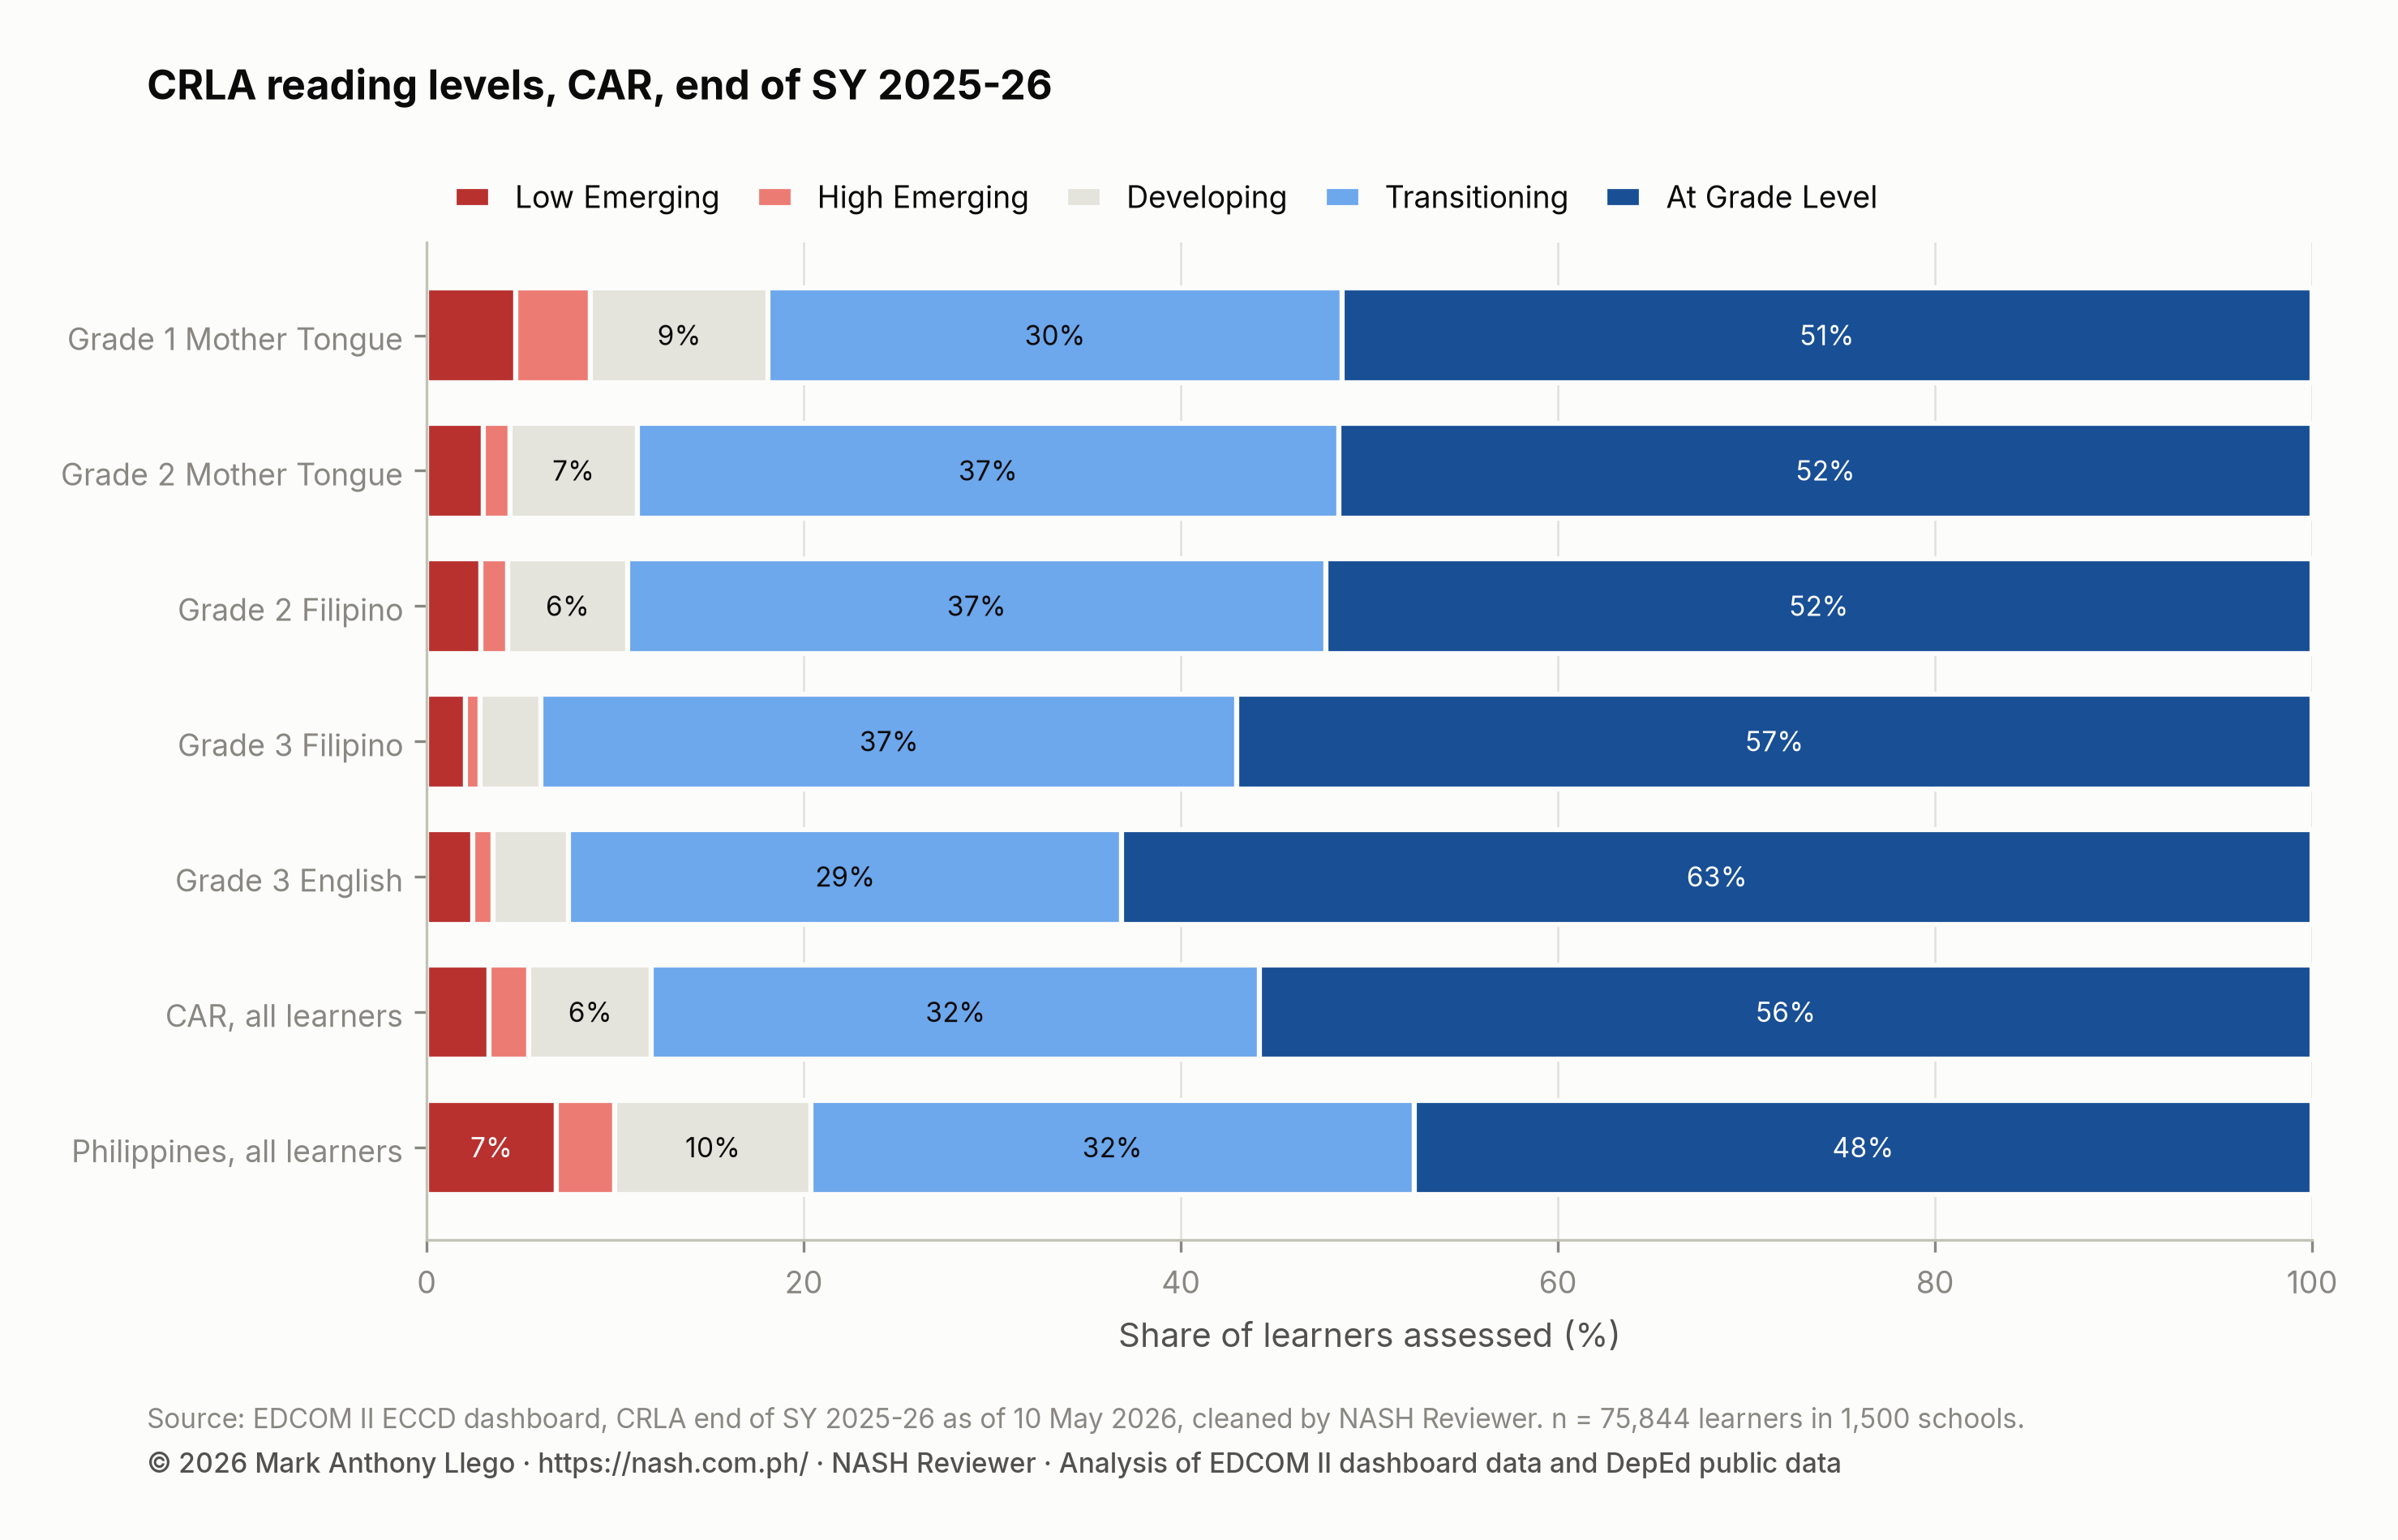
The table sets CAR’s results in each of the five grade-and-language blocks beside the national figures, level by level.
| Grade and language | Learners | Low Emerging | High Emerging | Developing | Transitioning | At Grade Level | Struggling |
|---|---|---|---|---|---|---|---|
| Grade 1 Mother Tongue | 24,053 | 4.7% | 4.0% | 9.4% | 30.4% | 51.5% | 8.7% |
| Grade 2 Mother Tongue | 22,806 | 3.0% | 1.4% | 6.8% | 37.2% | 51.6% | 4.4% |
| Grade 2 Filipino | 25,263 | 2.9% | 1.4% | 6.3% | 37.0% | 52.3% | 4.3% |
| Grade 3 Filipino | 26,262 | 2.1% | 0.8% | 3.3% | 36.9% | 57.0% | 2.8% |
| Grade 3 English | 26,528 | 2.4% | 1.1% | 4.0% | 29.3% | 63.1% | 3.5% |
| CAR, all learners | 75,844 | 3.3% | 2.1% | 6.5% | 32.3% | 55.8% | 5.4% |
| Philippines, all learners | 5,127,670 | 6.9% | 3.1% | 10.4% | 32.0% | 47.6% | 10.0% |
CAR is ahead of the national share at grade level in all five blocks, and Grade 3 English stands out: 63.1% of Grade 3 learners read at grade level in English, against 50.1% nationally, a margin of +13.1 percentage points. The narrowest margin is in Grade 2 Mother Tongue, where 51.6% read at grade level.
Grade 1 still carries the most struggling readers. In Grade 1 Mother Tongue, 8.7% of CAR learners are at Low Emerging or High Emerging, against 14.4% nationally.
Schools divisions in CAR
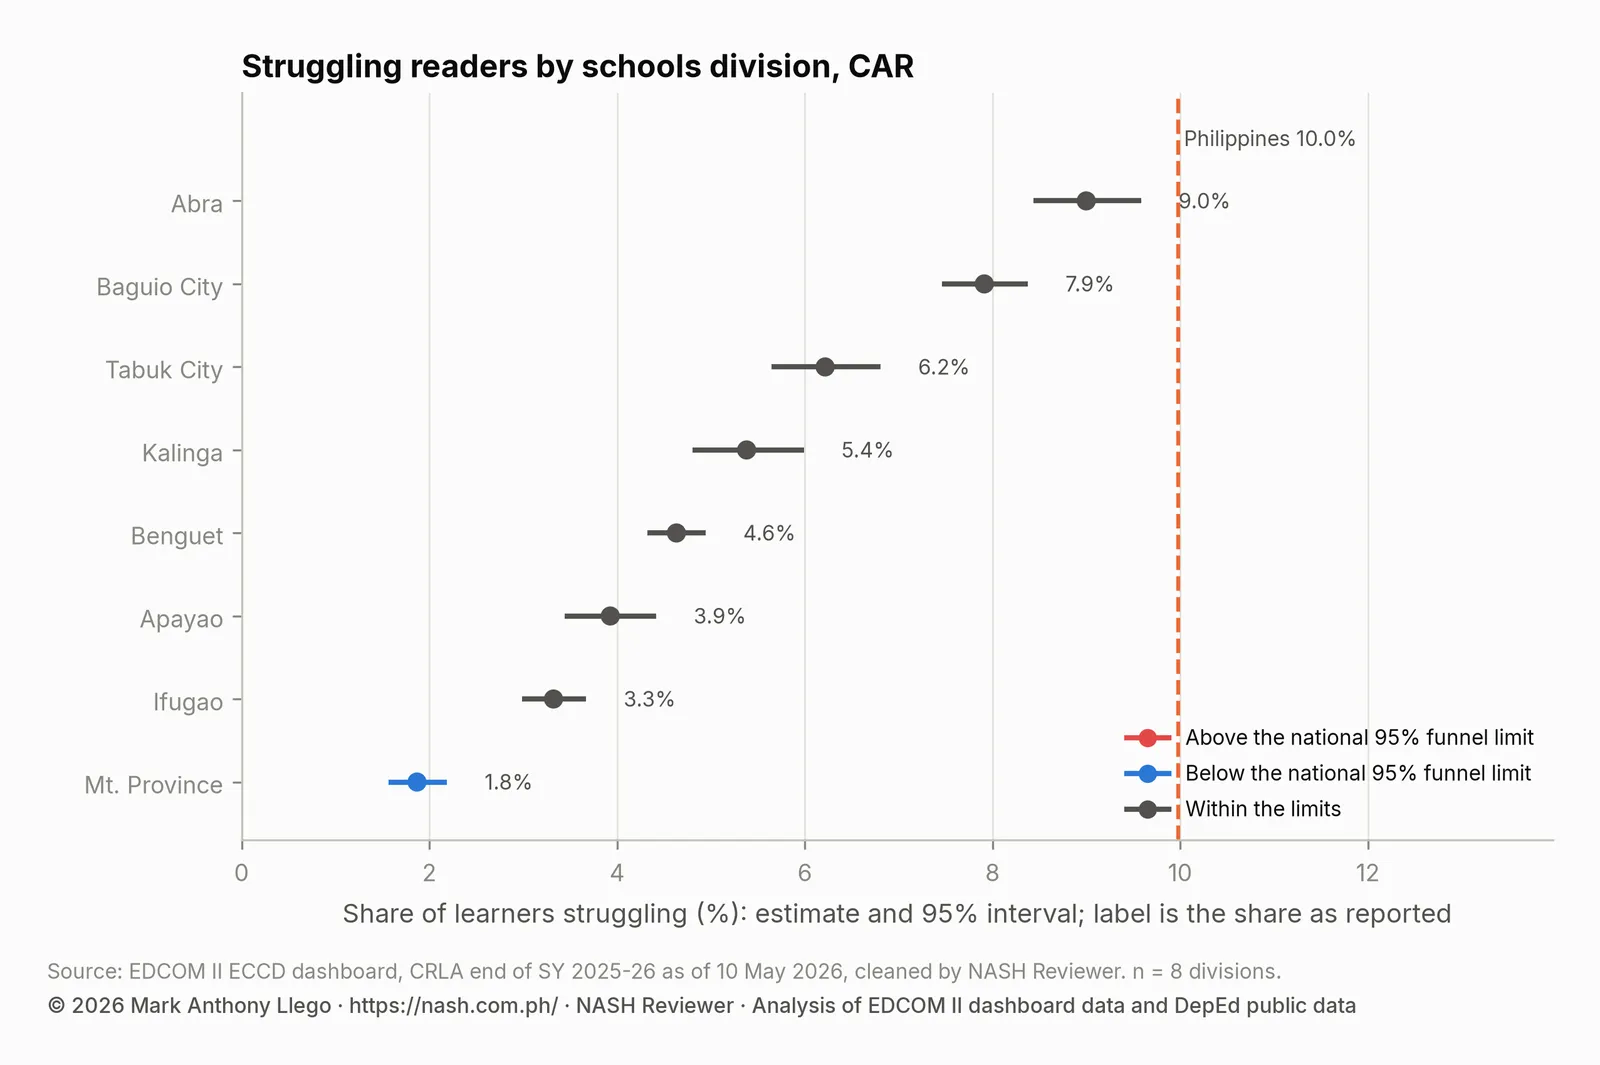
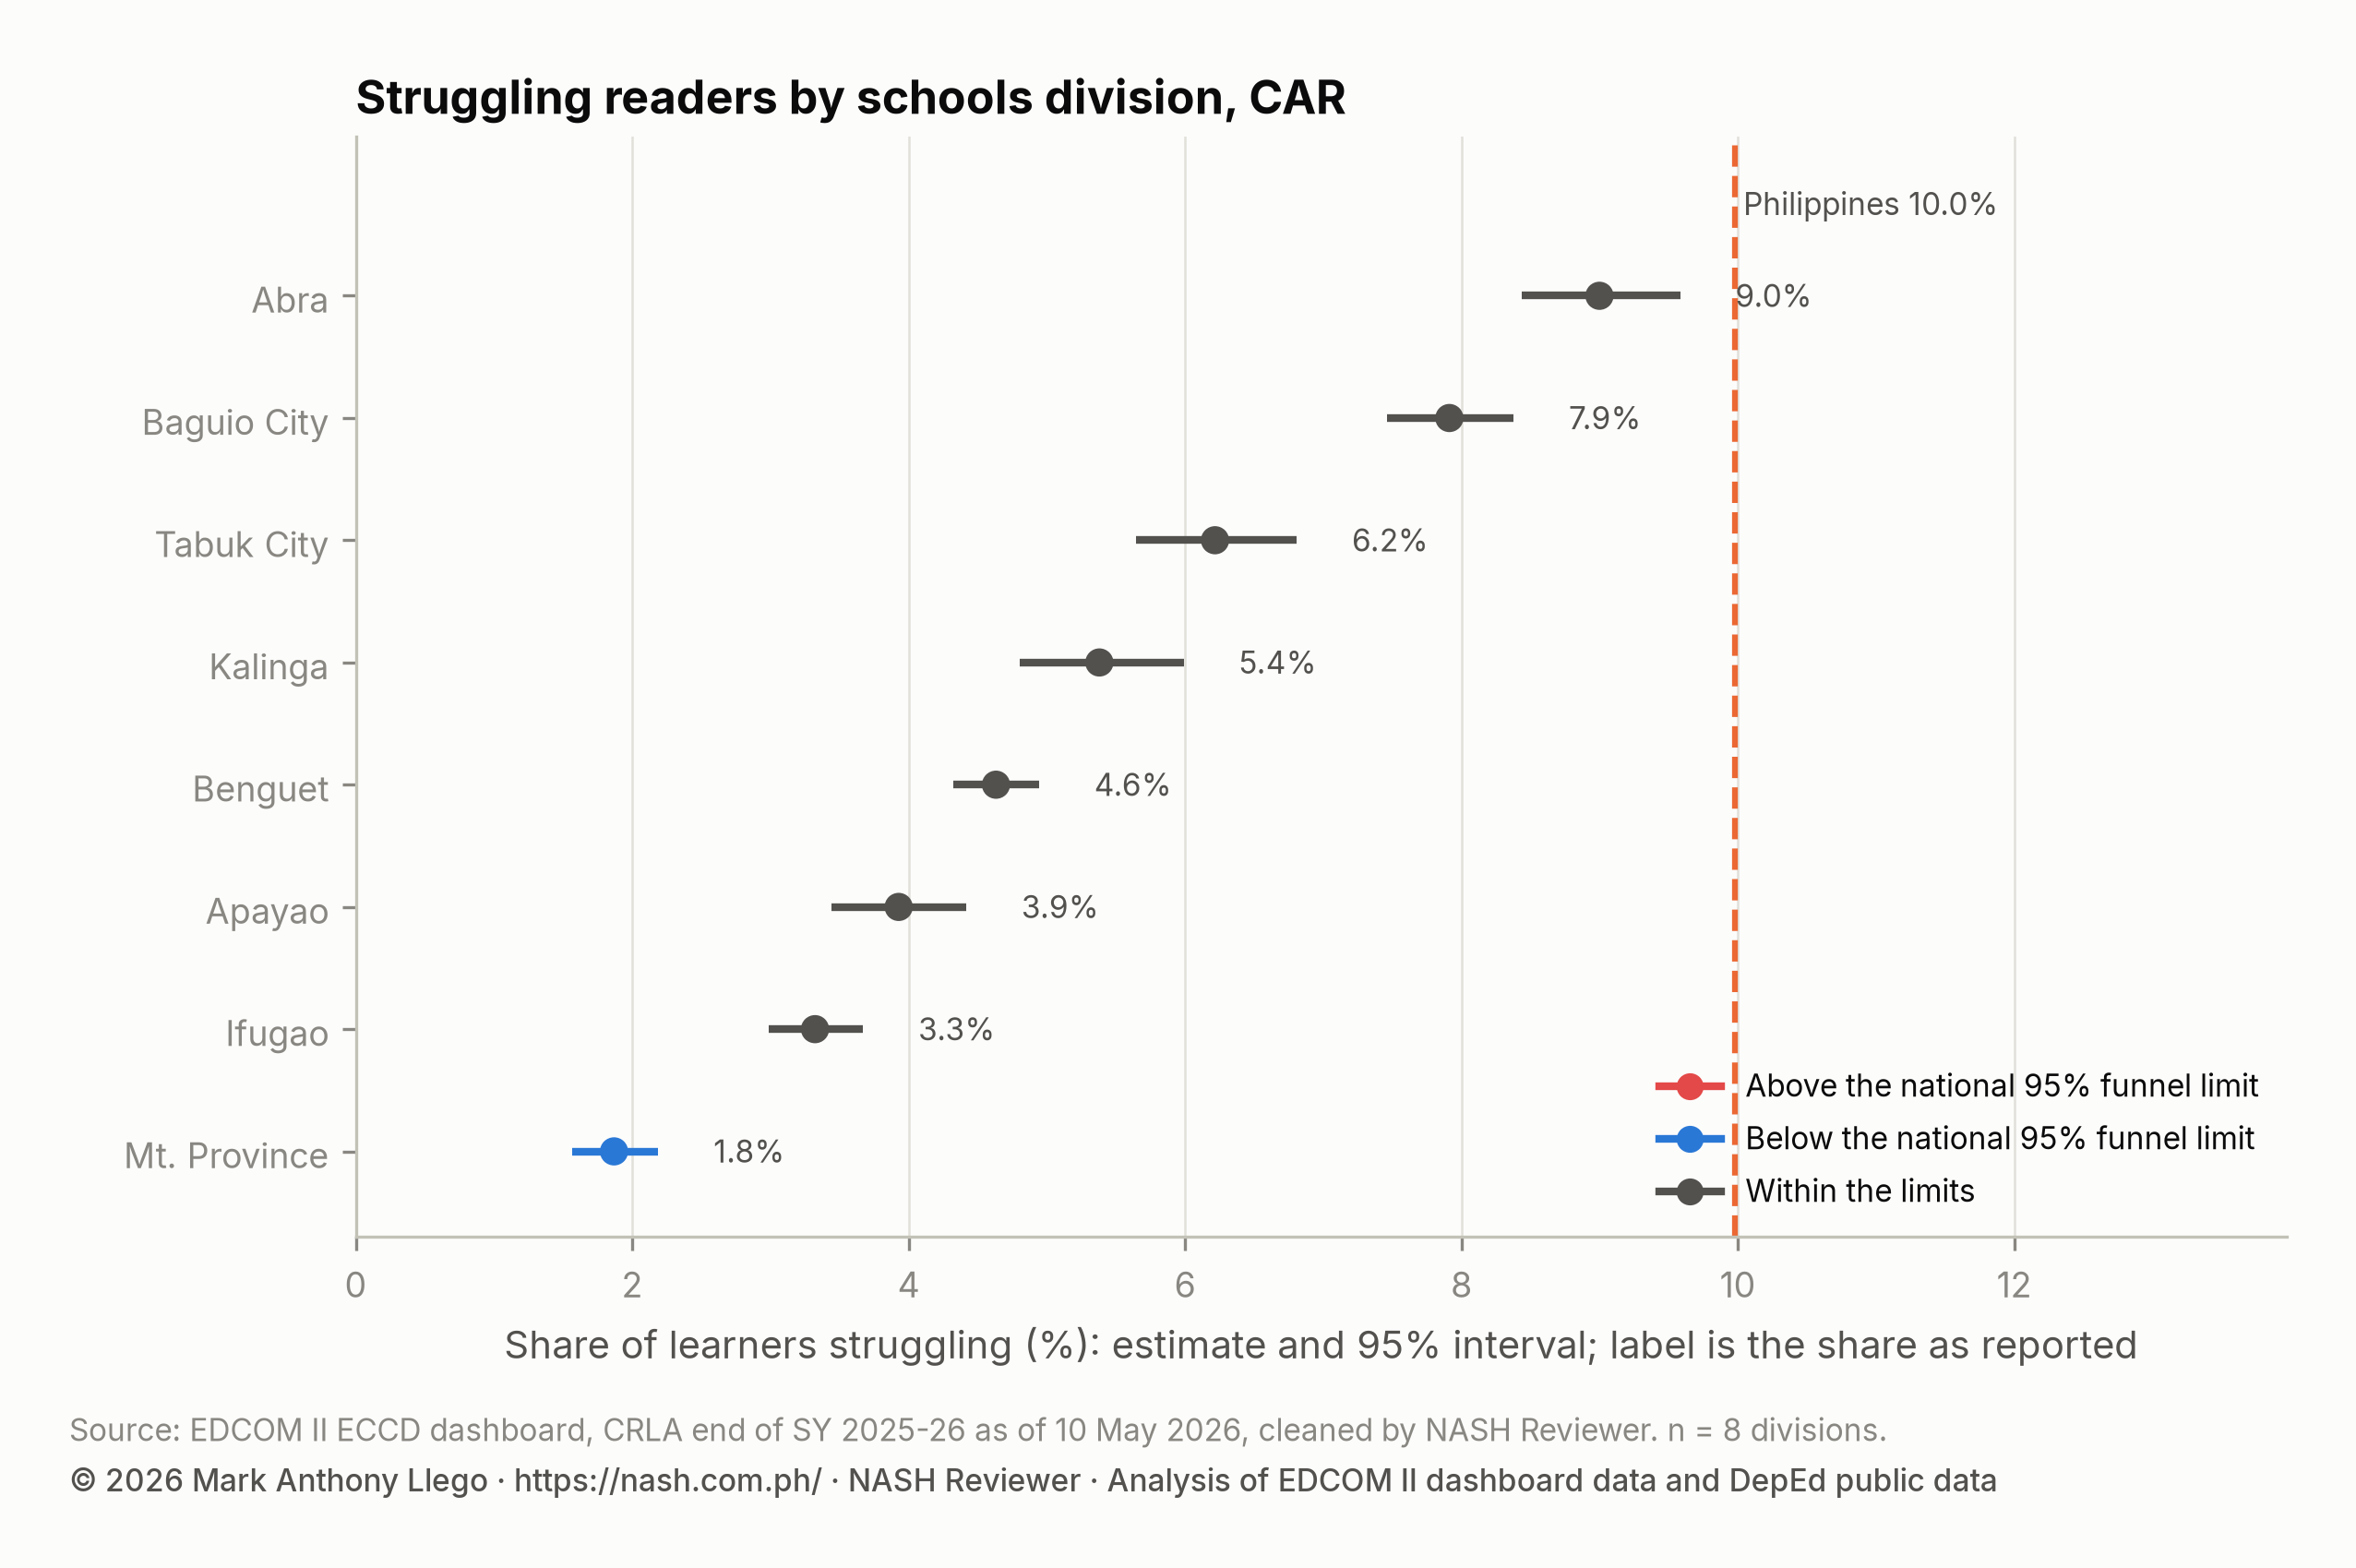
The table lists CAR’s 8 schools divisions, including the city divisions of Baguio City and Tabuk City, with each one’s learners, struggling readers, estimated share and 95% interval, national rank and funnel position.
| Division | Schools | Learners | Struggling readers | Share struggling | Estimate (95% interval) | National rank of 232 (95% interval) | National funnel |
|---|---|---|---|---|---|---|---|
| Abra | 248 | 9,415 | 847 | 9.0% | 9.0% (8.4%–9.6%) | 123 (107–139) | within limits |
| Apayao | 166 | 6,125 | 239 | 3.9% | 3.9% (3.4%–4.4%) | 28 (21–36) | within limits |
| Baguio City | 45 | 13,112 | 1,037 | 7.9% | 7.9% (7.5%–8.4%) | 91 (80–105) | within limits |
| Benguet | 371 | 17,645 | 816 | 4.6% | 4.6% (4.3%–4.9%) | 39 (34–44) | within limits |
| Ifugao | 226 | 10,706 | 354 | 3.3% | 3.3% (3.0%–3.7%) | 20 (16–23) | within limits |
| Kalinga | 158 | 5,394 | 289 | 5.4% | 5.4% (4.8%–6.0%) | 48 (42–53) | within limits |
| Mt. Province | 201 | 6,965 | 128 | 1.8% | 1.9% (1.6%–2.2%) | 5 (4–7) | below 95% |
| Tabuk City | 85 | 6,482 | 402 | 6.2% | 6.2% (5.6%–6.8%) | 54 (50–71) | within limits |
Each estimate borrows a little from the national rate, a method called empirical Bayes, nudging divisions with few learners furthest to damp small-sample noise. Funnel limits mark how far from the national share a division of a given size can sit by chance.
Abra (9.0%) has the highest share in the region. By count, the division with the most is Baguio City (1,037 struggling readers), ahead of Benguet although Benguet assesses more learners. Outside the funnel, CAR has 1 division: Mt. Province (1.8%), below the 95% limits.
Small schools also make zeros common. 784 CAR schools report no struggling reader, close to the 715 that a model allowing for school size and for differences between schools expects, so the count is about what a region of small schools would produce.
Languages of instruction
The 3 language groups in CAR’s table are led by Tagalog (40% of schools), with Ilocano second and a group of other languages third.
| Language of instruction | Schools | Learners | Share struggling | At Grade Level |
|---|---|---|---|---|
| Tagalog | 600 | 40,778 | 5.3% | 55.4% |
| Ilocano | 519 | 22,802 | 6.8% | 55.0% |
| Other | 381 | 12,264 | 3.3% | 58.7% |
Schools listed as Other have the lowest share of struggling readers and the highest share at grade level, while Ilocano-language schools have the highest struggling share. In Grade 2, CAR learners do slightly better in Filipino than in the mother tongue: the Filipino share at grade level minus the mother-tongue share is +1.0 percentage points, against -0.8 nationally. CRLA by Language gives the other regions.
Where struggling readers are concentrated in CAR
What the map shows belongs to places; no individual child can be read from it. Across the Cordillera’s 77 municipalities and cities, the shading follows each place’s estimated share of struggling readers, in the same colors as the national map.
Baguio City, with the most learners, leads the count, and small La Paz in Abra makes the list on its high share: Baguio City, Benguet (1,037); City of Tabuk (Capital), Kalinga (402); La Trinidad (Capital), Benguet (221); La Paz, Abra (146); Tuba, Benguet (143). The highest estimated shares form a different list, all in Abra: La Paz, Abra (18.6%); Manabo, Abra (15.4%); Dolores, Abra (14.9%); Villaviciosa, Abra (14.1%); Bucay, Abra (13.1%). These are small places, so their estimates have already been pulled toward the national rate and remain high.
A local cluster test compares each place with its neighbors. CAR has 0 high-high clusters and 26 low-low clusters, where low shares sit together; the Abra places do not reach the bar for a high-high cluster.
| Municipality or city | Province | Struggling readers | Learners | Estimated share struggling | Cluster |
|---|---|---|---|---|---|
| Baguio City | Benguet | 1,037 | 13,112 | 7.9% | No cluster |
| City of Tabuk (Capital) | Kalinga | 402 | 6,482 | 6.2% | No cluster |
| La Trinidad (Capital) | Benguet | 221 | 4,136 | 5.4% | No cluster |
| La Paz | Abra | 146 | 777 | 18.6% | No cluster |
| Tuba | Benguet | 143 | 1,827 | 7.8% | No cluster |
Early childhood: stunting and day care centers
Of the 46,100 CAR children aged 0–2 measured in Operation Timbang Plus 2025, 5.0% were stunted, against 4.3% nationally. Mountain Province (7.1%) is highest in the region and well above the national share. The DILG list shows 86 of 1,178 barangays (7.3%) without a child development center (CDC), the barangay day care center, against 10.9% nationally; Benguet has the most.
| Province or highly urbanized city | Children 0–2 measured | Stunted | Barangays without a CDC | Learners struggling |
|---|---|---|---|---|
| Abra | 5,733 | 5.8% | 15 of 303 | 9.0% |
| Apayao | 3,301 | 5.5% | 14 of 133 | 3.9% |
| Benguet | 18,907 | 5.8% | 41 of 269 | 6.0% |
| Ifugao | 6,305 | 1.6% | 10 of 176 | 3.3% |
| Kalinga | 7,758 | 4.0% | 2 of 153 | 5.8% |
| Mountain Province | 4,096 | 7.1% | 4 of 144 | 1.8% |
Mountain Province shows the sharpest contrast: the region’s highest stunting and its lowest share of struggling readers. The two measures cover different children, toddlers weighed in 2025 and learners in Grades 1–3, so the contrast describes a province, not any child’s path. Whether such contrasts hold across the country’s municipalities is the subject of Stunting, Day Care Centers and Early Reading.
School resources
The inputs table draws on DepEd’s SY 2023-24 school files, two school years before the CRLA, and sets CAR’s median school, or its share of schools, beside the Philippines.
| School input (SY 2023-24) | CAR | Philippines |
|---|---|---|
| Learners per teacher (elementary) | 15.2 | 22.8 |
| Learners per classroom (elementary) | 17.8 | 25.8 |
| Schools with internet | 69.8% | 76.3% |
| Schools with electricity | 99.2% | 97.6% |
| Schools with a water supply | 99.5% | 97.8% |
| Schools with no functional toilet | 2.5% | 2.3% |
| Schools with multigrade classes | 40.2% | 15.3% |
CAR’s schools carry light loads: 15.2 learners per teacher and 17.8 per classroom in the median school, against 22.8 and 25.8 nationally. Fewer CAR schools are online: 69.8% have internet, against 76.3%.
A model fitted to CAR schools alone compares each school only with others in its own division, and its intervals are widened because school results vary more than a simple binomial model expects. Odds ratios over 1 mark inputs that go with more struggling readers, and those under 1 inputs that go with fewer. The Cordillera model singles out 4 inputs, each with a 95% interval that excludes 1: learners per teacher: odds ratio 1.27 (1.10–1.47); school size: odds ratio 0.87 (0.77–0.98); income class 2nd: odds ratio 0.74 (0.54–0.999); income class 4th: odds ratio 0.76 (0.59–0.99). Income classes are compared with first-class municipalities, and the second-class interval only just excludes 1.
Each of these points the same way as the national model: within a division, more learners per teacher went with more struggling readers, while larger schools and schools in second- and fourth-class municipalities went with fewer. Internet, which reaches fewer CAR schools than the national share, has an interval that includes 1 here. Electricity reaches 99.2% of CAR schools, so the few without it leave that interval wide. All are associations, not effects.
School heads
Fewer CAR schools have a principal: DepEd’s SY 2023-24 personnel file records the position in 33.8% of them, against 40.7% nationally, and 39.4% have no head position at all. CAR’s struggling share, before any adjustment, is 5.4% where a principal is in post and 5.2% where none is. Schools without a principal tend to be much smaller, so CRLA Results in Schools With and Without a Principal adjusts for such differences.
Programs recorded in CAR
The EDCOM II dashboard keeps a list of programs run by NGOs and corporate foundations, with 5 records in CAR: by category Literacy (3); Nutrition (1); Childcare (1), and by type Reading Remediation (Grades 1-3) (2); Literacy Tutoring Program (1); Nutrition Counseling for Mothers (1); Child Development Center (CDC) Establishment (1). CAR holds 5.0% of the listed programs and 0.8% of the country’s struggling readers, so its share of the list is well above its share of need. The list holds only what organizations reported, not a full count, as the programs comparison explains.
Start and end of the year
CAR is among the regions in DepEd’s selected-school CRLA file. DepEd does not say which round that file covers, but its date and results point to the start of the year. Across the CAR schools that appear in both files, the share at grade level climbed from 13.8% to 54.0% (+40.2 percentage points), while the struggling share dropped from 38.2% to 5.8%. These cover only the matched schools, so they differ slightly from the regional shares above. CRLA Start vs End of SY 2025-26 in the Same Schools explains the matching; the change describes the year, not its causes.
What this means for school heads in CAR
Read a small school’s result with its size in mind. With few learners, one child moves the share a long way, so a zero or a high share says less than in a large school.
Plan reading time across grades in multigrade classes. Grade 1 holds the most struggling readers, so learners at Low Emerging need regular small-group time even when one teacher handles several grades.
In Abra, look at the municipal map. The division average hides places with much higher shares, which are the first candidates for added reading support.
How these numbers were made
Every CAR figure here starts from the end-of-year CRLA results for public schools in SY 2025-26, as they stood on the EDCOM II early-childhood (ECCD) dashboard as of 10 May 2026. To avoid double counting, the regional totals use one assessment per learner: Grade 1 Mother Tongue, Grade 2 Filipino and Grade 3 English. DepEd’s SY 2023-24 school and personnel files supply the inputs and school-head categories. Full methods are in the all-region report and the guide to reading school results.
Limits
The regional shares count nearly every learner, so they need no sampling interval, but they rest on records that schools entered. Many CAR schools are small, which makes school and municipal figures noisy. Inputs are two school years older than the results, and all comparisons are associations, not causes.
Frequently asked questions
How does CAR compare with the national CRLA results?
CAR does better than the country: 5.4% of its assessed Grade 1–3 learners were struggling readers at the end of SY 2025-26, against 10.0%, and 55.8% read at grade level, against 47.6%.
Why are CRLA shares higher in Abra than elsewhere in CAR?
The data show where, not why. The highest division share is Abra (9.0%), and the five CAR places with the highest estimated shares are all in Abra. Explaining the pattern needs local knowledge of schools, languages and attendance.
Does Mountain Province have high stunting but few struggling readers?
Yes. Stunting among children aged 0–2 is highest in Mountain Province (7.1%), while Mt. Province (1.8%) has the region’s lowest division share of struggling readers. The two measures cover different children, so the contrast describes a place.
Download the data
The cleaned EDCOM II dashboard data behind this series are free to download for personal study; to reuse them, email support@nash.com.ph for written permission first. How the EDCOM Dashboard Data Was Cleaned explains every table and cleaning rule. The files are at data.nash.com.ph: start with the README, then the school table with CRLA results and school inputs (Parquet), the school estimates (CSV), the division estimates (CSV) and the municipal table (CSV). The DepEd school files used for school inputs are described in Download Cleaned DepEd School Data.
Every file, with its rows, columns and checksum, is listed on the EDCOM II CRLA data page. To cite the data: Llego, M. A. (2026). EDCOM II early-childhood dashboard data, cleaned, version 1. NASH Reviewer. https://nash.com.ph/edcom-data
More in this series
- CRLA End-of-Year Results SY 2025-26: All 18 Regions
- CRLA Start vs End of SY 2025-26 in the Same Schools
- CRLA by Language: Mother Tongue, Filipino and English
- How to Read a School’s CRLA Results Fairly
- CRLA Variation: School, Division or Region?
- Where Struggling Readers Are Concentrated
- School Resources and CRLA Reading Results
- CRLA Results in Schools With and Without a Principal
- Action Research and Thesis Topics on Reading (CRLA)
- CRLA Reading Hotspots: A Map of Struggling Readers
- Stunting, Day Care Centers and Early Reading
- Literacy and Nutrition Programs Compared With Need
- CRLA Schools With No Struggling Readers: A Data Check
- How the EDCOM Dashboard Data Was Cleaned
- Regional reports: NCR, CAR, Region I, Region II, Region III, Region IV-A, MIMAROPA, Region V, Region VI, NIR, Region VII, Region VIII, Region IX, Region X, Region XI, Region XII, Caraga, BARMM
- Earlier reports: CRLA Results SY 2025-2026 (DepEd’s selected-school file), Do the Same DepEd Schools Lag on the ELLNA, NAT and CRLA?, DepEd School Inputs vs Test Results, EDCOM II Final Report: Guide for Aspiring School Heads, DepEd Data for Aspiring School Heads: Where to Start
Analysis and charts by Mark Anthony Llego for NASH Reviewer. Data: EDCOM II early-childhood dashboard and Department of Education public datasets. NASH Reviewer is not affiliated with EDCOM II or DepEd. Charts may be reused only with written permission from support@nash.com.ph.