To read a school’s CRLA results fairly, start with how many learners stand behind its share of struggling readers. In schools with fewer than 30 learners, the 95% interval for the school’s estimated share is typically 17 percentage points wide; in schools with several hundred learners or more it is about 4 points. A small school can show a very high or a very low share by chance alone, so its raw share says less than it seems to.
The figures below are from the end-of-year CRLA for SY 2025-26 in 38,679 public schools, on the EDCOM II early-childhood (ECCD) dashboard as of 10 May 2026. Each school’s estimate combines its own share with its region’s, and a funnel plot checks every school against the range expected for a school of its size: 254 schools lie above the 99.8% limit, where about 48 would be expected by chance. Ranked by raw share, 30 of the hundred schools with the highest shares assessed fewer than 30 learners; ranked by the estimate, 10 did.
Key findings
- In schools with fewer than 30 learners, the median 95% interval for the share of struggling readers is 17 percentage points wide, against 4 points in schools with several hundred learners or more.
- Each school’s estimate blends its own share with its region’s share. The region’s share counts like κ extra learners, and κ ranges from 1.8 (BARMM) to 13.4 (Region IV-A).
- For 38.7% of schools, the data cannot tell whether the school’s underlying rate is above or below the national 10.0%. 8,280 schools are very likely above it and 15,434 very likely below.
- Ranked by raw share, 30 of the hundred schools with the highest shares assessed fewer than 30 learners, and the median school assessed 52. Ranked by the estimate, 10 did, and the median school assessed 79.
- 254 schools lie above the funnel’s 99.8% limit, where about 48 would be expected by chance. 74 are flagged at FDR 5%, all with high shares, and the region with the most schools above the 99.8% limit is BARMM (106).
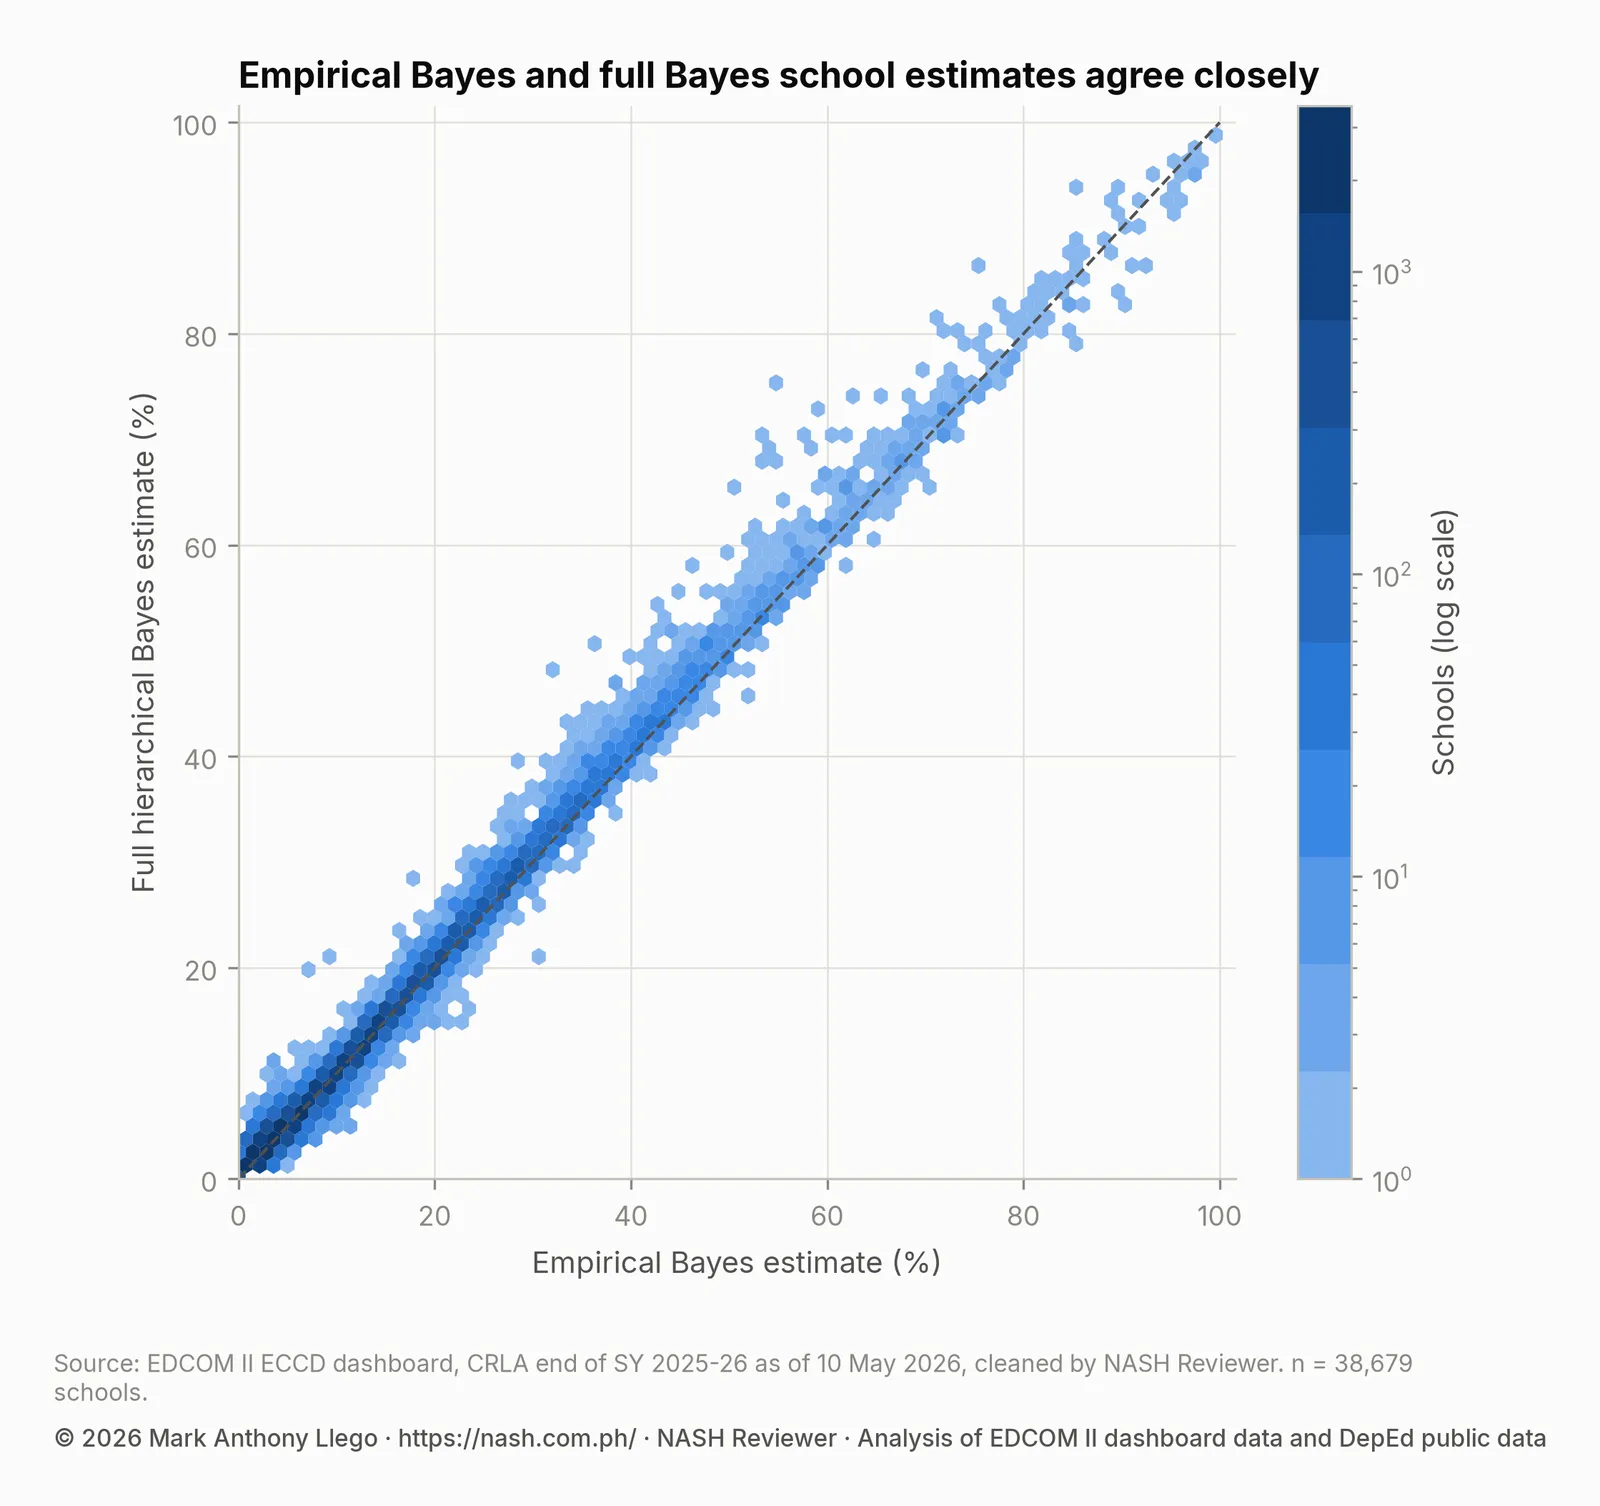
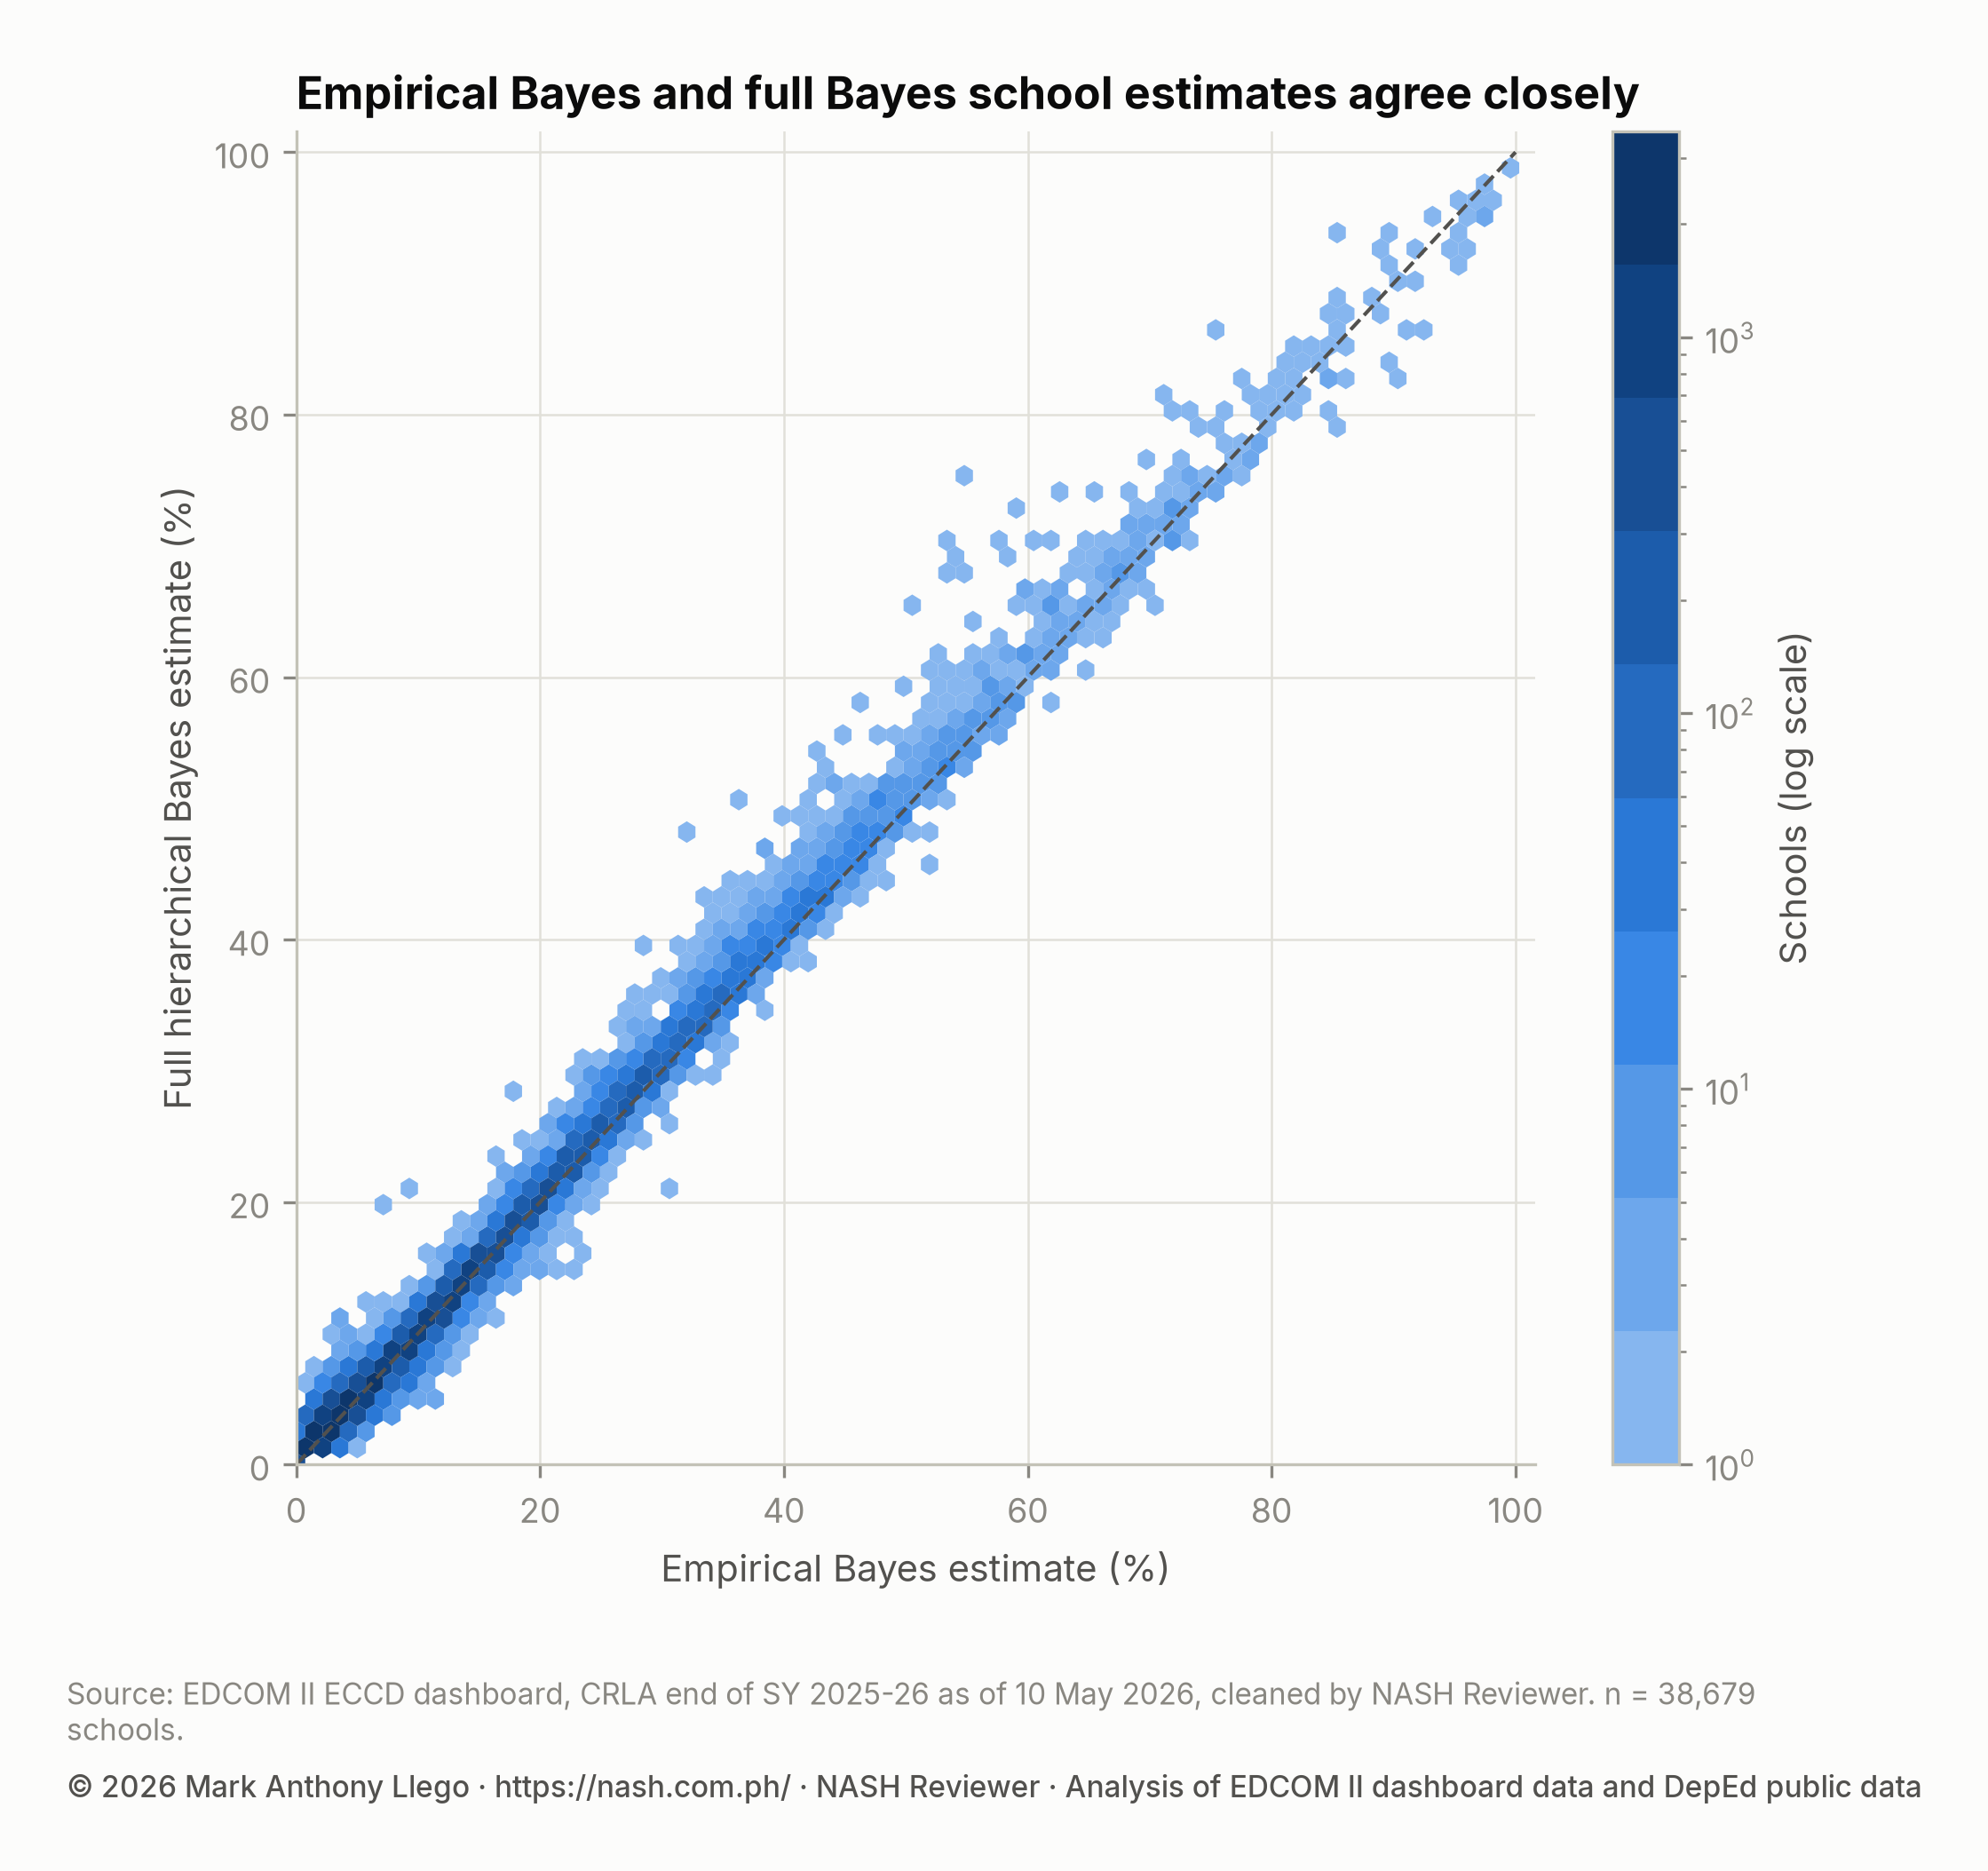
- A full hierarchical Bayesian model agrees closely with the simpler estimates: correlation 0.996, median difference 0.4 percentage points, and the same verdict on “very likely above the national share” for 99.0% of schools.
Reading a school’s CRLA results: why shares swing by chance
The Comprehensive Rapid Literacy Assessment (CRLA) is the teacher-administered reading screen that DepEd uses in Grades 1–3. A struggling reader is a learner at Low Emerging or High Emerging, and each learner is counted once: Grade 1 by the Mother Tongue result, Grade 2 by Filipino and Grade 3 by English. Nationally, 10.0% of learners are struggling readers, about one in ten; CRLA End-of-Year Results SY 2025-26: All 18 Regions gives the full picture.
Think of each school as having an underlying rate: the share it would show on average if similar groups of children passed through it year after year. This year’s share is one draw from that rate, and a small draw is a noisy one. In a school that assessed five learners, each child is a fifth of the result.
An interval measures that noise: it is the range of underlying rates consistent with what the school reported. The median 95% interval is 17 points wide for schools with fewer than 30 learners and 4 points for the largest, even though these estimates already borrow strength from the region. For 38.7% of all schools, the data cannot tell whether the underlying rate is above or below the national share.
Stein’s paradox: why borrowing from similar schools helps
In 1956, the statistician Charles Stein proved a surprising result: when three or more averages are estimated at once, pulling every estimate part of the way toward a common value gives a smaller total error, on average, than taking each at face value. Bradley Efron and Carl Morris illustrated it in 1977 with baseball. Early-season batting averages pulled toward the average of all players predicted the rest of the season better, taken together, than the players’ own averages did.
A small school’s own share is real information but noisy; what is typical in its region is less specific but steady. Combining the two, with more weight on the school’s own data the more learners it assessed, gives estimates that are closer to the truth, on average, across schools as a whole. The price is that a school that truly is unusual is pulled somewhat toward the group. A large school is barely pulled, because its own data carry almost all the weight.
Empirical Bayes estimates for each school
A method called empirical Bayes applies Stein’s idea, “empirical” because what is typical is estimated from the data rather than assumed. Each school starts from its region’s share of struggling readers, and each of the 18 regions has its own concentration, written κ (kappa).
κ is easiest to read as a number of learners. The region’s share counts as if κ extra learners, struggling at the region’s rate, were added to the school’s own count:
estimate = (struggling readers + κ × region’s share) ÷ (learners assessed + κ)
The weight on the school’s own share is learners assessed ÷ (learners assessed + κ); the rest goes to the region’s share.
κ is fitted for each region from how widely its schools differ beyond what chance produces. A small κ means schools differ a lot, so each keeps more of its own result; a large κ means schools are alike, so small schools are pulled more toward the region’s share. Across regions, κ ranges from 1.8 (BARMM) to 13.4 (Region IV-A).
The table gives each region’s share of struggling readers, its κ, and the weight that a school with 10 learners and a school with a hundred learners place on their own share.
| Region | Schools | Region’s share struggling | Concentration κ | Weight on a 10-learner school’s own rate | Weight on a 100-learner school’s own rate |
|---|---|---|---|---|---|
| BARMM | 1,469 | 23.4% | 1.8 | 0.85 | 0.98 |
| CAR | 1,500 | 5.4% | 9.4 | 0.51 | 0.91 |
| Caraga | 1,706 | 10.1% | 8.7 | 0.53 | 0.92 |
| MIMAROPA | 1,924 | 11.4% | 6.9 | 0.59 | 0.94 |
| NCR | 520 | 5.3% | 11.8 | 0.46 | 0.89 |
| NIR | 1,742 | 10.4% | 9.5 | 0.51 | 0.91 |
| Region I | 2,409 | 9.5% | 10.1 | 0.5 | 0.91 |
| Region II | 2,212 | 8.6% | 10.9 | 0.48 | 0.9 |
| Region III | 3,024 | 7.9% | 8.6 | 0.54 | 0.92 |
| Region IV-A | 2,754 | 6.7% | 13.4 | 0.43 | 0.88 |
| Region IX | 2,310 | 14.7% | 4.4 | 0.7 | 0.96 |
| Region V | 3,162 | 12.1% | 10.2 | 0.5 | 0.91 |
| Region VI | 2,433 | 8.2% | 8.4 | 0.54 | 0.92 |
| Region VII | 2,189 | 10.4% | 5.5 | 0.64 | 0.95 |
| Region VIII | 3,656 | 7.2% | 6.2 | 0.62 | 0.94 |
| Region X | 2,176 | 9.3% | 7 | 0.59 | 0.93 |
| Region XI | 1,749 | 11.7% | 7.1 | 0.59 | 0.93 |
| Region XII | 1,744 | 17.7% | 5.5 | 0.64 | 0.95 |
In BARMM, where schools differ the most, even a school with 10 learners keeps most of its own result. In Region IV-A, where κ is largest, a school with 10 learners ends up closer to the region’s share than to its own. A school with a hundred learners keeps most of its own share everywhere.
Each estimate comes with a 95% credible interval and with the probability that the school’s underlying rate is above the national share.
A worked example: three schools with the same share
The table follows three made-up schools. Each has three struggling readers in every five learners assessed. School A assessed five learners, School B ten times as many and School C fifty times as many. All three sit in a region whose share equals the national 10.0% and whose κ is 8.5, the median of the regional values.
| Synthetic school | Struggling / assessed | Raw rate | Weight on own rate | Estimate (95% interval) | Probability above the national rate |
|---|---|---|---|---|---|
| School A | 3 / 5 | 60.0% | 0.37 | 28.5% (8.8%–54.2%) | 0.96 |
| School B | 30 / 50 | 60.0% | 0.85 | 52.7% (40.0%–65.3%) | 1 |
| School C | 150 / 250 | 60.0% | 0.97 | 58.4% (52.3%–64.3%) | 1 |
School A assessed fewer learners than κ, so it puts a weight of only 0.37 on its own share, and its estimate is 28.5%, with a 95% interval of 8.8% to 54.2% that reaches below the national share. School B keeps a weight of 0.85 and is estimated at 52.7% (40.0% to 65.3%). School C, with a weight of 0.97, is estimated at 58.4% (52.3% to 64.3%), close to its raw share.
The last column is the probability that each school’s underlying rate is above the national share: 0.96 for School A, and 1.00 and 1.00 for Schools B and C after rounding. School A counts as very likely above the national share (a probability of more than nineteen in twenty) even though its interval reaches below it, because only a small part of its probability lies below the national share. The same raw share is a reason to look closer in School A and a well-measured result in School C.
Why ranking schools by raw share misleads
Lists of the schools with the highest share of struggling readers are a common way to target help. Ranked by raw share, such a list leans toward small schools, because they reach extreme shares by chance most easily. Ranked by the estimate, a school needs both a high share and enough learners to make it believable.
Among the hundred schools with the highest raw shares, 30 assessed fewer than 30 learners and the median school assessed 52. Among the hundred with the highest estimates, only 10 did, and the median school assessed 79. Neither list is published here.
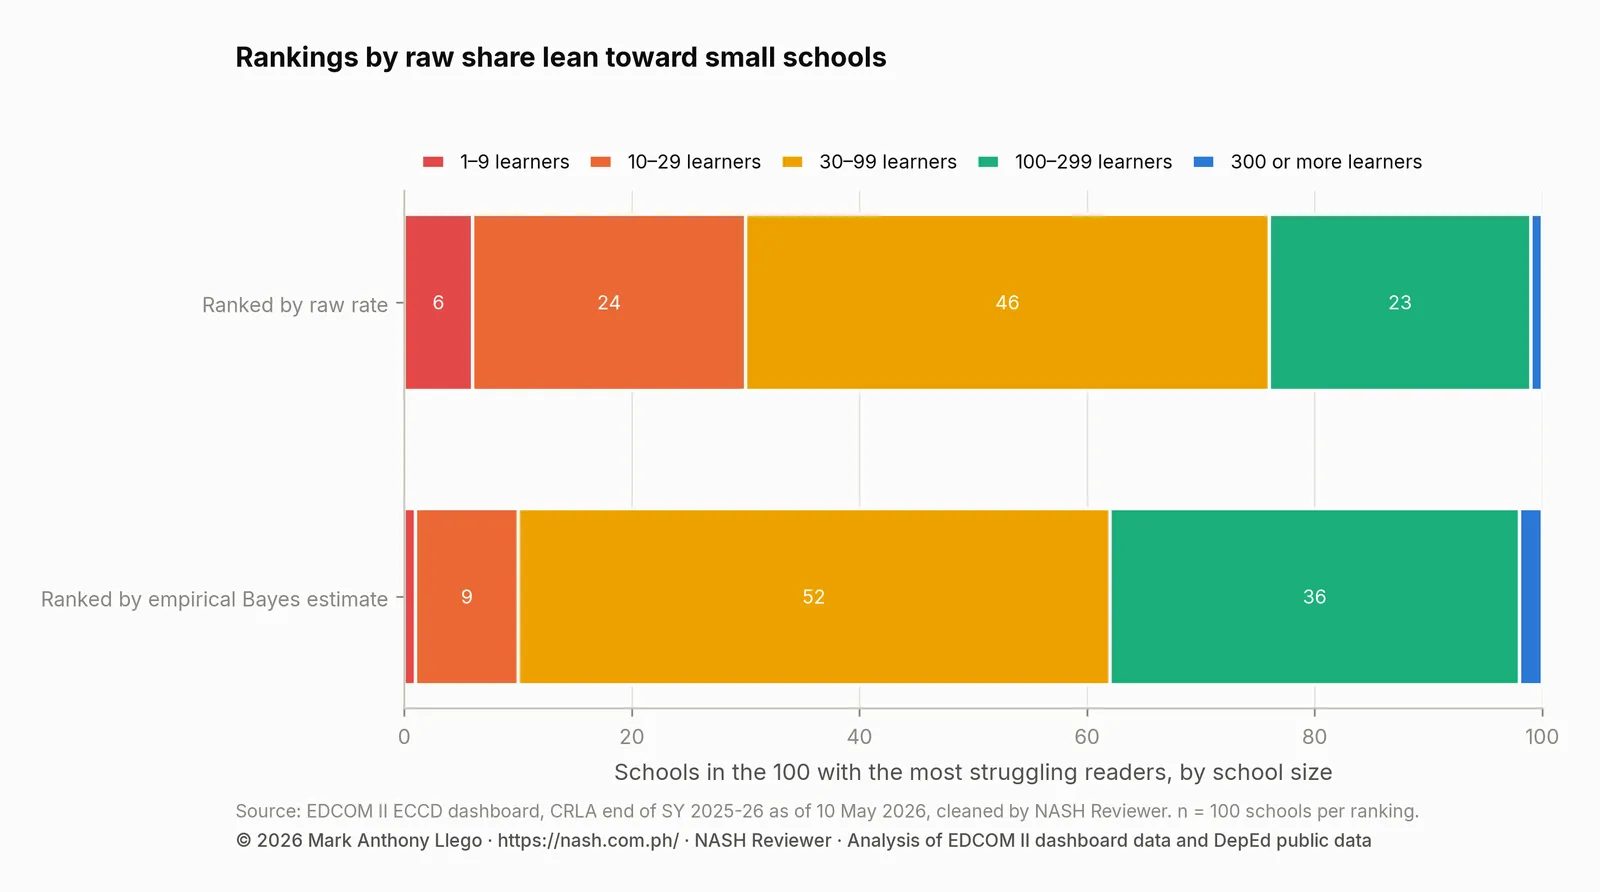
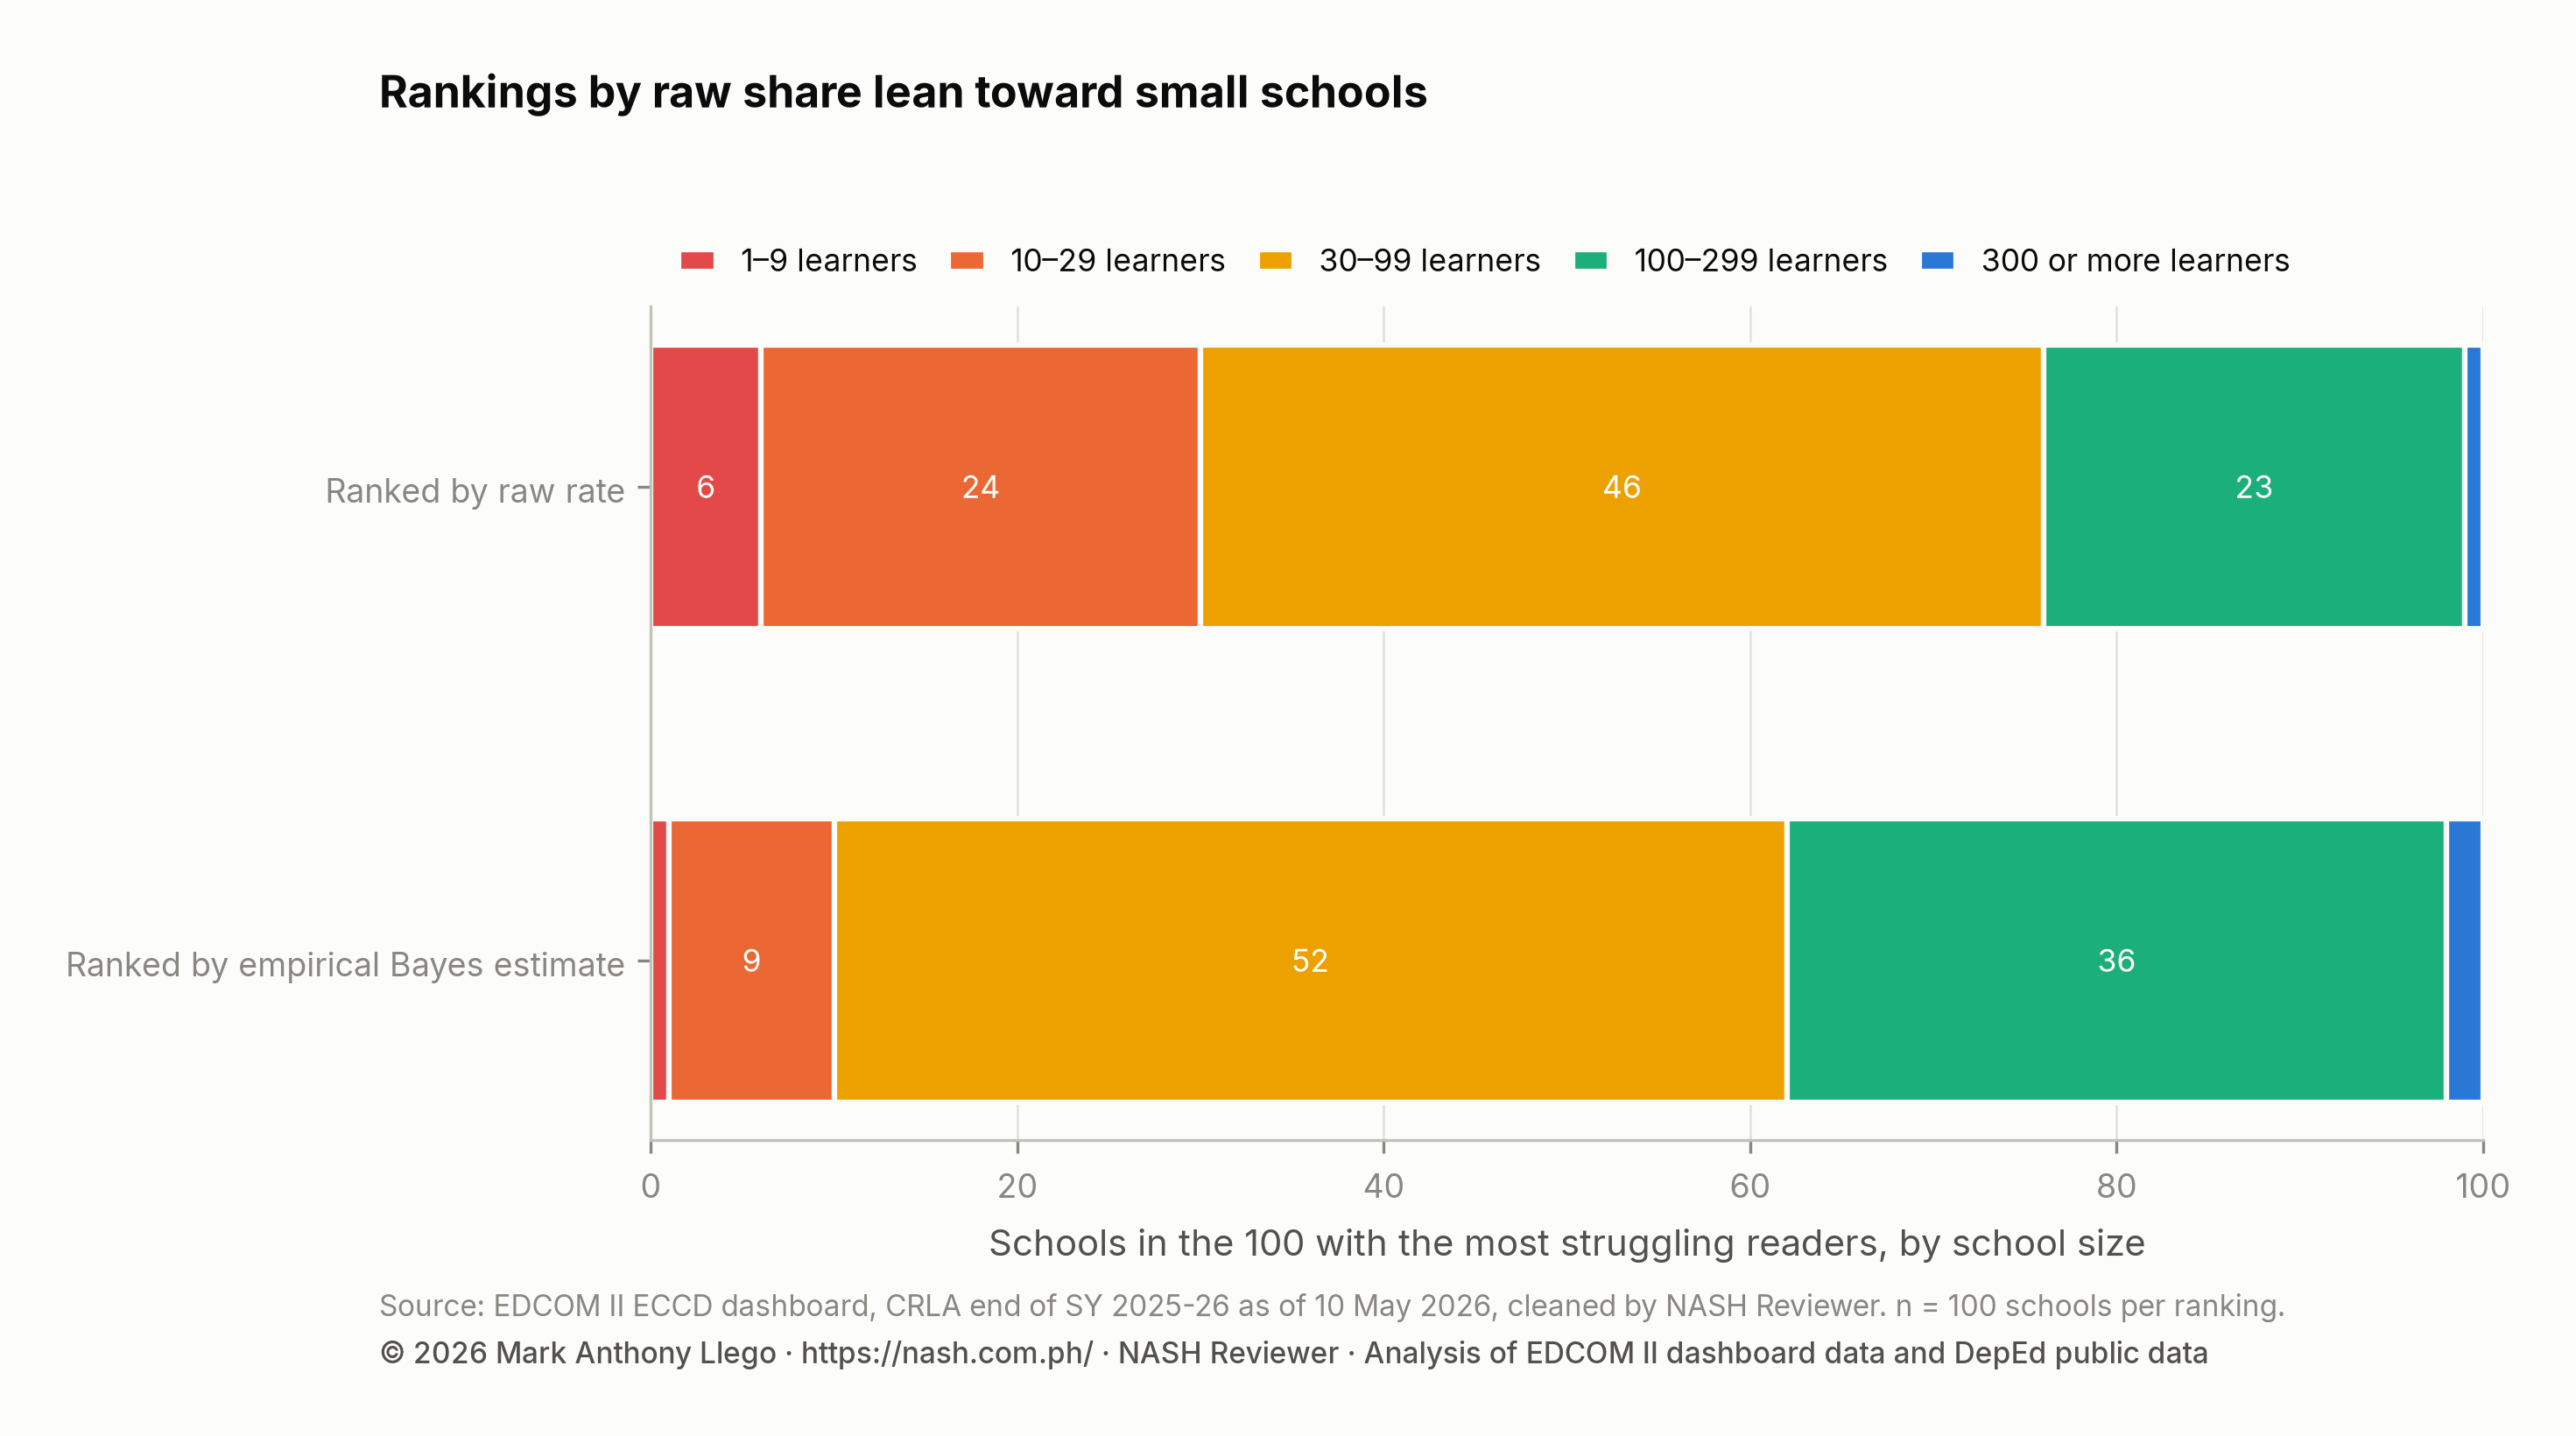
The table gives the same counts by size band.
| Ranking | 1–9 | 10–29 | 30–99 | 100–299 | 300 or more |
|---|---|---|---|---|---|
| Ranked by raw rate | 6 | 24 | 46 | 23 | 1 |
| Ranked by empirical Bayes estimate | 1 | 9 | 52 | 36 | 2 |
Reading the funnel plot of CRLA school results
A funnel plot shows every school’s share of struggling readers against the number of learners it assessed, with lines marking how far a school of each size usually strays from the national share. A school outside the lines is unusual for its size.
The dashed lines are the 95% limits: a school that follows the national pattern has about a one in forty chance of lying above the upper one. The solid lines are the 99.8% limits, whose upper line such a school would cross about one time in a thousand. Because a school’s count of struggling readers is a whole number, the chance at each school size is not exactly those rates, so the expected counts below add up the exact chance for every school. The limits use the national concentration, κ = 6.5, so they allow for the ordinary differences between schools as well as chance, and they level off instead of closing in on the national share.
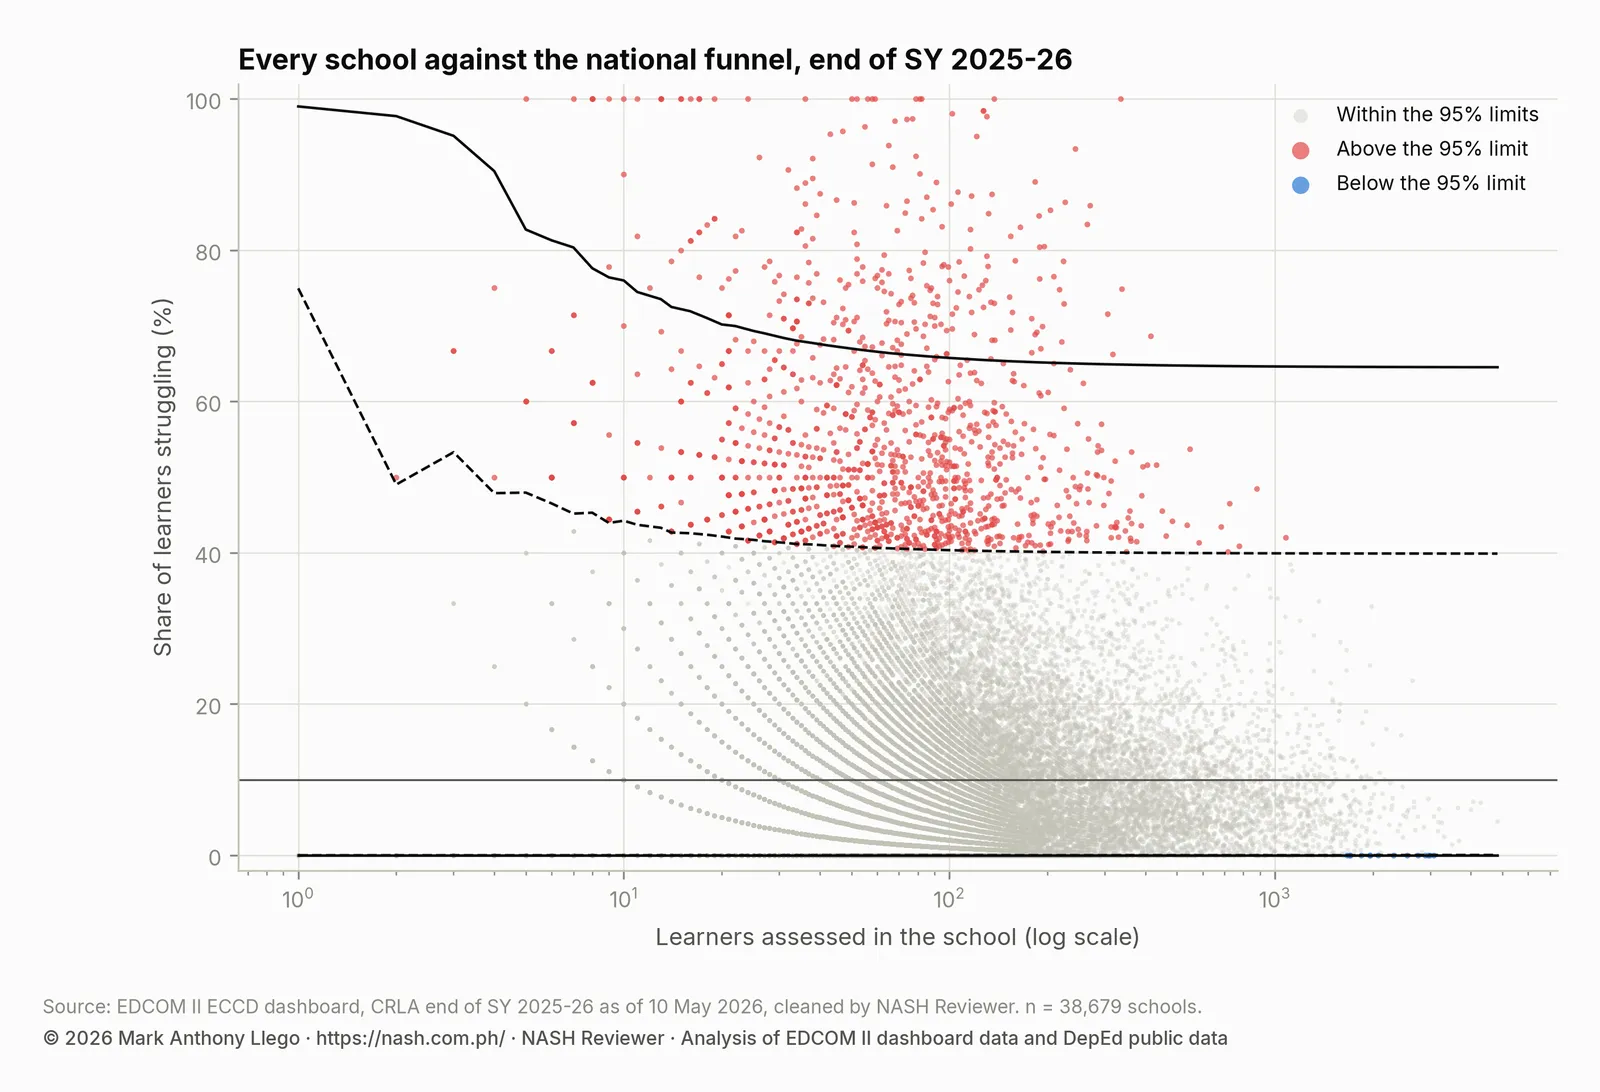
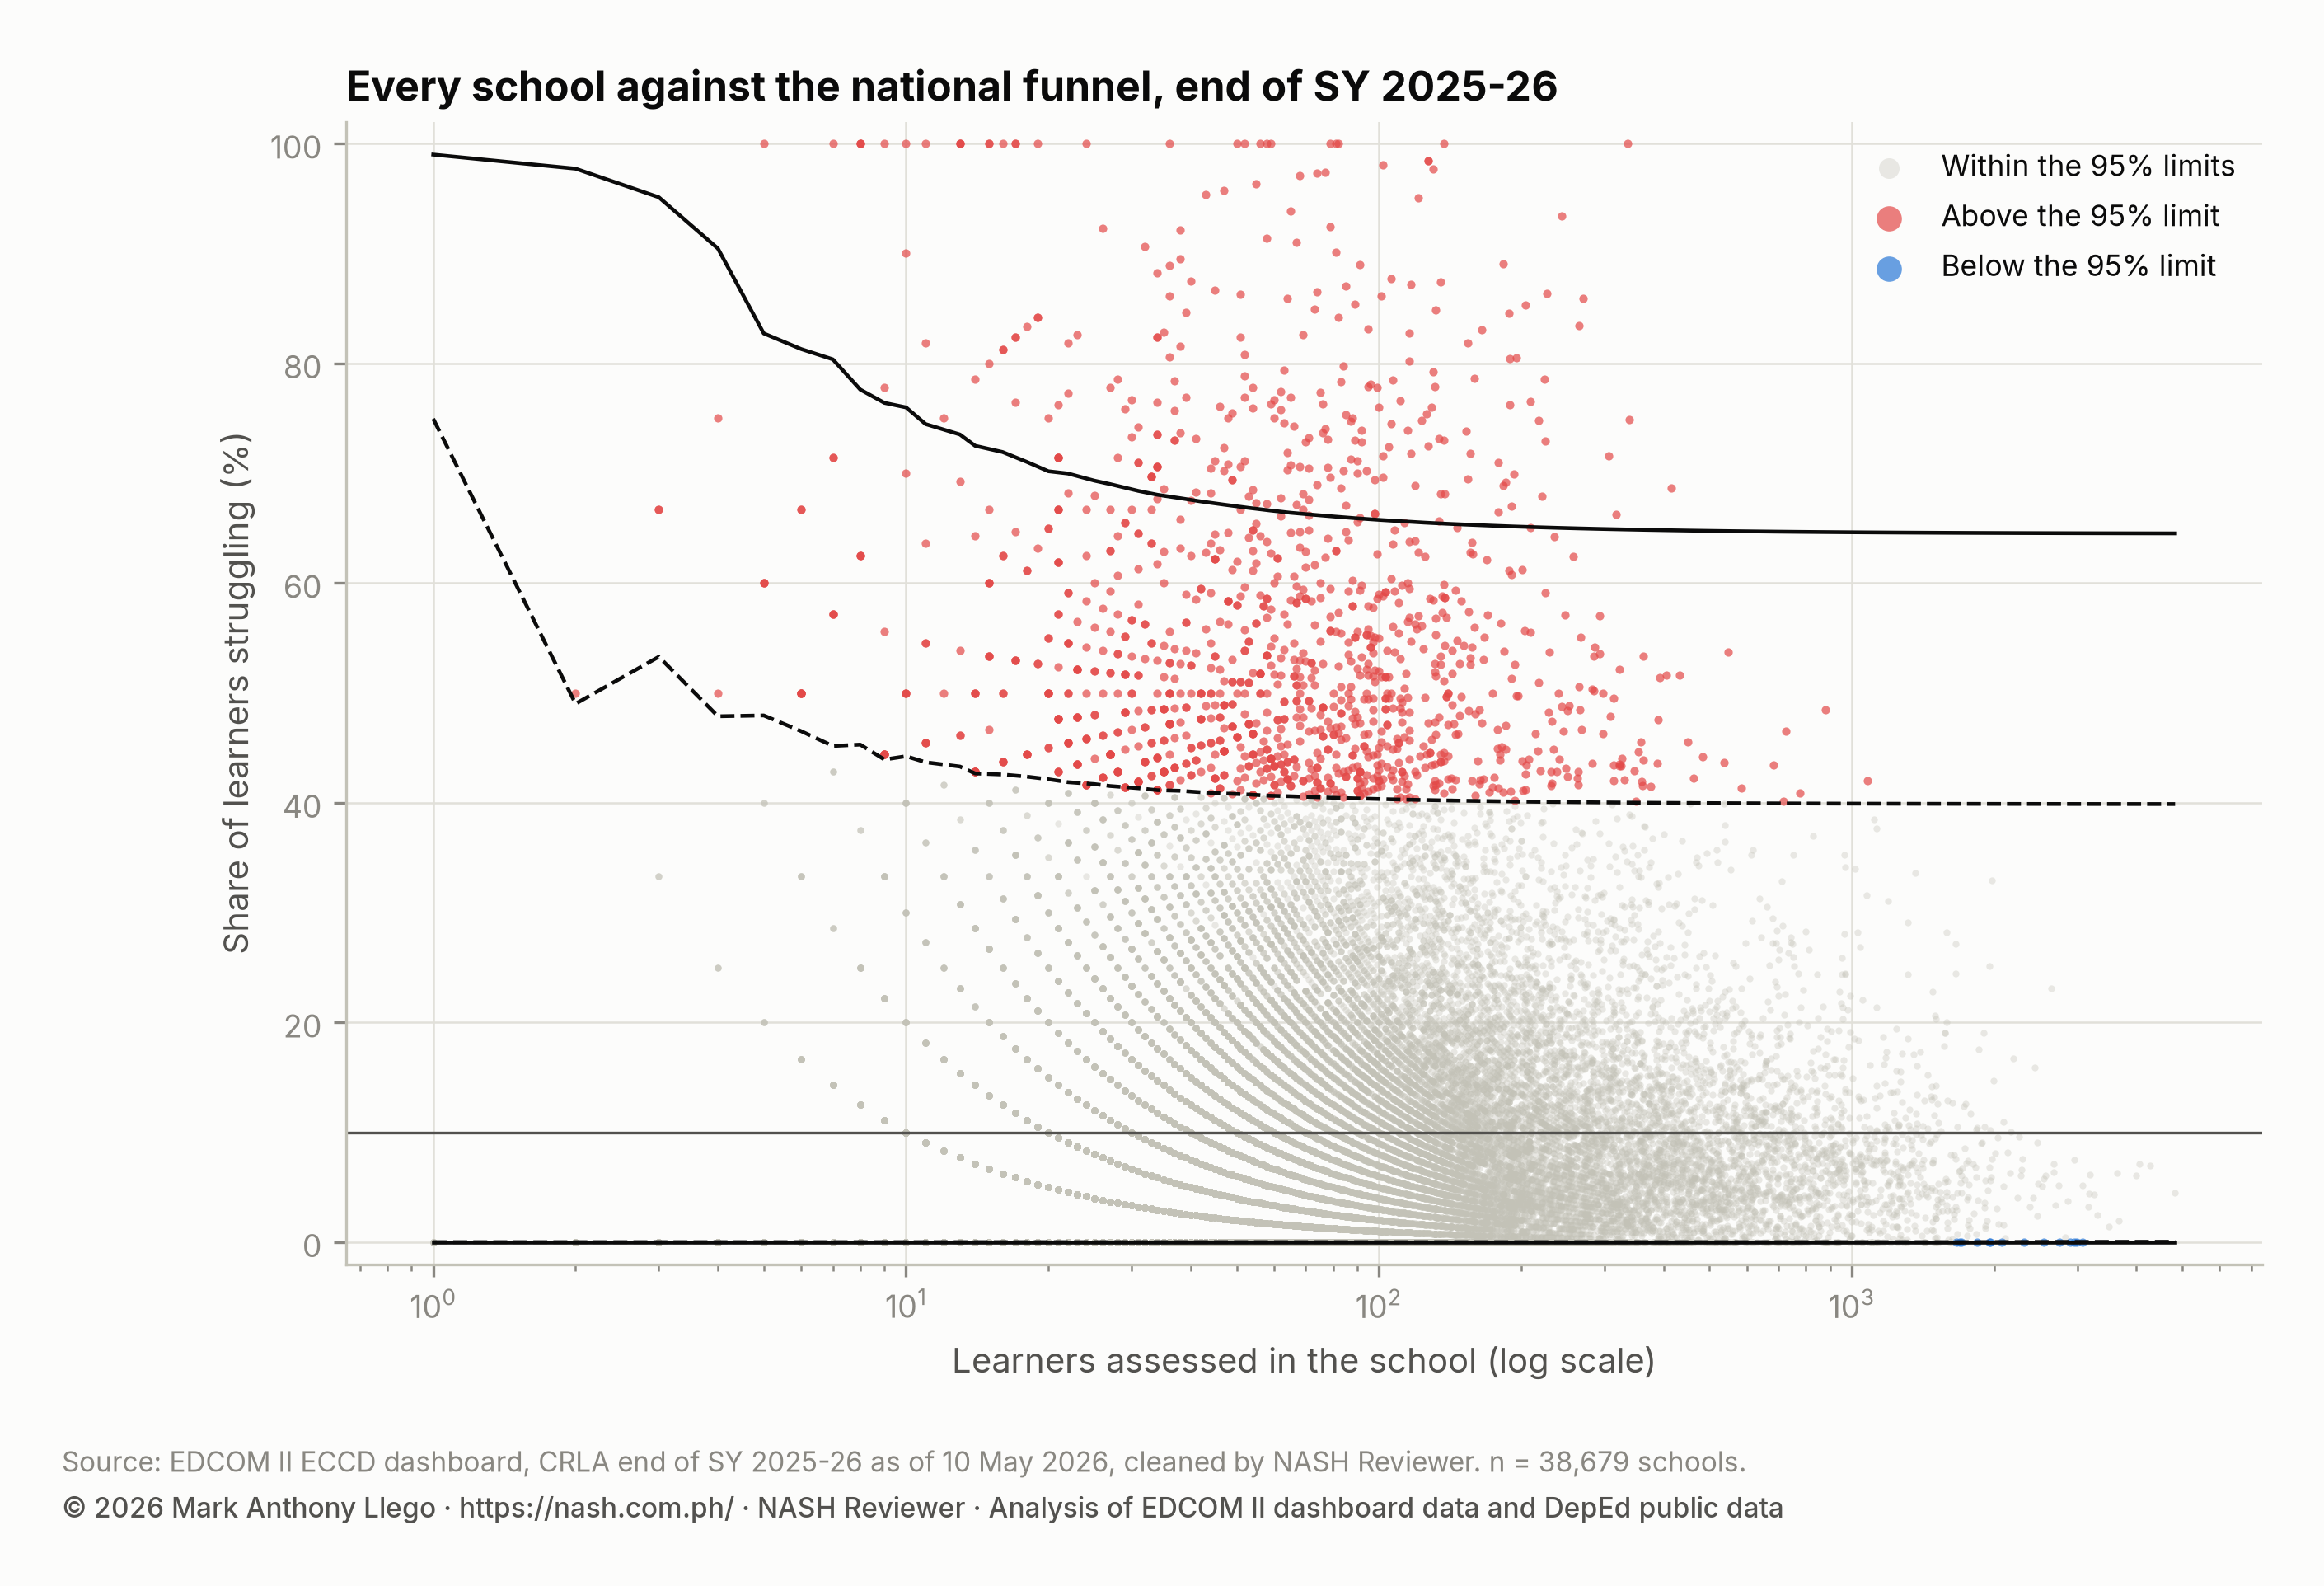
In all, 254 schools lie above the 99.8% limit, where about 48 would be expected by chance. Counting both bands, 1,281 lie above the 95% limit, against about 1,091 expected. Only 14 schools fall below the 95% limit and 0 below the 99.8% limit: because the national share is low and schools vary widely, the lower limits sit at or just above zero.
With thousands of schools, some will cross any line by chance. The Benjamini–Hochberg procedure sets a stricter bar, so that false alarms are expected to make up no more than one in twenty of the schools it flags (a 5% false discovery rate). At that bar, 74 schools are flagged: 74 with high shares and 0 with low shares. The table counts, for each region, the schools beyond each limit and those flagged at FDR 5%.
| Region | Schools | Above the 99.8% limit | Above the 95% limit (all) | Below the 95% limit (all) | Flagged at FDR 5% |
|---|---|---|---|---|---|
| BARMM | 1,469 | 106 | 315 | 0 | 36 |
| CAR | 1,500 | 0 | 7 | 0 | 0 |
| MIMAROPA | 1,924 | 8 | 67 | 0 | 2 |
| NCR | 520 | 0 | 2 | 13 | 0 |
| NIR | 1,742 | 4 | 29 | 0 | 1 |
| Region I | 2,409 | 3 | 28 | 0 | 0 |
| Region II | 2,212 | 3 | 32 | 0 | 1 |
| Region III | 3,024 | 12 | 58 | 0 | 1 |
| Region IV-A | 2,754 | 0 | 16 | 1 | 0 |
| Region IX | 2,310 | 30 | 149 | 0 | 11 |
| Region V | 3,162 | 4 | 88 | 0 | 1 |
| Region VI | 2,433 | 1 | 22 | 0 | 0 |
| Region VII | 2,189 | 4 | 29 | 0 | 0 |
| Region VIII | 3,656 | 6 | 64 | 0 | 0 |
| Region X | 2,176 | 7 | 53 | 0 | 3 |
| Region XI | 1,749 | 26 | 89 | 0 | 10 |
| Region XII | 1,744 | 35 | 178 | 0 | 7 |
| Caraga | 1,706 | 5 | 55 | 0 | 1 |
The region with the most schools above the 99.8% limit is BARMM (106). Because the funnel compares every school with the national share, schools in regions where struggling readers are common cross it more often, so these flags reflect the region’s level as well as the school’s; Where Struggling Readers Are Concentrated maps those regions and divisions. A flag is a reason to look closer, not a verdict. The funnel cannot tell teaching apart from learners’ backgrounds or a recording problem.
Checking the estimates with a full hierarchical Bayesian model
Empirical Bayes treats each region’s share and κ as known, although both are estimated, and it ignores divisions. As a check, a full hierarchical Bayesian model (school within division within region) was fitted; it estimates the variation at each level and carries its uncertainty into every school’s estimate.
The two methods agree closely. The correlation between their school estimates is 0.996; the median difference is 0.4 percentage points, and nine schools in ten differ by no more than 1.5 points. They give the same verdict on whether a school is very likely above the national share for 99.0% of schools.
The model also shows how variation splits across levels, on the log-odds scale it works on. The standard deviation is 1.21 (95% interval 1.20 to 1.23) for schools within a division, 0.70 (95% interval 0.63 to 0.77) for divisions within a region and 0.54 (95% interval 0.35 to 0.80) for regions. Schools in the same division differ more than divisions or regions do; the division and region intervals overlap, so the data cannot say for sure which of those two varies more. CRLA Variation: School, Division or Region? takes this further.
The Markov chain Monte Carlo (MCMC) sampler ran on the whole model but kept only its shared parameters (the overall level, the region and division effects, and the standard deviations), and each school’s posterior was rebuilt from every kept draw with a normal (Laplace) approximation. The diagnostics for the shared parameters were clean: the largest R-hat was 1.004, below the 1.01 threshold, so the sampler’s independent runs agree, and the smallest effective sample size was 524, above 400.
A posterior predictive check asks whether data simulated from the model look like the real data. Among schools with 30 or more learners, the standard deviation of observed shares is 12.3 points and the model’s simulations give 12.3 to 12.4, so the spread is reproduced. Schools with no struggling reader are not: 22.1% of schools report none, while the model predicts 15.5% to 16.1%. Part of the gap likely reflects the model’s shape, which allows few schools with an underlying rate very close to zero; CRLA Schools With No Struggling Readers: A Data Check examines these zeros.
What this means for school heads
A fair reading protects small schools from being judged on noise and points support where it is most needed. School heads, supervisors and division teams can use this checklist:
- Read the estimate and its interval, not only the raw share. A wide interval means the result could sit anywhere in that range; plan for the range.
- Check the probability above the national share. A probability near one or near zero is a clear signal; one in the middle means this year’s data cannot tell.
- Compare with the funnel. A school outside the limits deserves a closer look at its learners, its records and how the screen was given.
- Compare within the region. Funnel flags are drawn against the national share, so schools in high-share regions cross them more often. The estimate already starts from the region’s share.
- Look at several years. One year of a small school is one noisy draw; a pattern that repeats is far more informative.
- Never rank small schools by raw share. Rank by the estimate, or group schools by size before comparing them.
- Use the download. The school estimates file below has every school’s raw share, estimate, 95% interval, probability above the national share and funnel flag, with the full Bayes estimate beside it.
How these numbers were made
The data cover public schools in the 18 regions, with Sulu in Region IX and the Negros Island Region as its own region. National and regional shares are population values and carry no sampling intervals.
The empirical Bayes estimates use a beta-binomial model in each region: the prior mean is the region’s pooled share and κ is fitted by maximum likelihood. Each school’s 95% interval and its probability above the national share come from 4,000 draws of its beta posterior. “Very likely above” means a probability of more than nineteen in twenty, and “very likely below” less than one in twenty. The worked example uses the national share as its prior mean and the median regional κ. “The largest schools” means the top size band of the rankings table.
The funnel uses beta-binomial limits around the national share with the national κ and Spiegelhalter’s interpolation between whole counts. Each school’s two-sided p-value comes from the same distribution, and the Benjamini–Hochberg procedure was applied at q = 0.05. In the rankings, ties on raw share put the larger school first, so the count of small schools in the raw ranking is, if anything, understated.
The hierarchical model is binomial on the log-odds scale, with normal effects for regions, divisions within regions and schools within divisions (school effects are centered within each division, so the division effect carries the division’s level), sampled with the No-U-Turn Sampler in four chains.
Limits
These estimates cover one school year. A single year cannot separate a lasting pattern from a passing one.
The CRLA is a teacher-administered screen, not a test given under identical conditions everywhere. Differences in how and when it was given add to differences between schools, and no model here can separate them from reading itself.
The estimates assume that schools in a region are exchangeable apart from their data: before its results are seen, every school in the region is treated alike. A school with features the model does not know about, such as many learners new to the school, is pulled toward a regional share that may not suit it.
The results describe schools, not individual children. A high estimate says a school has a large share of struggling readers, not why.
Frequently asked questions
Why is my school’s CRLA estimate different from its actual share?
The estimate combines your school’s own share with your region’s share, with more weight on your own share the more learners you assessed. A small school’s estimate is pulled toward the region because its own share is noisy. A large school’s estimate stays close to its raw share.
Is a high share of struggling readers in a small school a cause for concern?
It is a reason to look closer, not a conclusion. If the interval is wide and the probability above the national share is middling, this year’s data cannot tell. Look at the learners’ individual results and at earlier years first.
What does it mean if my school is above the funnel limit?
Its share is higher than the national pattern would usually produce in a school of its size, even after allowing for ordinary differences between schools. Some schools above the limit are there by chance, which is why the stricter FDR 5% flag is also reported. Schools in high-share regions cross the limit more often.
Where can I find my school’s CRLA estimate?
The school estimates file in the download below lists every school with its raw share, estimate, 95% interval, probability above the national share and funnel flags. This guide names no school; the file lets each school head read their own result.
Download the data
The cleaned EDCOM II dashboard data behind this series are free to download for personal study; to reuse them, email support@nash.com.ph for written permission first. How the EDCOM Dashboard Data Was Cleaned explains every table and cleaning rule. The files are at data.nash.com.ph: start with the README, then the school table with CRLA results and school inputs (Parquet), the school estimates (CSV), the division estimates (CSV) and the municipal table (CSV). The DepEd school files used for school inputs are described in Download Cleaned DepEd School Data.
Every file, with its rows, columns and checksum, is listed on the EDCOM II CRLA data page. To cite the data: Llego, M. A. (2026). EDCOM II early-childhood dashboard data, cleaned, version 1. NASH Reviewer. https://nash.com.ph/edcom-data
More in this series
- CRLA End-of-Year Results SY 2025-26: All 18 Regions
- CRLA Start vs End of SY 2025-26 in the Same Schools
- CRLA by Language: Mother Tongue, Filipino and English
- How to Read a School’s CRLA Results Fairly
- CRLA Variation: School, Division or Region?
- Where Struggling Readers Are Concentrated
- School Resources and CRLA Reading Results
- CRLA Results in Schools With and Without a Principal
- Action Research and Thesis Topics on Reading (CRLA)
- CRLA Reading Hotspots: A Map of Struggling Readers
- Stunting, Day Care Centers and Early Reading
- Literacy and Nutrition Programs Compared With Need
- CRLA Schools With No Struggling Readers: A Data Check
- How the EDCOM Dashboard Data Was Cleaned
- Regional reports: NCR, CAR, Region I, Region II, Region III, Region IV-A, MIMAROPA, Region V, Region VI, NIR, Region VII, Region VIII, Region IX, Region X, Region XI, Region XII, Caraga, BARMM
- Earlier reports: CRLA Results SY 2025-2026 (DepEd’s selected-school file), Do the Same DepEd Schools Lag on the ELLNA, NAT and CRLA?, DepEd School Inputs vs Test Results, EDCOM II Final Report: Guide for Aspiring School Heads, DepEd Data for Aspiring School Heads: Where to Start
Analysis and charts by Mark Anthony Llego for NASH Reviewer. Data: EDCOM II early-childhood dashboard and Department of Education public datasets. NASH Reviewer is not affiliated with EDCOM II or DepEd. Charts may be reused only with written permission from support@nash.com.ph.