CRLA results in MIMAROPA Region at the end of SY 2025-26 place the region a little behind the country. Of the 186,639 public school learners assessed in Grades 1–3, 11.4% were struggling readers, against 10.0% nationally, and 44.4% read at grade level, against 47.6%. MIMAROPA ranks 13 of the 18 regions, counting from the lowest share of struggling readers, and its 21,230 struggling readers are 4.1% of the national total.
The regional figure hides a wide gap between islands. Palawan and Occidental Mindoro carry high shares of struggling readers, while Romblon, Marinduque and Calapan City sit well below the national figure. The region also records far more stunting among its youngest children than the country does. The data are Comprehensive Rapid Literacy Assessment (CRLA) results for public schools, as of 10 May 2026, from the EDCOM II early-childhood (ECCD) dashboard.
Key findings
- MIMAROPA’s struggling share, 11.4% of 186,639 assessed learners at the end of SY 2025-26, sits +1.4 percentage points from the national 10.0%.
- Grade 3 English is the block furthest behind the country: 43.4% of Grade 3 learners read English at grade level, against 50.1% nationally, and Grade 3 Filipino is also behind, at 47.5% against 50.8%.
- Division shares run from Romblon (3.8%) to Palawan (15.5%), and the divisions furthest below the regional share are Calapan City (6.3%); Marinduque (6.4%); Romblon (3.8%).
- On the municipal map, 4 municipalities form low-low clusters, all of them in Romblon, and 0 form high-high clusters.
- OPT Plus 2025 found 10.6% of the 87,771 children aged 0–2 measured in MIMAROPA stunted, against 4.3% nationally, with the highest share in Oriental Mindoro (13.3%).
- Within the same division, schools with more learners per teacher or per classroom, and schools with multigrade classes, have more struggling readers, while larger schools, schools with electricity or internet and schools in fourth-class municipalities have fewer; 7 inputs have an interval that excludes 1, and the multigrade association has no counterpart in the national model.
- 34.2% of MIMAROPA schools have a School Principal, against 40.7% nationally; as reported, schools with one have 9.5% struggling readers and schools without one 13.5%.
Reading levels by grade and language in MIMAROPA
The CRLA, a rapid reading assessment given by teachers, places each learner at one of five levels: Low Emerging, High Emerging, Developing, Transitioning and At Grade Level. A struggling reader is a learner at either Emerging level. The table gives the share at each level for the five grade-and-language blocks, with all learners in MIMAROPA and in the Philippines.
| Grade and language | Learners | Low Emerging | High Emerging | Developing | Transitioning | At Grade Level | Struggling |
|---|---|---|---|---|---|---|---|
| Grade 1 Mother Tongue | 59,972 | 12.0% | 4.7% | 12.7% | 28.4% | 42.2% | 16.7% |
| Grade 2 Mother Tongue | 62,539 | 5.9% | 1.9% | 8.7% | 36.1% | 47.3% | 7.8% |
| Grade 2 Filipino | 61,425 | 5.8% | 1.8% | 8.8% | 36.0% | 47.5% | 7.7% |
| Grade 3 Filipino | 64,552 | 4.2% | 1.6% | 7.0% | 39.7% | 47.5% | 5.8% |
| Grade 3 English | 65,242 | 6.9% | 3.0% | 9.8% | 36.9% | 43.4% | 9.9% |
| MIMAROPA, all learners | 186,639 | 8.2% | 3.2% | 10.4% | 33.9% | 44.4% | 11.4% |
| Philippines, all learners | 5,127,670 | 6.9% | 3.1% | 10.4% | 32.0% | 47.6% | 10.0% |
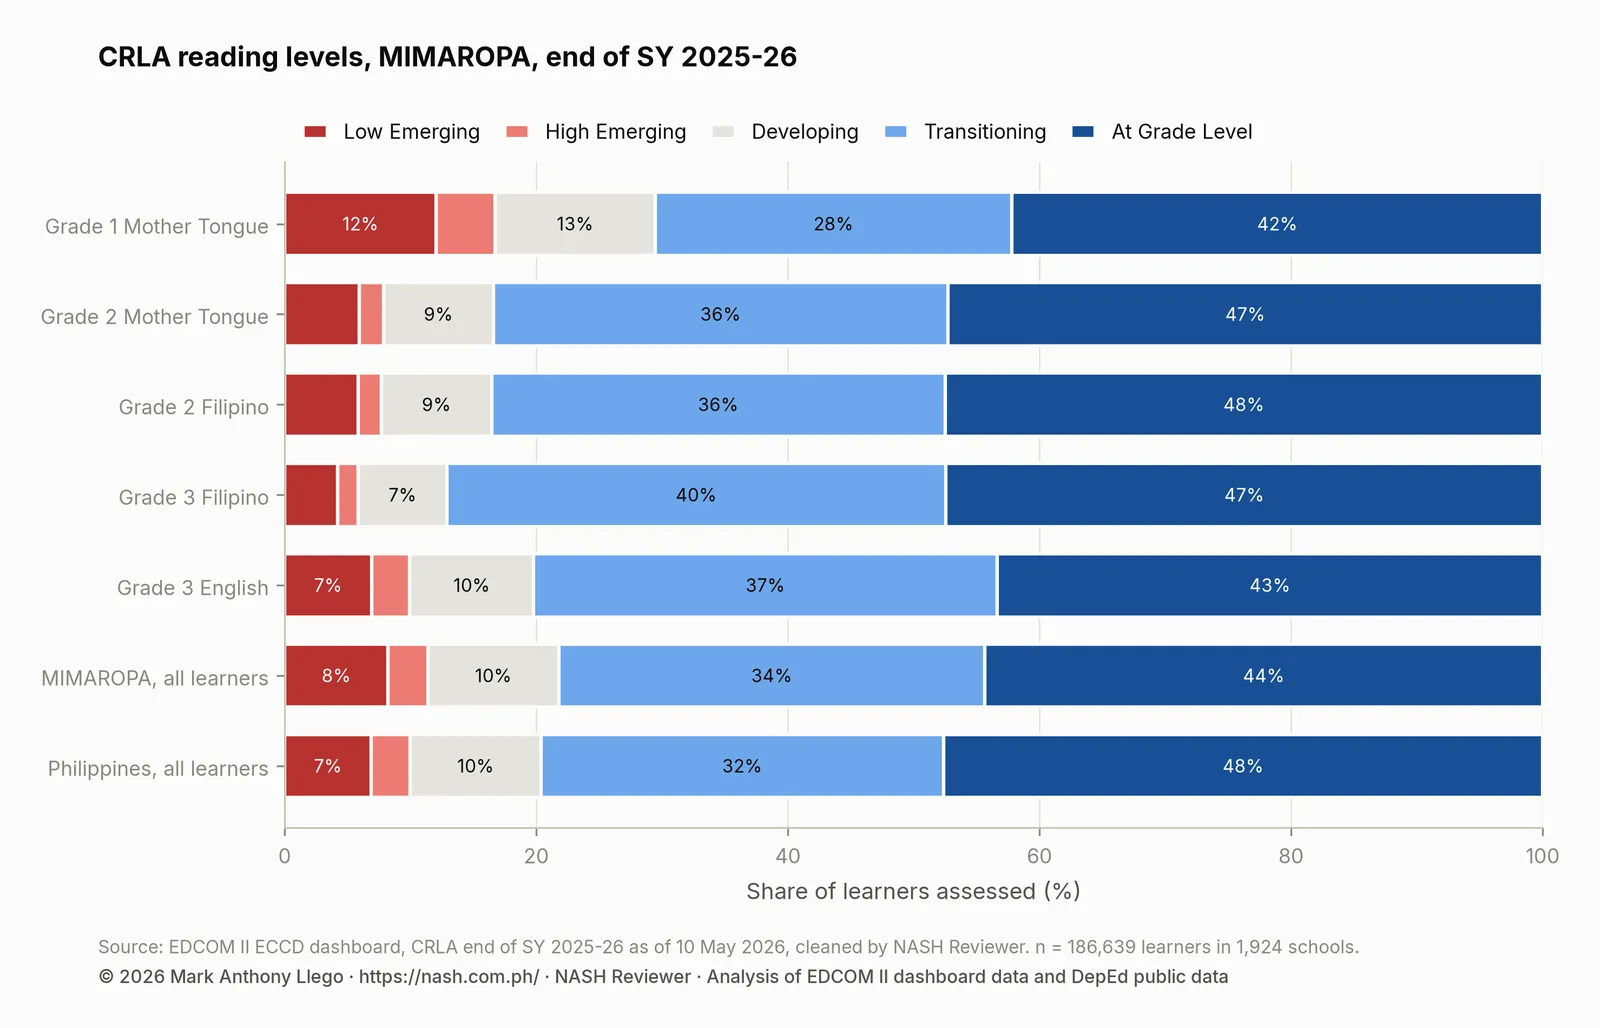
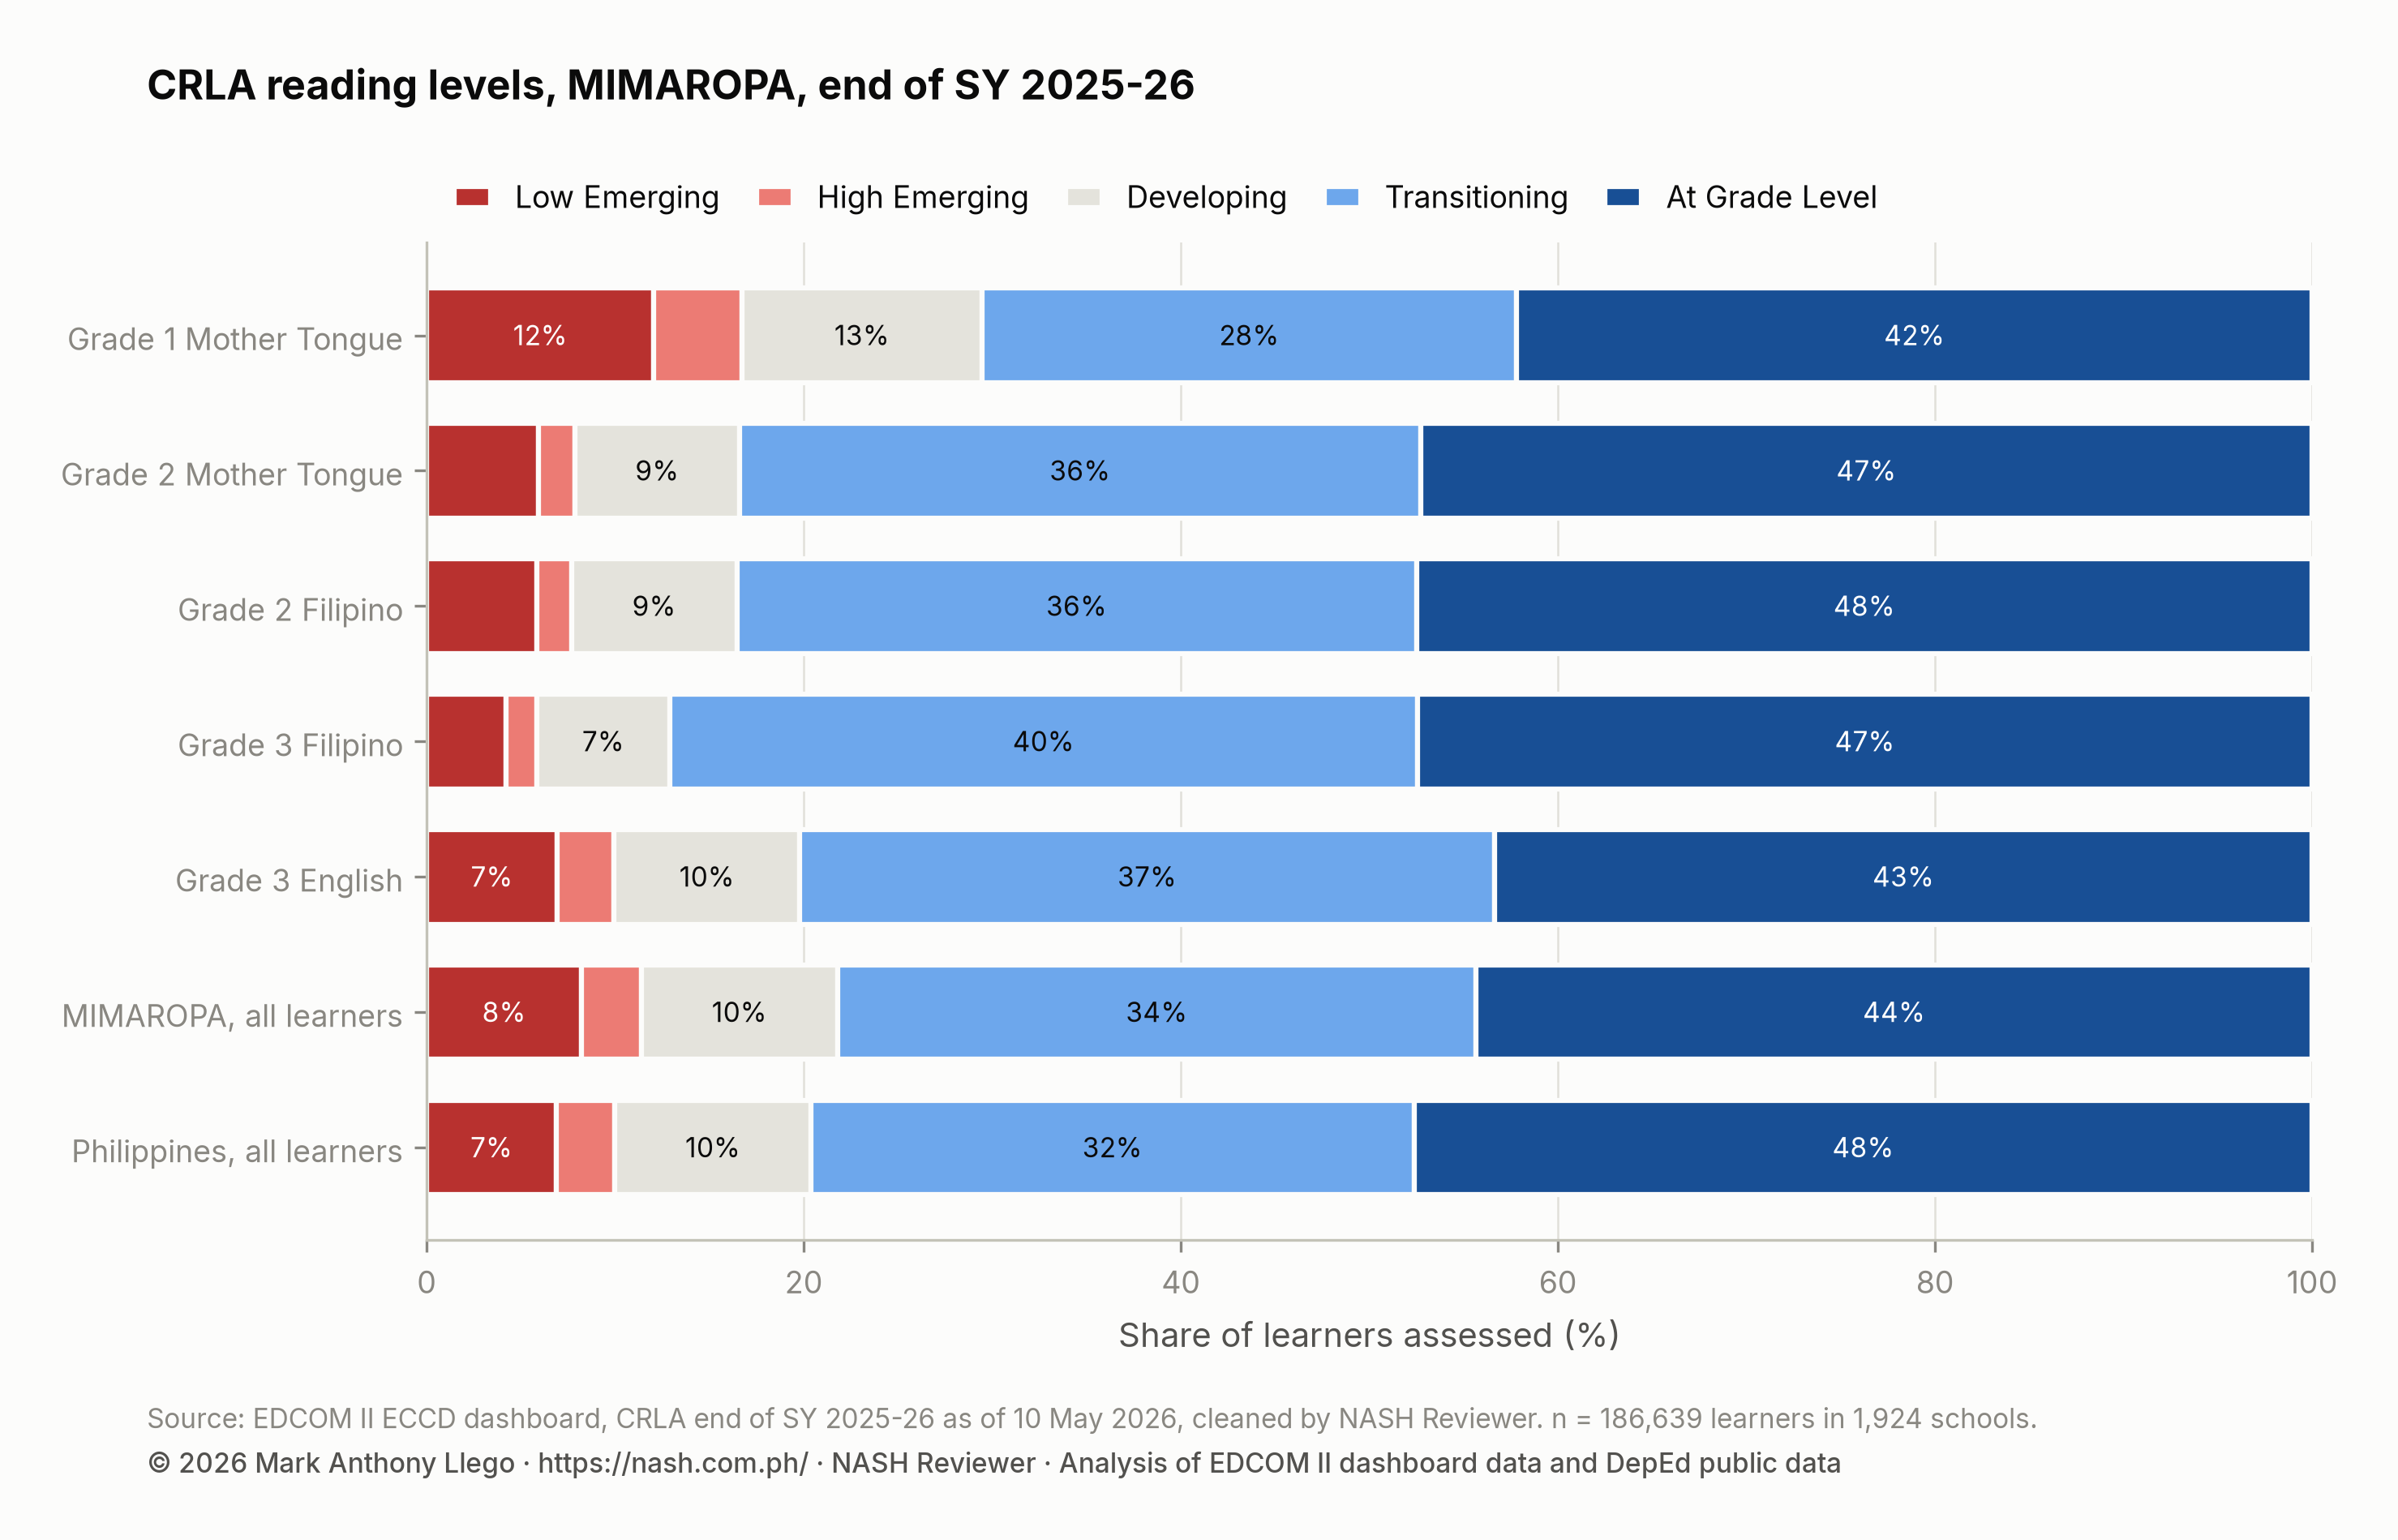
Grade 1 Mother Tongue holds the region’s highest share of struggling readers, 16.7%, against 14.4% nationally, and 12.0% of Grade 1 learners are still at Low Emerging. By Grade 2 the region is close to the country. The block most above the national share at grade level is Grade 2 Filipino (+0.5 points), and Grade 2 Mother Tongue sits just below its national share.
Grade 3 is where MIMAROPA falls behind. At grade level, Grade 3 Filipino stands at 47.5% against 50.8%, and Grade 3 English at 43.4% against 50.1%, a gap of -6.7 points. Each grade holds different learners assessed at the same time, so this shows where the gaps are now, not how they grew.
Schools divisions in MIMAROPA
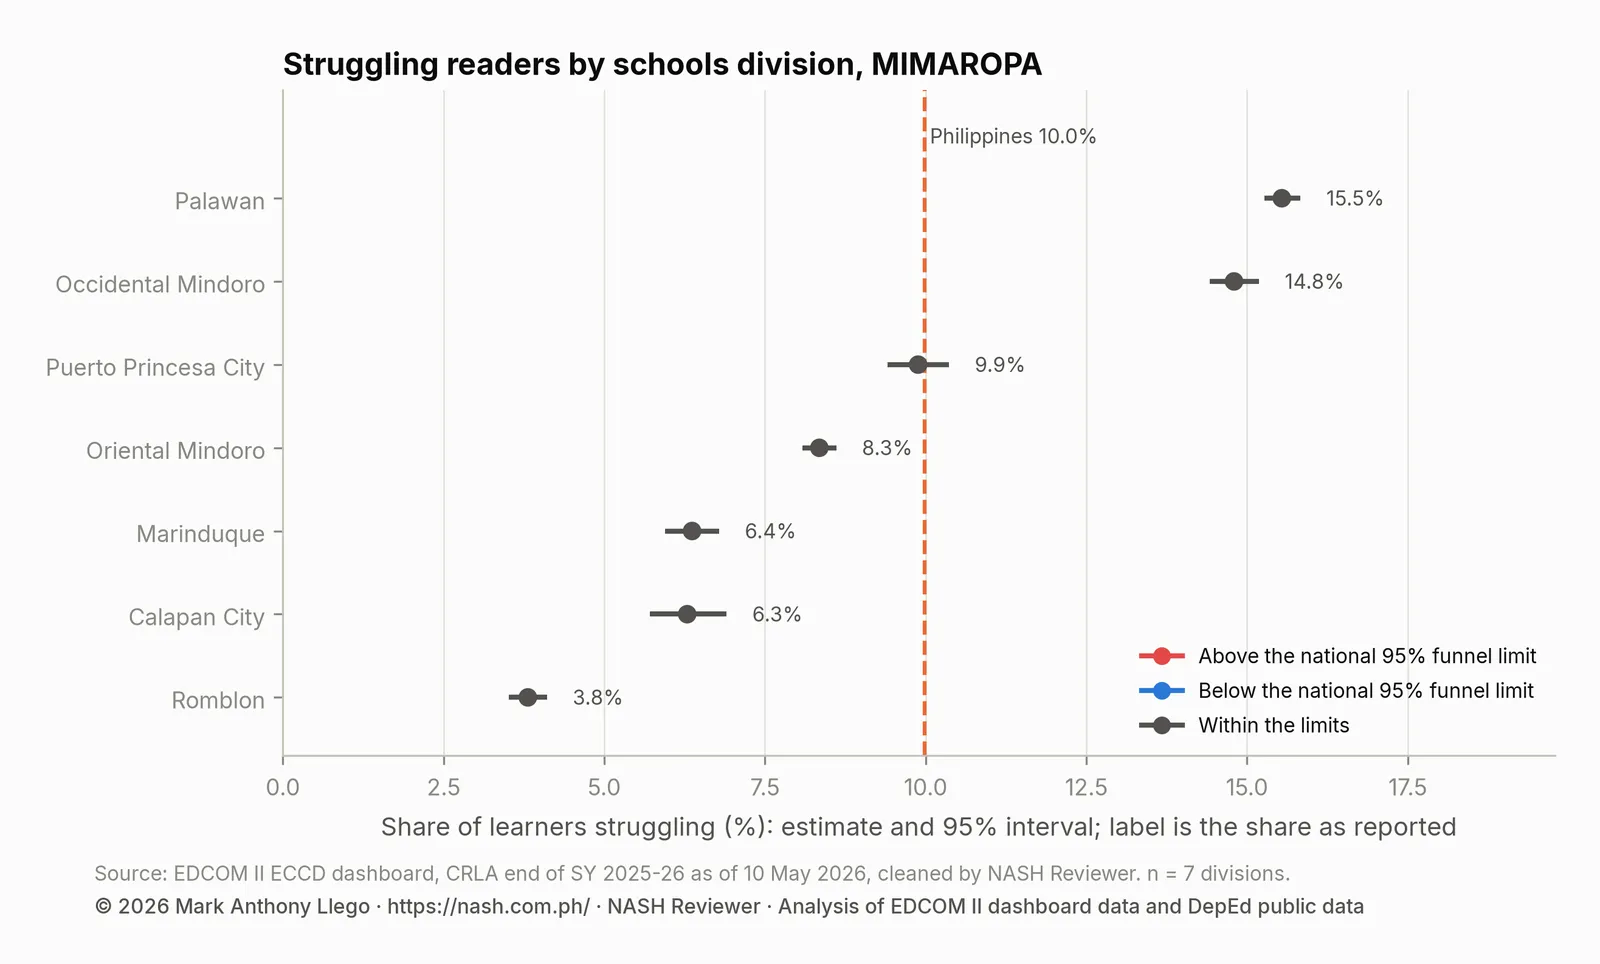
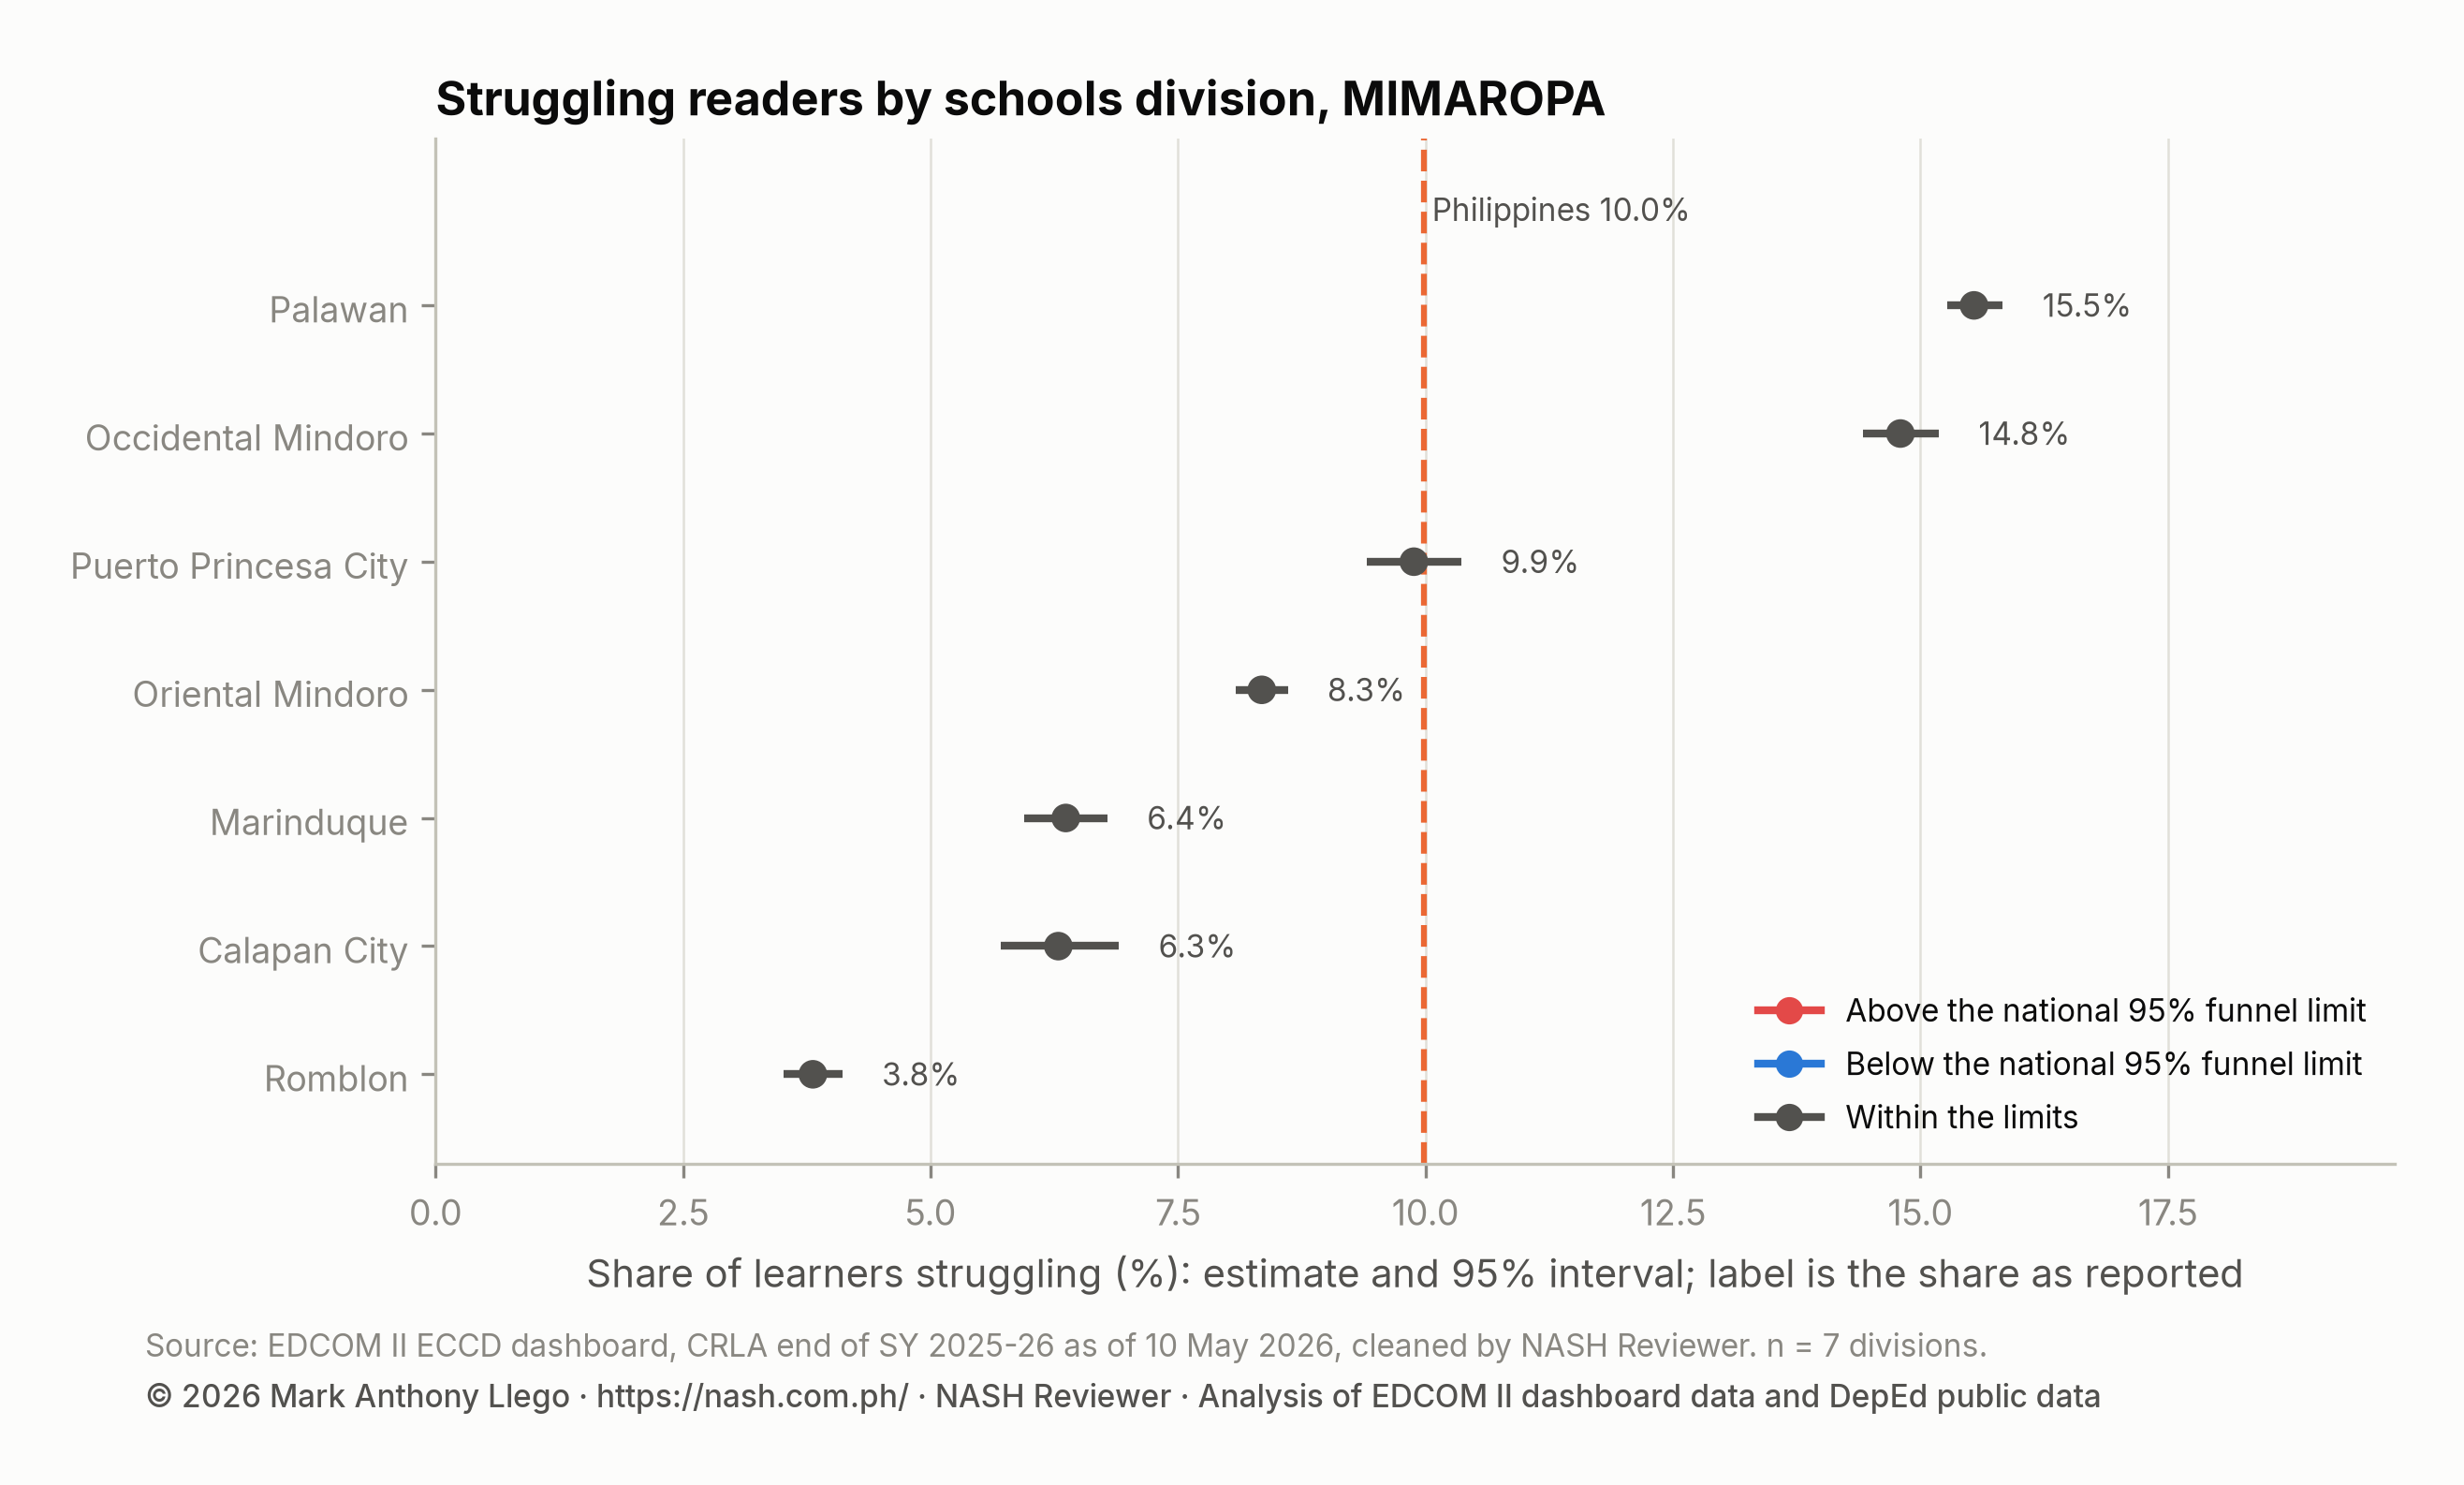
MIMAROPA’s 1,924 public schools with results belong to 7 schools divisions, including the city divisions of Calapan and Puerto Princesa. The table gives each division’s struggling readers, an empirical Bayes estimate of its share with a 95% interval, and its rank among the 232 divisions. Empirical Bayes pulls a share slightly toward the national rate, and pulls a small division such as Calapan City more than Palawan, so chance swings do not decide a rank.
| Division | Schools | Learners | Struggling readers | Share struggling | Estimate (95% interval) | National rank of 232 (95% interval) | National funnel |
|---|---|---|---|---|---|---|---|
| Calapan City | 49 | 6,487 | 407 | 6.3% | 6.3% (5.7%–6.9%) | 58 (50–72) | within limits |
| Marinduque | 183 | 12,521 | 796 | 6.4% | 6.4% (5.9%–6.8%) | 59 (52–70) | within limits |
| Occidental Mindoro | 307 | 33,275 | 4,925 | 14.8% | 14.8% (14.4%–15.2%) | 205 (200–208) | within limits |
| Oriental Mindoro | 436 | 41,731 | 3,482 | 8.3% | 8.3% (8.1%–8.6%) | 103 (96–112) | within limits |
| Palawan | 656 | 61,500 | 9,559 | 15.5% | 15.5% (15.3%–15.8%) | 210 (208–211) | within limits |
| Puerto Princesa City | 75 | 14,441 | 1,427 | 9.9% | 9.9% (9.4%–10.4%) | 145 (135–153) | within limits |
| Romblon | 218 | 16,684 | 634 | 3.8% | 3.8% (3.5%–4.1%) | 24 (21–31) | within limits |
From Palawan to Romblon
The division range runs from Romblon (3.8%) at the bottom to Palawan (15.5%) at the top. The division with the most struggling readers is Palawan (9,559 struggling readers), with Occidental Mindoro close behind in share, while Puerto Princesa City sits near the national figure. The divisions furthest below the regional share are Calapan City (6.3%); Marinduque (6.4%); Romblon (3.8%).
The national funnel compares each division with the spread expected among divisions of its size, and the number of MIMAROPA divisions beyond its 95% limits is 0. Palawan’s share is high but still inside the normal spread between Philippine divisions.
Languages of instruction
RA 12027 of 2024 discontinued the mother tongue as the medium of instruction in Kindergarten to Grade 3 outside monolingual classes that meet the law’s requirements, but the SY 2025-26 CRLA still assessed Grades 1 and 2 in the Mother Tongue, the school’s reported language. In MIMAROPA one language dominates: Tagalog (99% of schools). The table gives the share struggling and at grade level for each language used in enough schools to report.
| Language of instruction | Schools | Learners | Share struggling | At Grade Level |
|---|---|---|---|---|
| Tagalog | 1,914 | 185,760 | 11.4% | 44.4% |
Because Filipino is based on Tagalog, the two Grade 2 assessments ask much the same of most MIMAROPA learners. In schools that report both, the share at grade level in Filipino minus the share in the Mother Tongue is +0.0 points, against -0.8 nationally. For how other languages fare against Filipino, see CRLA by Language.
Where struggling readers are concentrated in MIMAROPA
Each of MIMAROPA’s 73 municipalities and cities takes its color from an empirical Bayes estimate of its struggling share, placed on the seven classes of the national map. It is a picture of towns and cities, not of individual learners.
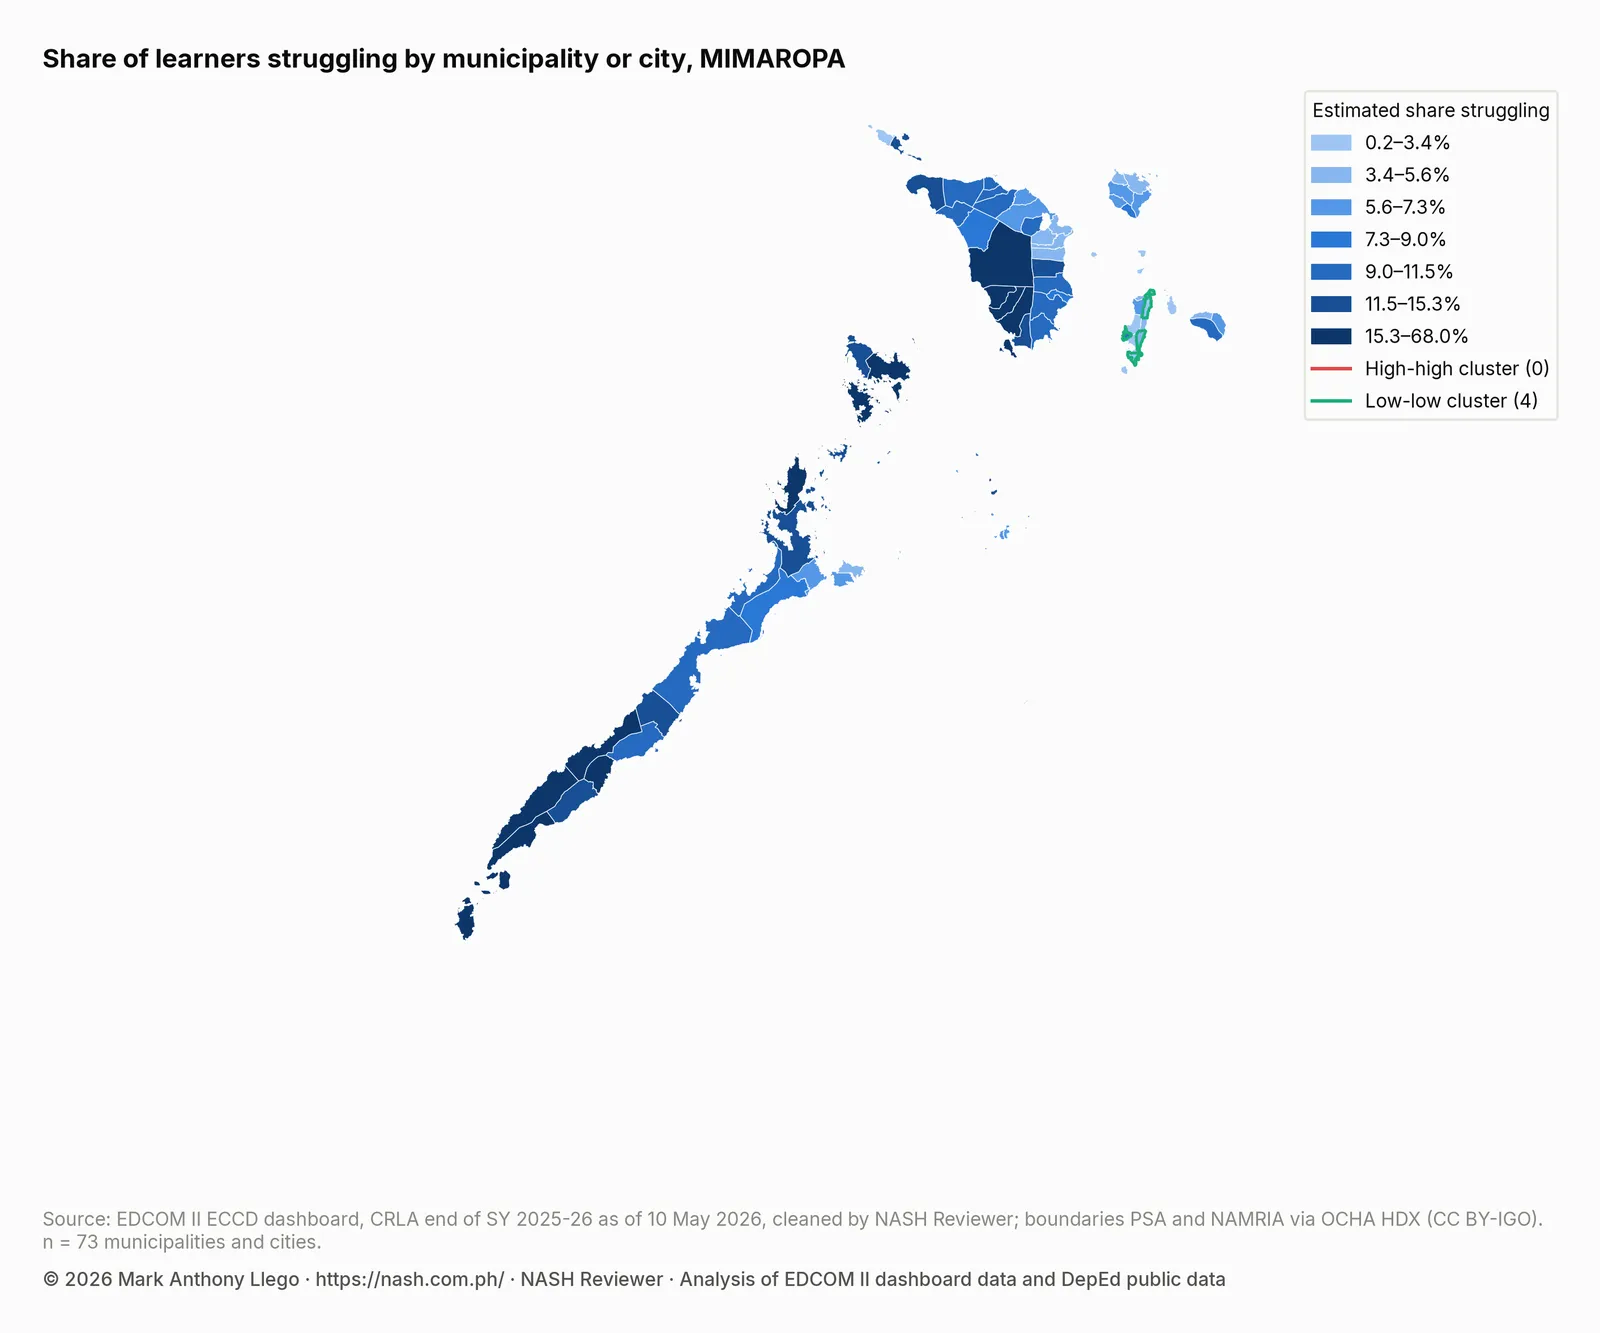
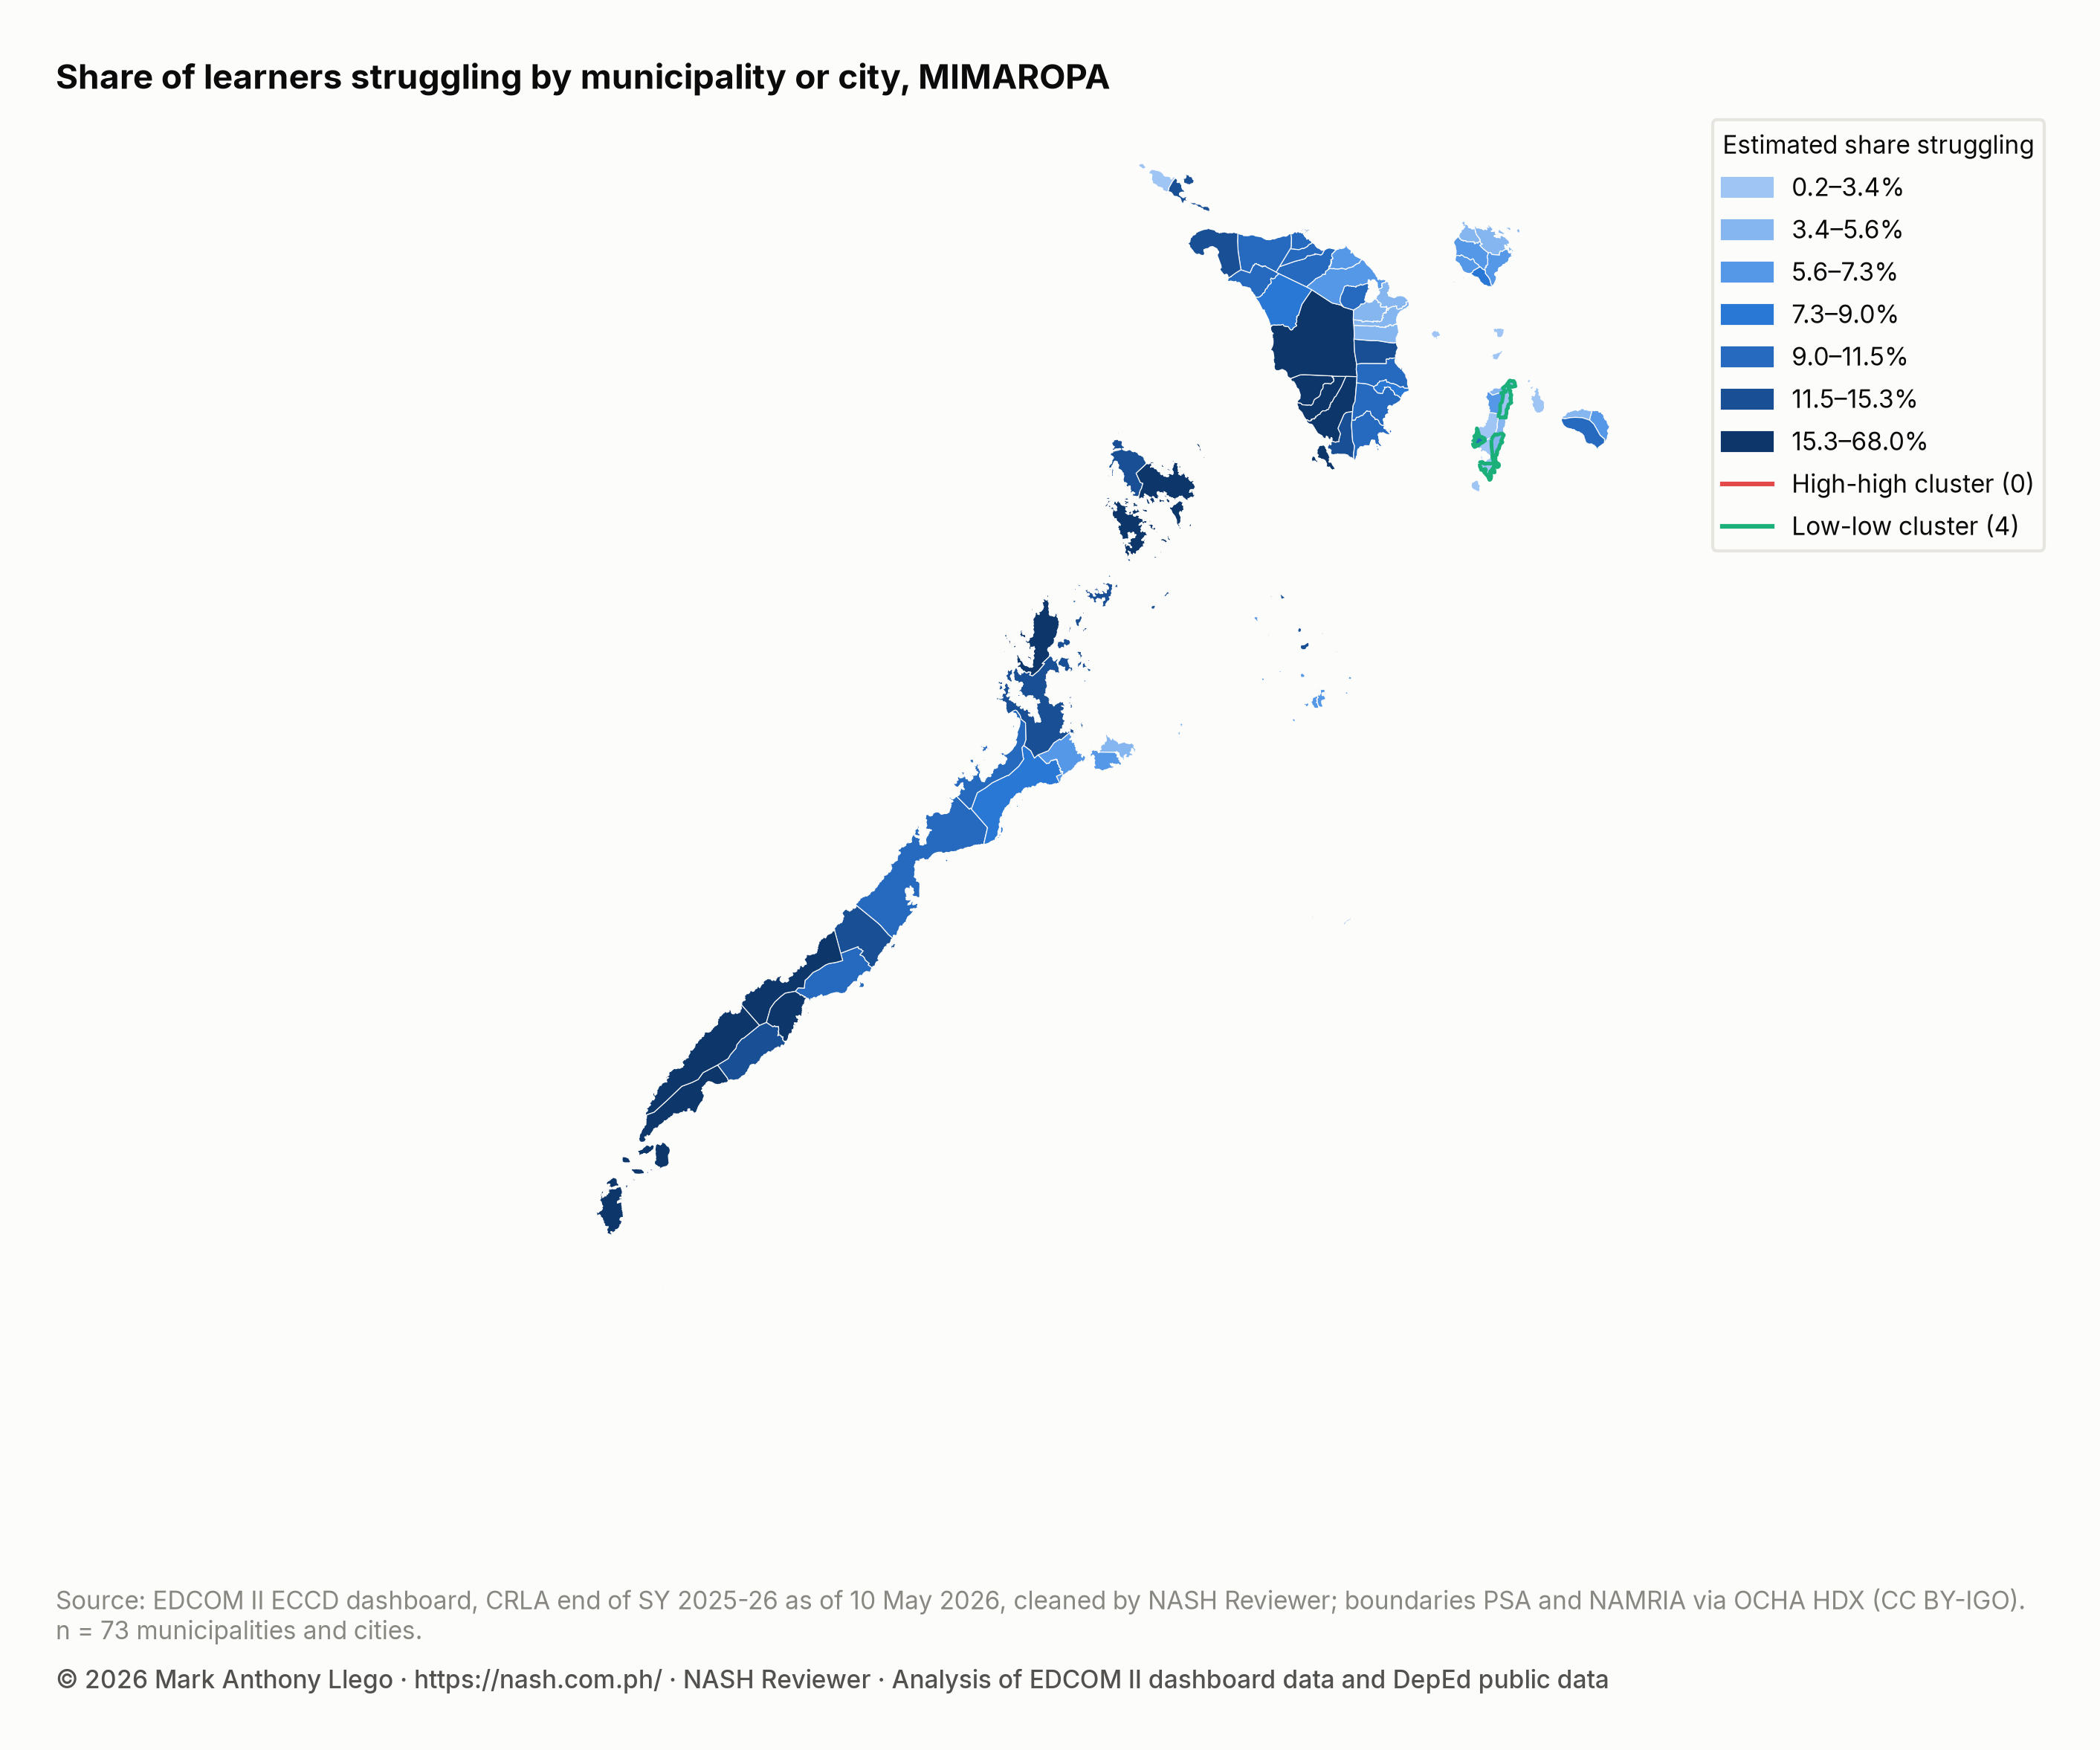
Ranked by count, San Jose in Occidental Mindoro comes first: San Jose, Occidental Mindoro (1,737); Puerto Princesa City (Capital), Palawan (1,427); Rizal (Marcos), Palawan (1,298); Bataraza, Palawan (1,284); Sablayan, Occidental Mindoro (880). It outnumbers Puerto Princesa City although it has fewer learners. Ranked by estimated share instead, the top places are mostly Palawan towns: Rizal (Marcos), Palawan (27.4%); Sofronio Española, Palawan (22.7%); Rizal, Occidental Mindoro (21.9%); El Nido (Bacuit), Palawan (21.2%); Bataraza, Palawan (19.7%).
A cluster test, local Moran’s I at FDR 5% (a false discovery rate that limits false alarms across many places), asks whether neighbors are more alike than chance would produce. It finds 0 high-high and 4 low-low clusters, the low-low ones all in Romblon. Palawan’s high shares do not form a cluster the test can separate from chance.
Early childhood: stunting and day care centers
A child is stunted when too short for their age, a mark of long-term undernutrition. In Operation Timbang Plus (OPT Plus) 2025, the yearly weighing of young children reported to the National Nutrition Council, 10.6% of the 87,771 children aged 0–2 measured in MIMAROPA were stunted, against 4.3% nationally. Alongside stunting, the province table counts barangays without a child development center (CDC) and gives each province’s share of struggling readers.
| Province or highly urbanized city | Children 0–2 measured | Stunted | Barangays without a CDC | Learners struggling |
|---|---|---|---|---|
| Marinduque | 5,040 | 6.3% | 18 of 218 | 6.4% |
| Occidental Mindoro | 16,830 | 13.0% | 25 of 164 | 14.8% |
| Oriental Mindoro | 20,320 | 13.3% | 21 of 426 | 8.1% |
| Palawan | 37,881 | 9.2% | 29 of 433 | 14.5% |
| Romblon | 7,700 | 7.7% | 3 of 219 | 3.8% |
Stunting is at least half again the national share in every province but Marinduque: Occidental Mindoro (13.0%); Oriental Mindoro (13.3%); Palawan (9.2%); Romblon (7.7%). Day care coverage is better than nationally: on the DILG list, 96 of 1,460 barangays (6.6%) have no CDC, against 10.9%.
These are different children: the toddlers measured in 2025 are not the learners in Grades 1–3, and Oriental Mindoro, with the highest stunting, has a lower share of struggling readers than the region as a whole. Stunting, Day Care Centers and Early Reading asks whether the two measures move together across the country’s municipalities.
School resources
The school inputs below are DepEd’s SY 2023-24 figures, recorded two school years before this assessment. For learners per teacher and per classroom the table gives the median school; the other rows are shares of schools.
| School input (SY 2023-24) | MIMAROPA | Philippines |
|---|---|---|
| Learners per teacher (elementary) | 23.4 | 22.8 |
| Learners per classroom (elementary) | 25.4 | 25.8 |
| Schools with internet | 68.1% | 76.3% |
| Schools with electricity | 95.1% | 97.6% |
| Schools with a water supply | 94.8% | 97.8% |
| Schools with no functional toilet | 2.0% | 2.3% |
| Schools with multigrade classes | 19.7% | 15.3% |
Learners per teacher and per classroom are close to the national medians, but only 68.1% of schools report internet, against 76.3%, and electricity and water trail slightly. Multigrade classes are more common than nationally, at 19.7% of schools against 15.3%.
The region’s own model compares schools within the same division, so the gap between Palawan and Romblon does not drive it, and it widens its intervals because school results vary more than a simple binomial model expects. An odds ratio above 1 means higher odds of struggling readers, below 1 lower. Read off MIMAROPA’s model, the inputs with a 95% interval that excludes 1 are learners per teacher: odds ratio 1.24 (1.15–1.33); learners per classroom: odds ratio 1.09 (1.02–1.16); school size: odds ratio 0.78 (0.72–0.84); electricity: odds ratio 0.79 (0.63–0.98); internet: odds ratio 0.90 (0.81–0.997); multigrade classes: odds ratio 1.20 (1.02–1.40); income class 4th: odds ratio 0.71 (0.51–0.99). Ratio and size inputs are per standard deviation on a log scale, and income class is set against first-class municipalities.
Most of these match the national model: within a division, schools with more learners per teacher or per classroom have more struggling readers, and larger schools and schools with electricity or internet have fewer. Multigrade classes are where MIMAROPA departs from it: here schools offering them have more struggling readers, while the national interval includes 1. Schools in fourth-class municipalities also have fewer, which may reflect differences the model does not measure, and for several inputs the interval only barely excludes 1. All of them are associations within divisions.
School heads
In DepEd’s SY 2023-24 personnel file, 34.2% of MIMAROPA schools report a School Principal position, against 40.7% nationally. Another 26.8% have no head position, so a teacher-in-charge or officer-in-charge runs them. Before any adjustment, the struggling share is lower where there is a principal, 9.5%, than where there is none, 13.5%.
Schools with a principal tend to be larger and better connected, so the gap may reflect those differences; CRLA Results in Schools With and Without a Principal compares similar schools.
Programs recorded in MIMAROPA
The EDCOM II dashboard lists programs run by NGOs and corporate foundations, 8 of them in MIMAROPA. By category they are Nutrition (7); Childcare (1). By type they are Supplementary Feeding (0-2yo) (4); Nutrition Counseling for Mothers (2); Child Development Center (CDC) Establishment (1); Growth Monitoring & Weighing (1). None is a literacy program.
MIMAROPA’s share of the listed programs, 8.0%, is larger than its share of the country’s struggling readers, 4.1%. The list is not a census of partner programs; Literacy and Nutrition Programs Compared With Need compares every region.
What this means for school heads in MIMAROPA
For school heads in Palawan and Occidental Mindoro, Grade 1 is the place to start: struggling readers are most common there, and small-group reading can reach them early. Across the region, Grade 3 English deserves a second look.
Heads of small and multigrade schools should read their results with care, because a few learners can swing a small school’s share. With stunting this common, ties with barangay nutrition scholars and child development workers are worth building before learners reach Kindergarten.
How these numbers were made
Each learner is counted once: Grade 1 in the Mother Tongue, Grade 2 in Filipino and Grade 3 in English. Division estimates are beta-binomial empirical Bayes estimates with 95% intervals, and municipal shares are empirical Bayes estimates on the national scale. The input model is a binomial regression with division fixed effects whose intervals are widened for overdispersion (a quasi-binomial model). The all-region report sets out these methods in full, and How to Read a School’s CRLA Results Fairly applies them to single schools.
Limits
The CRLA is a rapid screen given by teachers, and results are as entered on the dashboard. School inputs are two years older than the reading results. Maps and province tables describe places, not children, and stunting is measured in younger children. The program list is incomplete. Every comparison is an association.
Frequently asked questions
What is MIMAROPA’s CRLA share of struggling readers?
At the end of SY 2025-26, 11.4% of MIMAROPA’s 186,639 assessed public school learners in Grades 1–3 were struggling readers, against 10.0% nationally.
Is Palawan the MIMAROPA division with the most struggling readers?
Yes. Palawan (9,559 struggling readers) is the largest group, and the division also has the region’s highest share, while Romblon (3.8%) has the lowest. Even Palawan stays inside the national funnel’s 95% limits, as does every other MIMAROPA division.
Is stunting in MIMAROPA linked to its reading results?
The region has both more stunting (10.6% against 4.3%) and more struggling readers than the country, but the two figures describe different children. This report cannot show that one affects the other.
Download the data
The cleaned EDCOM II dashboard data behind this series are free to download for personal study; to reuse them, email support@nash.com.ph for written permission first. How the EDCOM Dashboard Data Was Cleaned explains every table and cleaning rule. The files are at data.nash.com.ph: start with the README, then the school table with CRLA results and school inputs (Parquet), the school estimates (CSV), the division estimates (CSV) and the municipal table (CSV). The DepEd school files used for school inputs are described in Download Cleaned DepEd School Data.
Every file, with its rows, columns and checksum, is listed on the EDCOM II CRLA data page. To cite the data: Llego, M. A. (2026). EDCOM II early-childhood dashboard data, cleaned, version 1. NASH Reviewer. https://nash.com.ph/edcom-data
More in this series
- CRLA End-of-Year Results SY 2025-26: All 18 Regions
- CRLA Start vs End of SY 2025-26 in the Same Schools
- CRLA by Language: Mother Tongue, Filipino and English
- How to Read a School’s CRLA Results Fairly
- CRLA Variation: School, Division or Region?
- Where Struggling Readers Are Concentrated
- School Resources and CRLA Reading Results
- CRLA Results in Schools With and Without a Principal
- Action Research and Thesis Topics on Reading (CRLA)
- CRLA Reading Hotspots: A Map of Struggling Readers
- Stunting, Day Care Centers and Early Reading
- Literacy and Nutrition Programs Compared With Need
- CRLA Schools With No Struggling Readers: A Data Check
- How the EDCOM Dashboard Data Was Cleaned
- Regional reports: NCR, CAR, Region I, Region II, Region III, Region IV-A, MIMAROPA, Region V, Region VI, NIR, Region VII, Region VIII, Region IX, Region X, Region XI, Region XII, Caraga, BARMM
- Earlier reports: CRLA Results SY 2025-2026 (DepEd’s selected-school file), Do the Same DepEd Schools Lag on the ELLNA, NAT and CRLA?, DepEd School Inputs vs Test Results, EDCOM II Final Report: Guide for Aspiring School Heads, DepEd Data for Aspiring School Heads: Where to Start
Analysis and charts by Mark Anthony Llego for NASH Reviewer. Data: EDCOM II early-childhood dashboard and Department of Education public datasets. NASH Reviewer is not affiliated with EDCOM II or DepEd. Charts may be reused only with written permission from support@nash.com.ph.