Some school resources, reported two school years before the CRLA reading screen, go with more or fewer struggling readers when each public school is compared with other schools in the same division. Across 37,578 public schools, schools with more learners per teacher had more struggling readers at the end of SY 2025-26, with an odds ratio of 1.14 per standard deviation (95% interval 1.12 to 1.16). Schools with more learners per classroom and annex schools also had more. Larger schools, schools with electricity and schools with internet had fewer.
The outcome is the Comprehensive Rapid Literacy Assessment (CRLA), a reading screen that teachers give in Grades 1–3. A struggling reader is a learner at the Low Emerging or High Emerging level; nationally, 10.0% of the 5,127,670 learners counted were struggling readers. The links between inputs and reading are modest, and they are associations, not proof that adding a resource changes reading. The clearest, for learners per teacher and school size, hold in most regions.
Key findings
- The model covers 37,578 of the 38,679 public schools with CRLA results and 5,010,891 learners, and compares each school with others in the same division.
- Schools with more learners per teacher had more struggling readers: an odds ratio of 1.14 per standard deviation (95% interval 1.12 to 1.16), with a regional interval entirely above 1 in 17 of 18 regional models.
- Larger schools had fewer struggling readers: an odds ratio of 0.90 per standard deviation of enrollment (0.88 to 0.92), with a regional interval entirely below 1 in 17 of 18 regions.
- Schools with electricity (0.84, 0.78 to 0.90) and with internet (0.89, 0.86 to 0.91) had fewer struggling readers than comparable schools without them.
- Annex schools (1.25, 1.09 to 1.44) and schools with more learners per classroom (1.05, 1.04 to 1.07) had more struggling readers.
- The data cannot tell whether these inputs go with more or fewer struggling readers: Share of buildings needing major repair or worse (per SD); Has a water supply; No functional toilet; Offers multigrade classes; Urban barangay; Income class 3rd (vs 1st).
- Without schools of fewer than 30 learners, every clear result keeps its direction, and multigrade classes become clearly linked to more struggling readers (1.12, 1.06 to 1.17).
What was compared: CRLA results and school inputs two years earlier
The outcome is each school’s number of struggling readers out of the learners it assessed at the end of SY 2025-26, as of 10 May 2026, from the EDCOM II early-childhood (ECCD) dashboard. Each learner is counted once: Grade 1 in the Mother Tongue, Grade 2 in Filipino and Grade 3 in English.
The school inputs come from DepEd’s SY 2023-24 school files, two school years before the assessment. All of them enter one model together, so each result is the association of one input with reading among schools that are alike on the others. The inputs are:
- learners per teacher and learners per classroom at the elementary level;
- the share of the school’s buildings needing major repair or worse;
- school size, measured as elementary enrollment;
- whether the school has electricity, internet and a water supply, and whether it has no functional toilet;
- whether it offers multigrade classes and whether it is an annex school;
- whether its barangay is urban, and the income class of its municipality or city, compared with 1st class.
Which schools are included
The model uses complete cases: a school is included only if it has CRLA results and every input. That leaves 37,578 schools and 5,010,891 learners. The other 1,101 schools lack at least one input.
The excluded schools are not a random slice: 12.5% of their learners were struggling readers, against 9.9% in the modeled schools. The results describe schools with somewhat fewer struggling readers than those left out, and they cannot show whether inputs relate to reading differently in the schools with incomplete records.
How the model compares schools within a division
The analysis uses a Bayesian beta-binomial model with division effects. Each part of that name does a job.
Division effects. Divisions differ a great deal in their share of struggling readers. The model gives each division its own baseline, so each input is compared among schools in the same division. The division baselines have a standard deviation of 0.53 on the log-odds scale, a measure of how much divisions differ once their schools’ inputs are taken into account.
Beta-binomial. A simple binomial model assumes that, among schools in the same division with the same inputs, every learner has the same chance of struggling, so those schools differ only by chance. Real schools differ more than that. The beta-binomial model lets each school’s underlying share vary around what its inputs and division predict. Without that allowance, each learner would count as independent evidence and the intervals would be too narrow.
Bayesian. The model combines the data with mild prior assumptions, that most odds ratios are close to no difference but could be far from it. The 95% interval is the range of odds ratios that the model, given the data, considers plausible.
Reading an odds ratio
The odds of struggling are the number of struggling readers divided by the number who are not. An odds ratio compares those odds between schools: below 1 means fewer struggling readers, above 1 means more, and 1 means no difference. When struggling readers are a small share, as here, an odds ratio is close to the ratio of the shares themselves.
For yes-or-no inputs, the odds ratio compares schools with the feature to schools without it. For measured inputs, it goes with one standard deviation, a typical gap between schools. Learners per teacher, learners per classroom and enrollment are skewed, so they were logged first, and a standard deviation of a logged input is a proportional difference, not a fixed number of learners.
Checking the model
The model was fitted by simulation, with four chains and 4,000 draws in all. R-hat compares the chains with each other: the largest R-hat was 1.008, below 1.01, so the chains agree. The effective sample size counts how many independent draws the simulation is worth; the smallest effective sample size was 476, above 400.
Refitting with much wider priors on the input odds ratios changed no odds ratio by more than 0.18%, so the results come from the data, not the prior assumptions. The variance inflation factor measures how much an input’s uncertainty grows because it overlaps with other inputs. The largest was 3.5 (School size, elementary enrollment (log, per SD)), low enough that the inputs can be told apart.
A predictive check asks whether data simulated from the model look like the real data. Of the modeled schools, 22.1% reported no struggling reader, against 19.7% to 20.7% in the simulations. The model reproduces most of these schools, but slightly fewer than were reported, which matches the modest excess described in CRLA Schools With No Struggling Readers: A Data Check. Such schools are most common among small schools, one reason the results were also checked without them.
School resources and CRLA reading results, input by input
The table gives each input’s odds ratio and 95% interval from the main model and from the two checks described further down, with its variance inflation factor.
| School input | Odds ratio, Bayesian model (95% interval) | Excluding schools under 30 learners | Frequentist check, division fixed effects | VIF |
|---|---|---|---|---|
| Learners per teacher (log, per SD) | 1.14 (1.12–1.16) | 1.13 (1.10–1.15) | 1.20 (1.15–1.25) | 2.8 |
| Learners per classroom (log, per SD) | 1.05 (1.04–1.07) | 1.04 (1.03–1.06) | 1.05 (1.03–1.07) | 2 |
| Share of buildings needing major repair or worse (per SD) | 0.99 (0.98–1.00) | 0.99 (0.98–1.01) | 0.98 (0.97–1.00) | 1 |
| School size, elementary enrollment (log, per SD) | 0.90 (0.88–0.92) | 0.88 (0.87–0.90) | 0.78 (0.75–0.81) | 3.5 |
| Has electricity | 0.84 (0.78–0.90) | 0.87 (0.80–0.94) | 0.88 (0.79–0.98) | 1.1 |
| Has internet | 0.89 (0.86–0.91) | 0.89 (0.86–0.91) | 0.86 (0.82–0.91) | 1.1 |
| Has a water supply | 1.05 (0.97–1.13) | 1.05 (0.97–1.14) | 1.06 (0.95–1.17) | 1.1 |
| No functional toilet | 0.99 (0.91–1.07) | 0.94 (0.86–1.02) | 0.95 (0.80–1.12) | 1 |
| Offers multigrade classes | 1.02 (0.98–1.06) | 1.12 (1.06–1.17) | 1.02 (0.94–1.11) | 1.3 |
| Annex school | 1.25 (1.09–1.44) | 1.26 (1.08–1.46) | 1.15 (0.95–1.39) | 1 |
| Urban barangay | 1.02 (0.99–1.05) | 1.02 (0.99–1.05) | 1.02 (0.97–1.06) | 1.4 |
| Municipal income class 2nd (vs 1st) | 0.95 (0.92–0.99) | 0.96 (0.93–1.00) | 0.94 (0.85–1.04) | 1.1 |
| Income class 3rd (vs 1st) | 0.97 (0.93–1.01) | 0.99 (0.95–1.03) | 0.94 (0.87–1.03) | 1.1 |
| Income class 4th (vs 1st) | 0.88 (0.84–0.92) | 0.87 (0.82–0.92) | 0.86 (0.76–0.97) | 1.1 |
| Income class 5th (vs 1st) | 0.80 (0.72–0.90) | 0.88 (0.77–0.99) | 0.89 (0.69–1.15) | 1 |
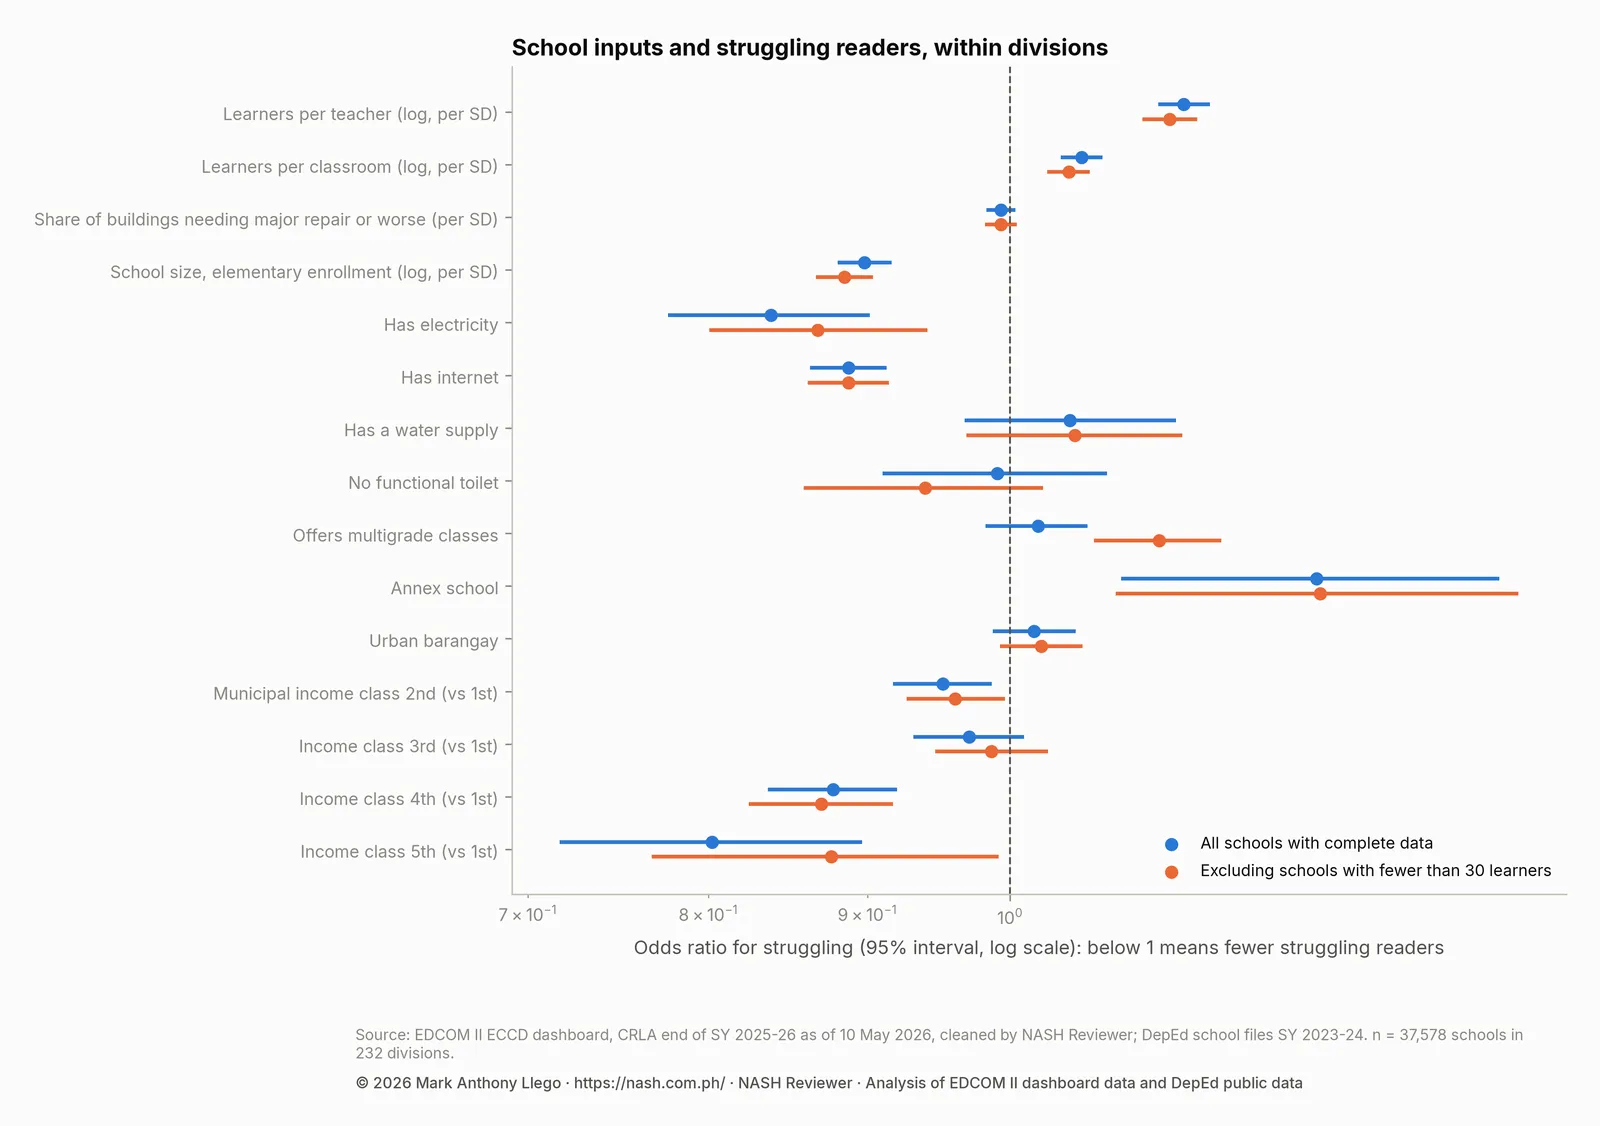
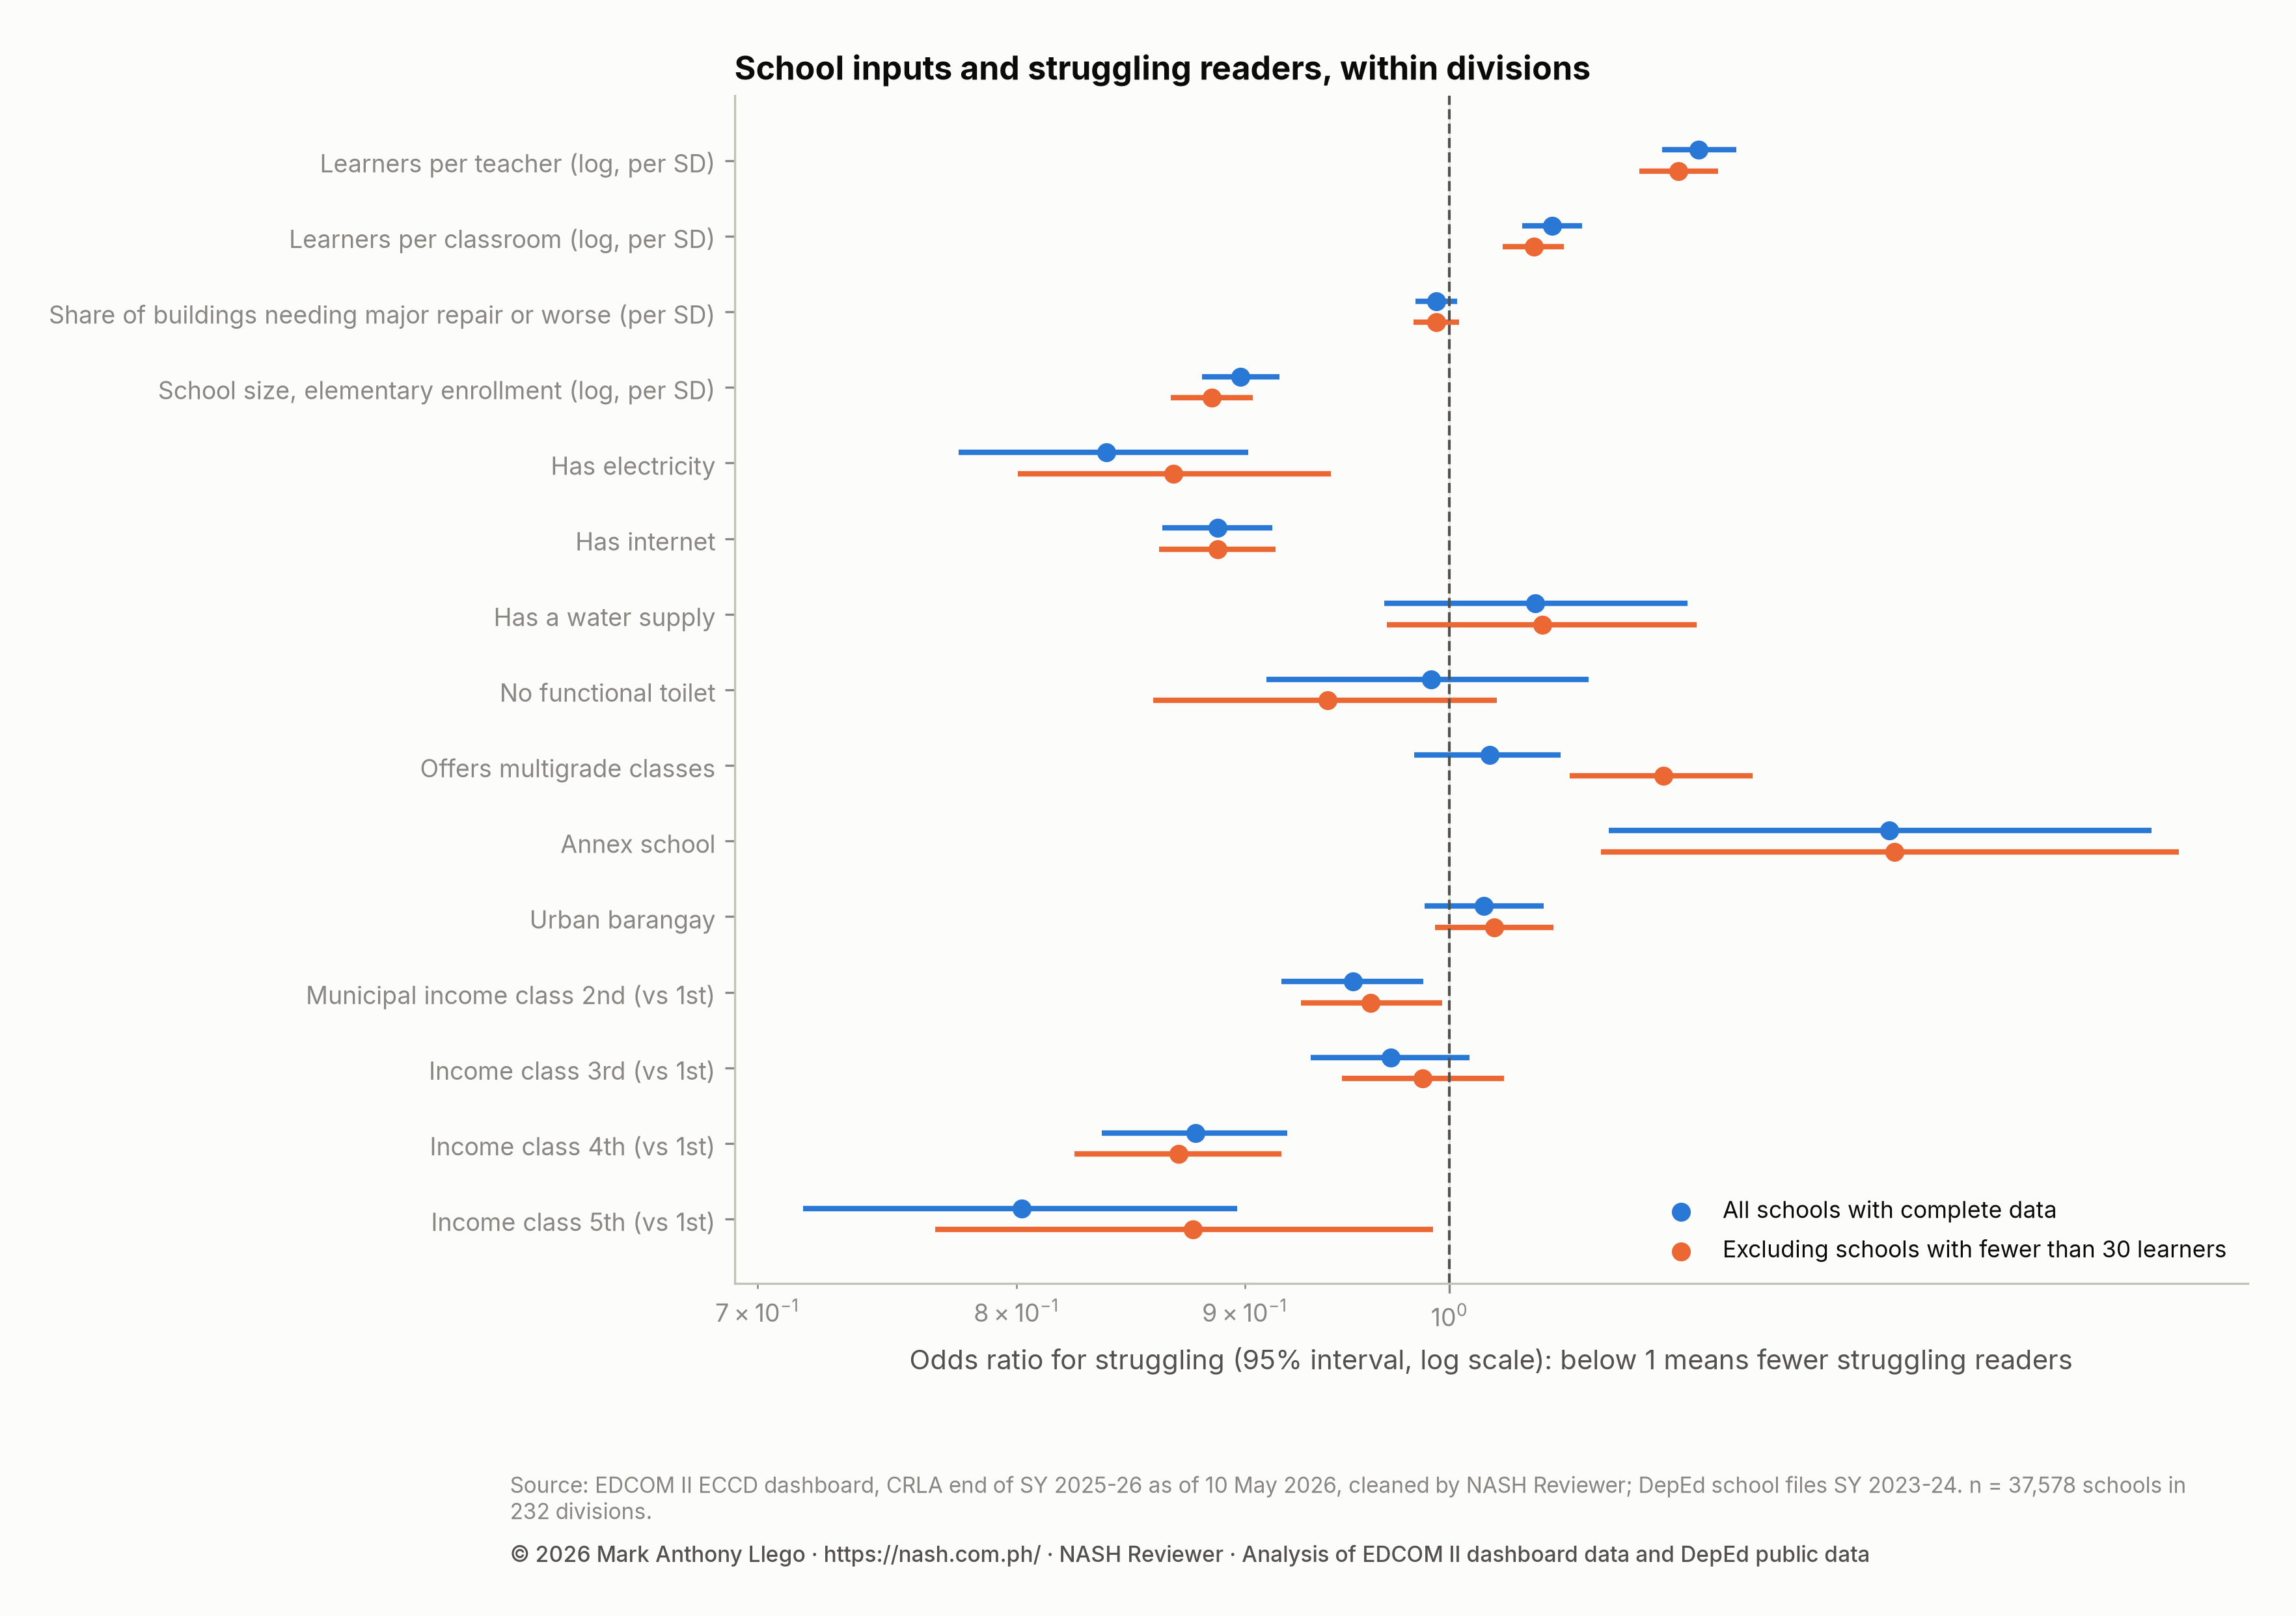
Of the inputs, 9 have 95% intervals entirely below or above 1. For the others, the data cannot tell the direction.
Inputs that go with more struggling readers
Learners per teacher. Each standard deviation of learners per teacher goes with an odds ratio of 1.14 (1.12 to 1.16). Put plainly: of two schools in the same division that are alike on the other inputs, the one with a standard deviation more learners per teacher tends to have odds of struggling 1.14 times as high. It is the clearest association in the analysis and, with school size, the most consistent across regions.
Learners per classroom. Crowded classrooms go with more struggling readers too, though less strongly: 1.05 per standard deviation (1.04 to 1.07). Because learners per teacher is held constant, this is classroom crowding over and above teacher crowding.
Annex schools. Annex schools, which operate under a mother school, had odds of struggling 1.25 times those of comparable schools in the same division (1.09 to 1.44). Annex schools are few, so this interval is wider than most.
Inputs that go with fewer struggling readers
School size. Larger schools had fewer struggling readers: 0.90 per standard deviation of enrollment (0.88 to 0.92). The model separates size from crowding: at the same learners per teacher, larger schools had fewer struggling readers, and at the same size, more learners per teacher went with more.
Electricity and internet. Schools with electricity had odds of struggling 0.84 times those of comparable schools without it (0.78 to 0.90). For internet, the odds ratio was 0.89 (0.86 to 0.91).
Municipal income class. Compared with schools in 1st class municipalities and cities in the same division, schools in 2nd class (0.95, 0.92 to 0.99), 4th class (0.88, 0.84 to 0.92) and 5th class (0.80, 0.72 to 0.90) places had fewer struggling readers. This runs against the expectation that poorer places have more. Income class measures the local government’s revenue, not family incomes, and the result is about places, not children; these data cannot say why it appears.
Inputs with no clear association
For each remaining input, the interval includes 1. The share of buildings needing major repair had an odds ratio of 0.99 (0.98 to 1.00), a water supply 1.05 (0.97 to 1.13) and no functional toilet 0.99 (0.91 to 1.07). Multigrade classes had 1.02 (0.98 to 1.06), an urban barangay 1.02 (0.99 to 1.05) and 3rd class income 0.97 (0.93 to 1.01).
An unclear result does not show that an input does not matter. For water and toilets the intervals are wide, because few schools lack them. For building condition and urban location the intervals are narrow and close to no difference, so any association left is small.
Checking the results: small schools and a second model
Without small schools. A school with a handful of learners can swing widely by chance. Refitting on the 31,655 schools with at least 30 learners assessed leaves the main results in place: learners per teacher 1.13 (1.10 to 1.15), school size 0.88 (0.87 to 0.90), electricity 0.87 (0.80 to 0.94) and annex schools 1.26 (1.08 to 1.46).
Some results change. Multigrade classes become clearly linked to more struggling readers, 1.12 (1.06 to 1.17) against 1.02 (0.98 to 1.06) with all schools. Multigrade classes are typical of small schools, so the refit removes many of them. One possible reading, which these data cannot confirm, is that the noisy results of the smallest multigrade schools hide an association that appears among larger ones. The income class results also weaken: the 2nd class interval (0.93 to 1.00) now ends just short of the line of no difference, and the 5th class odds ratio moves to 0.88 (0.77 to 0.99).
A frequentist check. A second model was fitted without priors: a binomial regression with a separate intercept for every division (division fixed effects), with standard errors clustered by division, which allow for extra variation between schools. Its estimates point the same way as the main model’s for 100% of the inputs. But its interval for annex schools, and for each of the 2nd class and 5th class income groups, includes 1, so those results are less firm.
That model also measures overdispersion, the extra variation between schools that a plain binomial model ignores. The variation of school results around its predictions, measured by the Pearson dispersion, was 10.2 times what a binomial model expects, strong evidence that schools differ beyond chance. The beta-binomial model is built for that extra variation.
School inputs and reading results by region
To see whether each association holds everywhere, the frequentist model was fitted separately in each region, again with division fixed effects. A region has too few divisions for division-clustered standard errors to be reliable, so each regional model instead widens its standard errors by the region’s own Pearson dispersion (a quasi-binomial model). As nationally, a region counts as going with fewer or more struggling readers only when its whole 95% interval lies below or above 1. A yes-or-no input enters a region’s model only when enough schools there have it, so annex schools, toilets and the lower income classes appear in fewer regions.
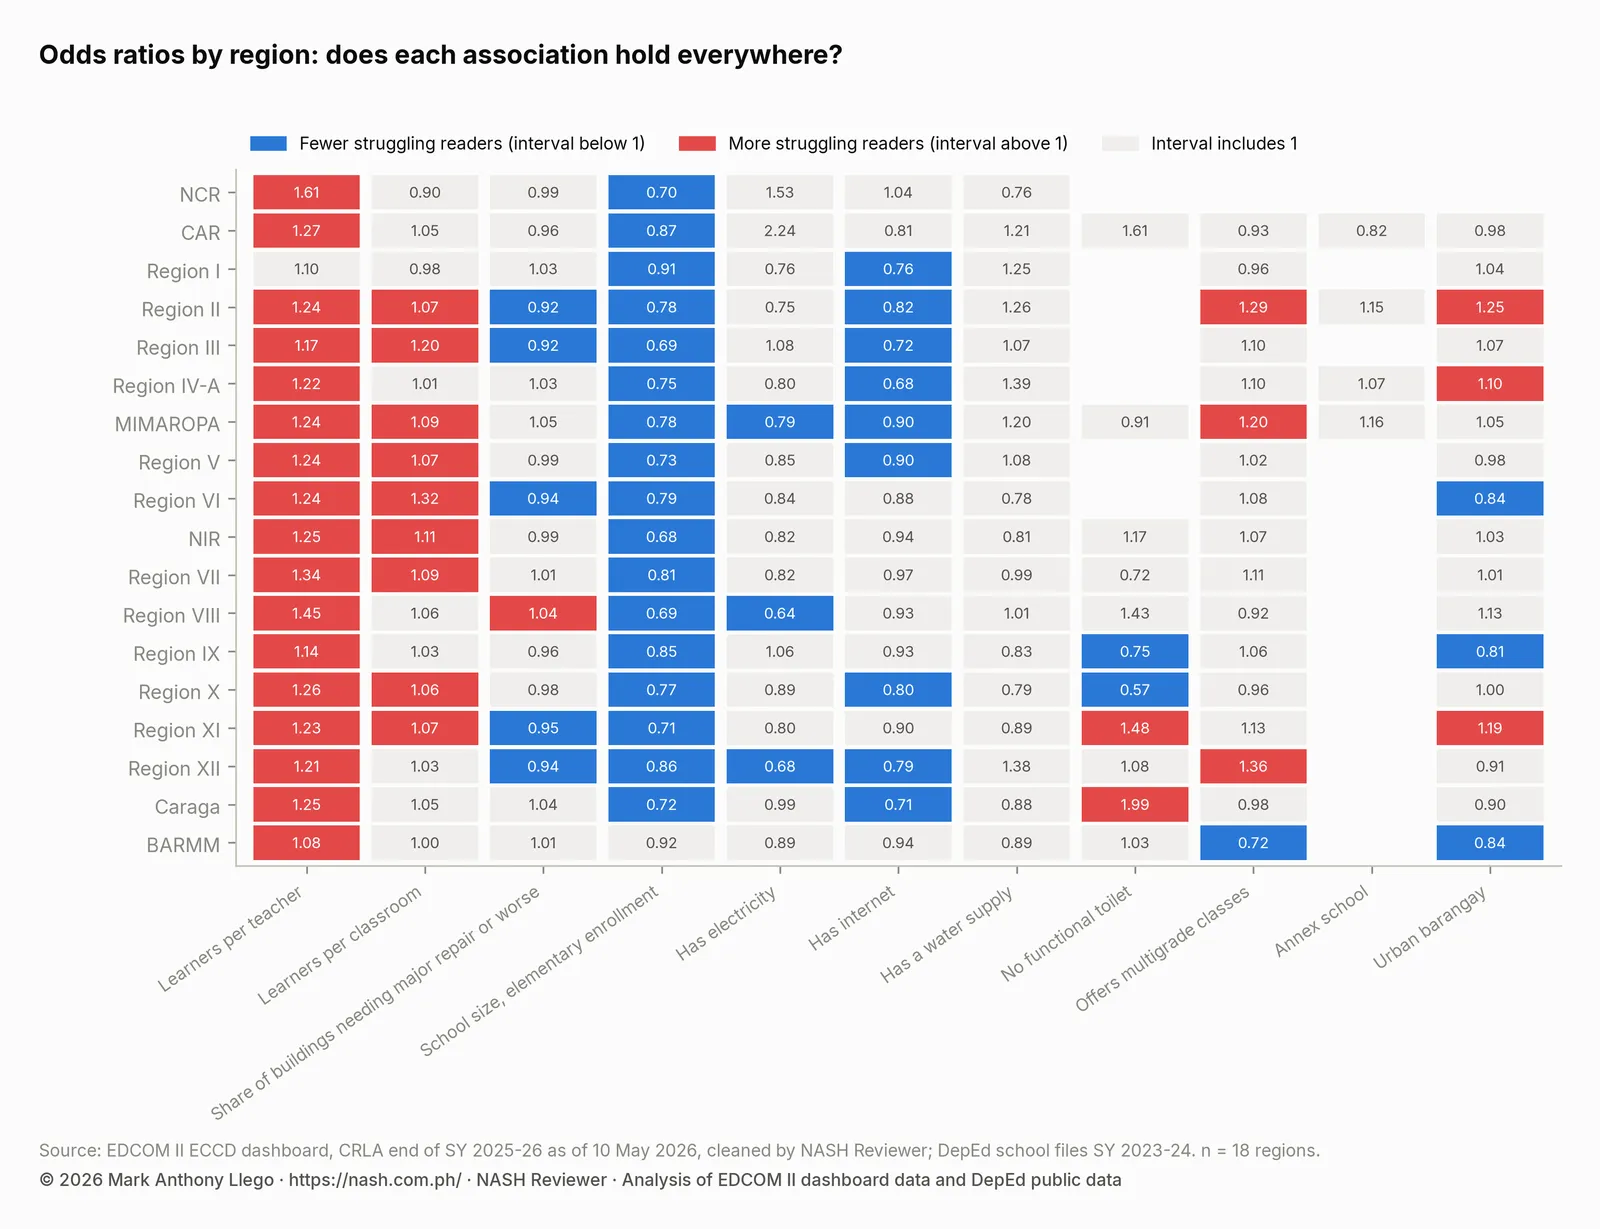
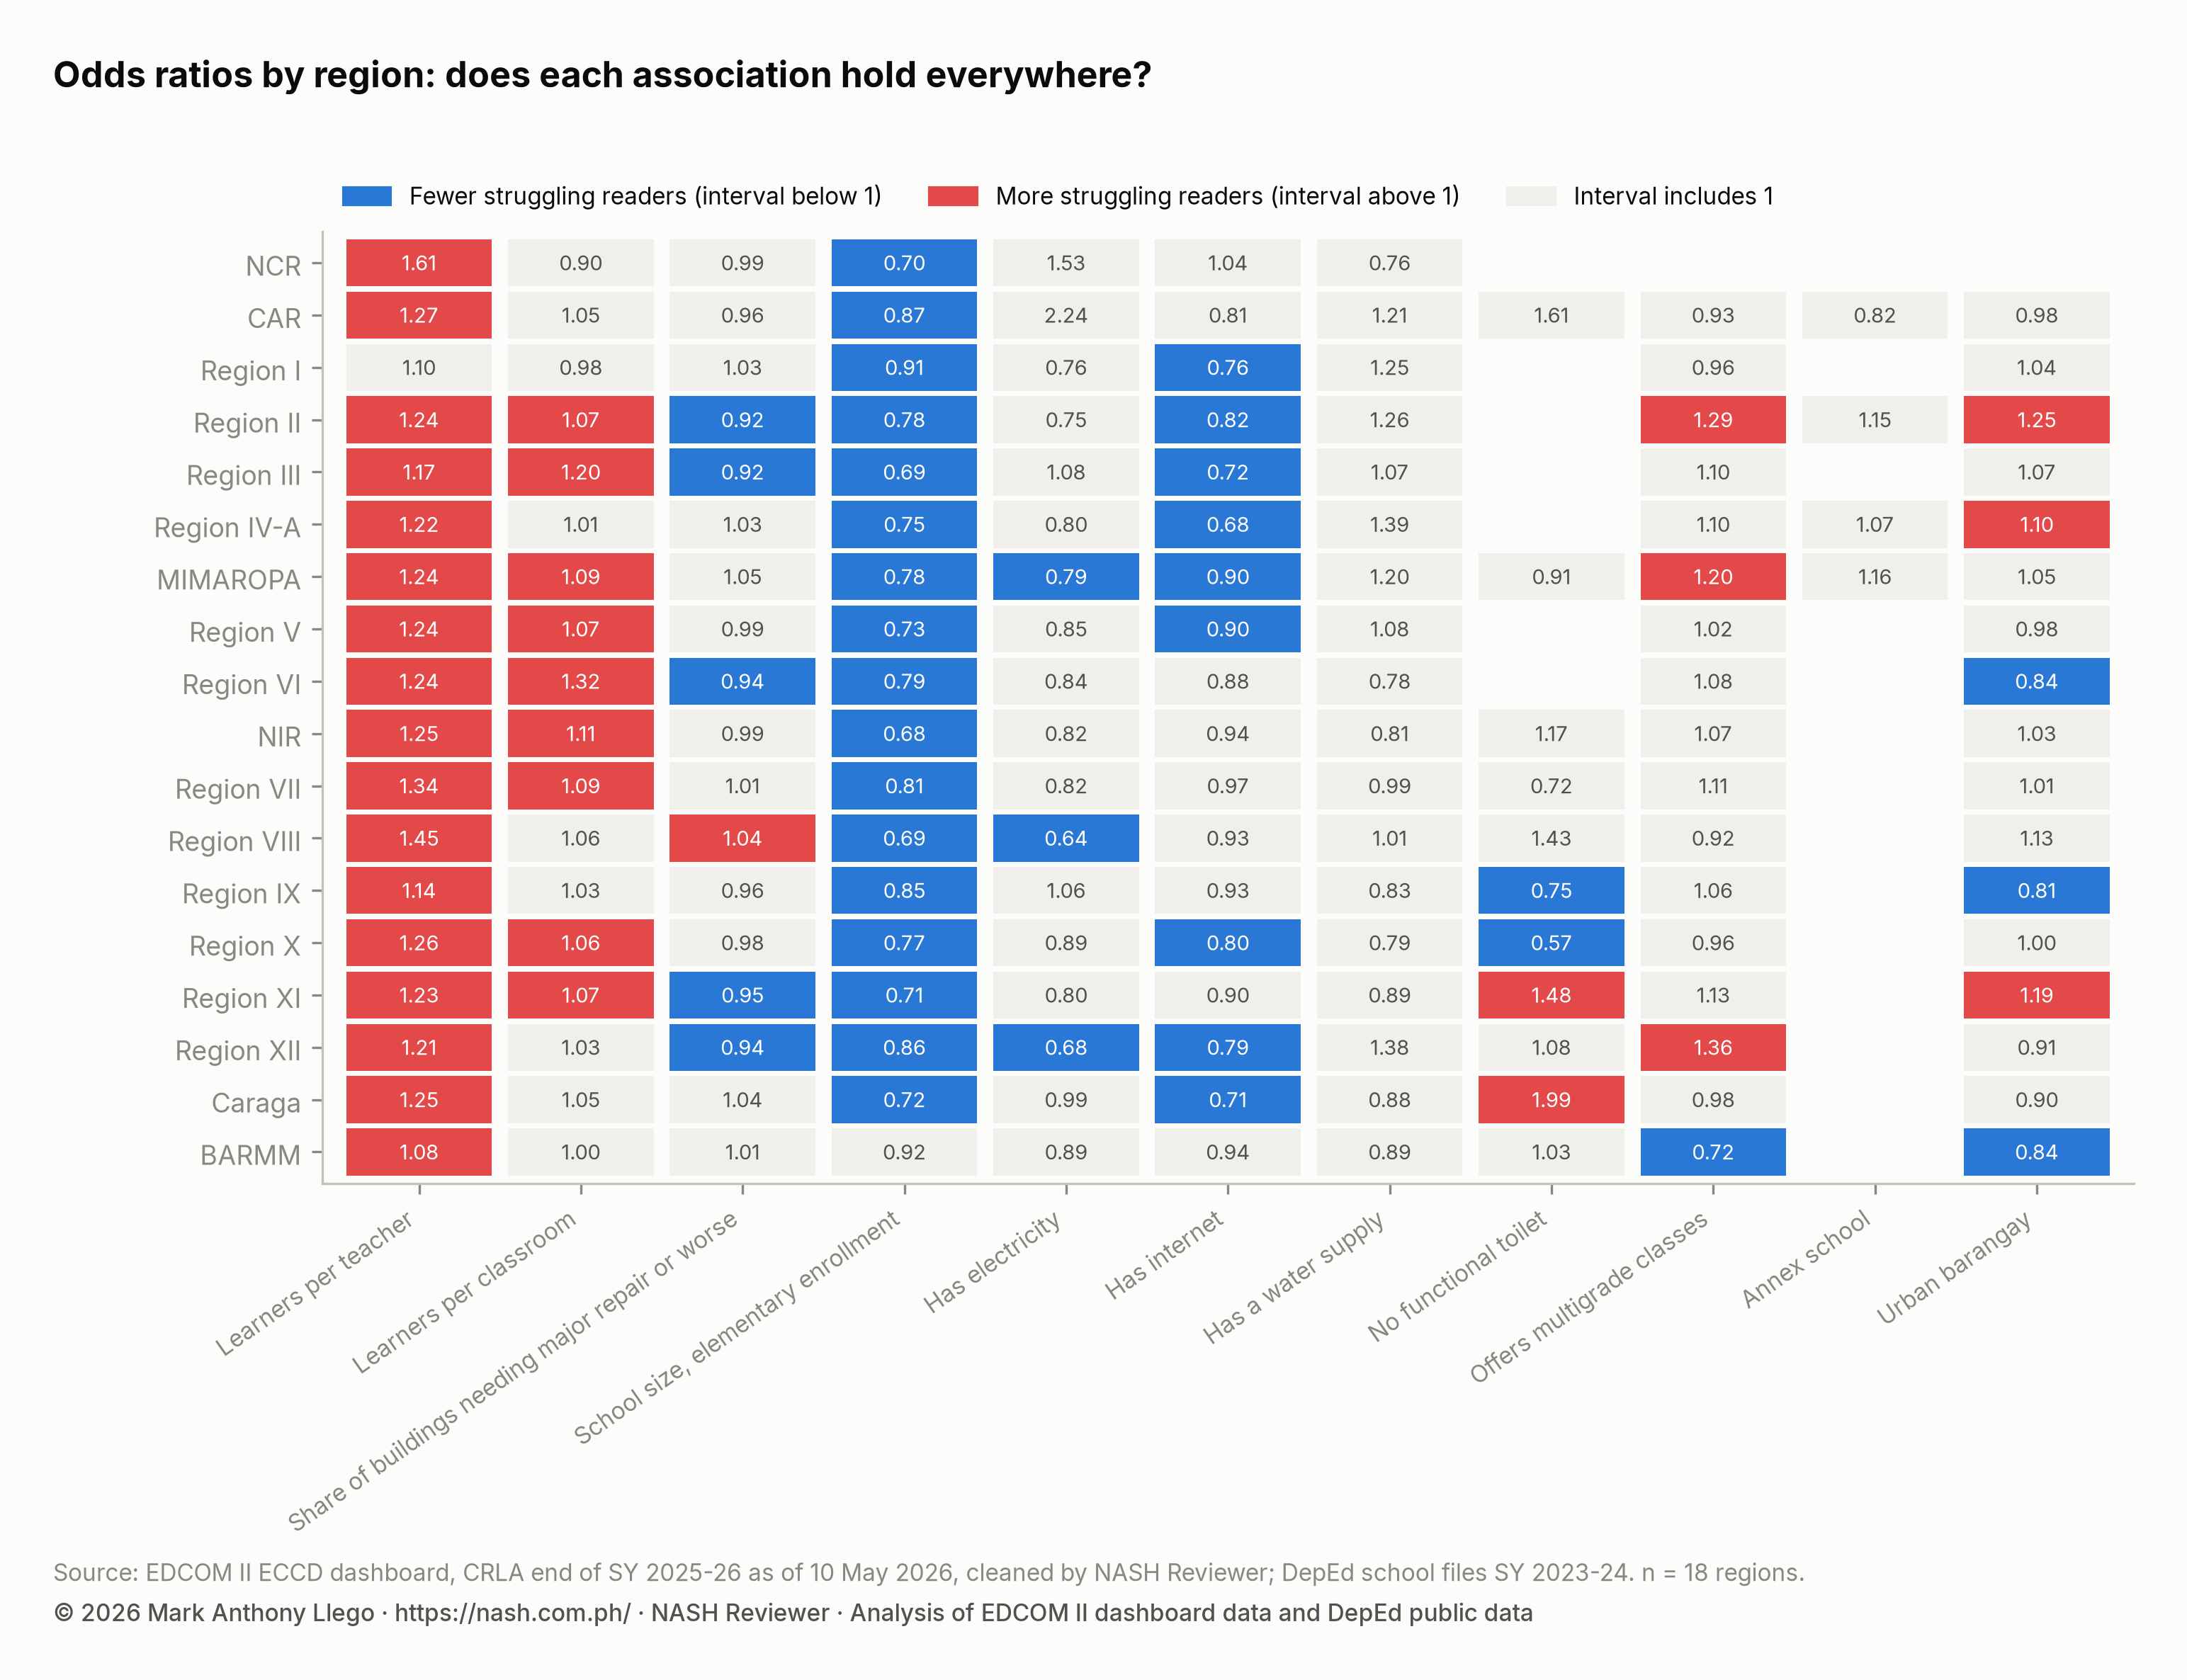
Learners per teacher and school size are consistent. Learners per teacher went with more struggling readers in 17 of 18 regions and with fewer in 0. School size went with fewer in 17 of 18 and with more in 0. Internet and learners per classroom point one way where they are clear: internet went with fewer struggling readers in 9 of 18 regions and with more in 0, and learners per classroom with more in 9 and with fewer in 0.
Among the other inputs in the chart, results vary or are rarely clear. Electricity went with fewer struggling readers in 3 regions and with more in 0, and a water supply with fewer in 0 and more in 0. No functional toilet went with fewer in 2 and more in 2 of 11 regions, and multigrade classes with fewer in 1 and more in 3 of 17. Annex schools could be modeled in only 4 regions, and their interval lay entirely above 1 in 0 of them and entirely below 1 in 0.
Some regions have far fewer schools than others, so their intervals are wider, and the regional models allow for extra variation more simply than the national model, with one dispersion factor for the whole region. A single regional cell is therefore a reason to look closer rather than a finding. Every regional odds ratio with its 95% interval is in the regional table in the download.
How this compares with the earlier five-region analysis
An earlier NASH Reviewer report, DepEd School Inputs vs Test Results, used DepEd’s selected-school assessment files for divisions in five regions, where only part of each division’s schools had results. It compared schools within divisions on the Grade 3 ELLNA, the Grade 6 NAT and the CRLA share of learners reading at grade level. Most inputs showed small or no association, and multigrade organization and internet access stood out for test scores.
For early reading, the two analyses point the same way on the main inputs. The earlier report found that a higher pupil-teacher ratio went with fewer Grade 1 to 3 learners at grade level, and that larger and connected schools had more. Here, with nearly every public school and the other end of the reading scale, more learners per teacher go with more struggling readers, and larger and connected schools with fewer.
The earlier report found no clear link between early reading and multigrade classes, annex status, classrooms or electricity. Here, learners per classroom, electricity and annex status each have an interval that excludes 1. A nationwide sample has many more schools without electricity or with crowded classrooms to compare, so smaller associations can be measured. The outcomes also differ: reading at grade level is not the mirror image of struggling, because many learners sit in the levels between.
What this means for school heads
- Watch learners per teacher in the early grades. It is the input most clearly linked to struggling readers nationwide, and the link holds in most regions. The measure covers the whole elementary level; watching it in Grades 1–3 classes, and making the case for teacher items where it is high, follows the clearest signal in these data.
- Treat crowding, connectivity and annex status as signals. Crowded classrooms, schools without internet or electricity, and annex schools had more struggling readers than comparable schools in the same division. They are reasons to look closely at early reading, and part of the work of managing school operations with DepEd data.
- Associations are not a promise. The data show which schools had more struggling readers, not what adding a teacher, a classroom or a connection would do. Schools that gain a resource may also differ in ways the files do not record.
- Compare like with like. Every result here compares a school with similar schools in its own division, the same rule explained in How to Read a School’s CRLA Results Fairly.
How these numbers were made
- CRLA results: end of SY 2025-26, as of 10 May 2026, from the EDCOM II ECCD dashboard, public schools only. Struggling readers are learners at Low Emerging or High Emerging, each learner counted once (Grade 1 Mother Tongue, Grade 2 Filipino and Grade 3 English).
- Regions: 18 regions under the PSGC, with Sulu in Region IX and the Negros Island Region (NIR) as its own region.
- School inputs: DepEd’s SY 2023-24 school files. Learners per teacher, learners per classroom and elementary enrollment were logged and standardized; the share of buildings needing major repair or worse was standardized; the other inputs are yes-or-no indicators, centered on their means, which leaves their odds ratios unchanged; income class is compared with 1st class. Schools missing any input were left out.
- Main model: a Bayesian beta-binomial regression of struggling readers out of learners assessed, with division effects, fitted with four chains and 4,000 draws, checked by R-hat (below 1.01), effective sample size (above 400), a refit with wider priors on the inputs and a predictive check on schools with no struggling reader.
- Checks: variance inflation factors; a refit on schools with at least 30 learners assessed; a frequentist binomial regression with division fixed effects, nationally with division-clustered standard errors and in each region with standard errors scaled by the region’s Pearson dispersion (quasi-binomial).
- Odds ratios: reported with 95% intervals. An input is described as going with fewer or more struggling readers only when its whole interval lies below or above 1.
Limits
The inputs are from SY 2023-24 and the reading results from the end of SY 2025-26. In between, schools gained and lost teachers, classrooms were built or repaired, and connections came and went, so the model links reading to resources two years earlier.
The inputs are what schools reported to DepEd, not audited counts. Reporting errors would usually blur the associations and make them look weaker than they are.
Important differences between schools are not measured: teacher quality and experience, household poverty below the municipal level, learners’ home languages, attendance and the way each school gave the CRLA. If they line up with the inputs, part of each association belongs to them.
The division effects absorb everything shared across a division. That makes the within-division comparison fair, but a shortage that affects every school in a division alike is invisible here. Finally, the results describe schools with complete records, which had fewer struggling readers than those left out, and they describe schools, not individual learners.
Frequently asked questions
Do more learners per teacher mean more struggling readers?
In the same division, schools with more learners per teacher had more struggling readers on the CRLA: an odds ratio of 1.14 per standard deviation (95% interval 1.12 to 1.16), a pattern that was clear in 17 of 18 regions. It is an association, not proof that adding a teacher would reduce struggling readers.
Do larger schools have fewer struggling readers?
Yes, among schools in the same division that are alike on the other inputs. Each standard deviation of enrollment went with an odds ratio of 0.90 (0.88 to 0.92), and the pattern was clear in 17 of 18 regions. The files do not show why.
Does internet access in schools go with better reading results?
Schools with internet had fewer struggling readers than comparable schools without it, with an odds ratio of 0.89 (0.86 to 0.91). The association was clear in 9 of 18 regions. Connected schools may also differ in ways the files do not measure.
What does an odds ratio mean in a school comparison?
It compares the odds of struggling (struggling readers divided by those who are not) between schools. Below 1 means fewer struggling readers and above 1 means more. When struggling readers are a small share, as on the CRLA, it is close to the ratio of the two schools’ shares.
Download the data
The cleaned EDCOM II dashboard data behind this series are free to download for personal study; to reuse them, email support@nash.com.ph for written permission first. How the EDCOM Dashboard Data Was Cleaned explains every table and cleaning rule. The files are at data.nash.com.ph: start with the README, then the school table with CRLA results and school inputs (Parquet), the school estimates (CSV), the division estimates (CSV) and the municipal table (CSV). The DepEd school files used for school inputs are described in Download Cleaned DepEd School Data.
Every file, with its rows, columns and checksum, is listed on the EDCOM II CRLA data page. To cite the data: Llego, M. A. (2026). EDCOM II early-childhood dashboard data, cleaned, version 1. NASH Reviewer. https://nash.com.ph/edcom-data
More in this series
- CRLA End-of-Year Results SY 2025-26: All 18 Regions
- CRLA Start vs End of SY 2025-26 in the Same Schools
- CRLA by Language: Mother Tongue, Filipino and English
- How to Read a School’s CRLA Results Fairly
- CRLA Variation: School, Division or Region?
- Where Struggling Readers Are Concentrated
- School Resources and CRLA Reading Results
- CRLA Results in Schools With and Without a Principal
- Action Research and Thesis Topics on Reading (CRLA)
- CRLA Reading Hotspots: A Map of Struggling Readers
- Stunting, Day Care Centers and Early Reading
- Literacy and Nutrition Programs Compared With Need
- CRLA Schools With No Struggling Readers: A Data Check
- How the EDCOM Dashboard Data Was Cleaned
- Regional reports: NCR, CAR, Region I, Region II, Region III, Region IV-A, MIMAROPA, Region V, Region VI, NIR, Region VII, Region VIII, Region IX, Region X, Region XI, Region XII, Caraga, BARMM
- Earlier reports: CRLA Results SY 2025-2026 (DepEd’s selected-school file), Do the Same DepEd Schools Lag on the ELLNA, NAT and CRLA?, DepEd School Inputs vs Test Results, EDCOM II Final Report: Guide for Aspiring School Heads, DepEd Data for Aspiring School Heads: Where to Start
Analysis and charts by Mark Anthony Llego for NASH Reviewer. Data: EDCOM II early-childhood dashboard and Department of Education public datasets. NASH Reviewer is not affiliated with EDCOM II or DepEd. Charts may be reused only with written permission from support@nash.com.ph.