DepEd’s SY 2023-2024 personnel data count the public school teachers and other staff paid for by local government units (LGUs) and other non-national sources. Local governments and other sources paid for 29,938 people working in 10,307 public schools: 18,310 teachers and 11,628 non-teaching personnel. Locally funded teachers are 2.0% of all public school teachers nationally and 12.6% in BARMM.
Every provincial, city and municipal government collects a Special Education Fund (SEF), a one percent levy on real property that the Local Government Code reserves for public schools. The Local School Board decides how to spend it. The Second Congressional Commission on Education (EDCOM II) found the fund very uneven: PHP 25,587 per learner in Makati City against PHP 65 in Guihulngan City. It also found PHP 16.3 billion of the fund unspent in 2022. One of the things it buys is people.
The personnel file records, for every public school, the personnel paid for by a provincial SEF, a municipal or city SEF, other local government funds or other sources. These are teachers, learning support aides, administrative staff, nurses, doctors, dentists, librarians, guidance staff and computer technicians. The count excludes ten school rows whose entries are impossible, among them a senior high school in Pasig that reports 47,684 locally funded administrative staff. One public school in five had at least one locally funded worker; in BARMM, nearly one in two.
Key findings
- Local governments pay for 18,310 teachers in 7,320 public schools, 2.0% of all public school teachers. Another 11,628 locally funded workers are non-teaching personnel.
- BARMM relies on locally funded teachers the most. They are 12.6% of its teachers, and 46.6% of its schools have at least one locally funded worker.
- Local governments pay for nearly all school health staff. They fund 207 school nurses, 115 dentists and 11 doctors, while the national plantilla has 189 School Nurse II positions and no dentists.
- Region VII has the fewest locally funded personnel. It has 3.8 per 10,000 learners, against 45.1 in BARMM.
Which positions local governments pay for
| Personnel type | SEF, province | SEF, municipality or city | Other LGU funds | Other funding | Total | Schools with at least one | Share of public schools |
|---|---|---|---|---|---|---|---|
| Teachers (K to 12) | 3,465 | 5,107 | 7,793 | 1,945 | 18,310 | 7,320 | 15.3% |
| Learning support aides | 1,227 | 970 | 1,491 | 273 | 3,961 | 2,100 | 4.4% |
| Administrative officers | 28 | 15 | 45 | 83 | 171 | 153 | 0.3% |
| Administrative assistants | 40 | 176 | 311 | 147 | 674 | 399 | 0.8% |
| Administrative aides | 152 | 2,271 | 2,825 | 670 | 5,918 | 2,090 | 4.4% |
| Project development officers | 18 | 15 | 15 | 17 | 65 | 31 | 0.1% |
| School doctors | 7 | 2 | 2 | 0 | 11 | 5 | 0.0% |
| School dentists | 3 | 33 | 79 | 0 | 115 | 85 | 0.2% |
| School nurses | 10 | 70 | 119 | 8 | 207 | 178 | 0.4% |
| Librarians | 14 | 8 | 27 | 11 | 60 | 40 | 0.1% |
| Library assistants | 43 | 12 | 41 | 9 | 105 | 60 | 0.1% |
| Guidance counselors | 16 | 2 | 2 | 3 | 23 | 8 | 0.0% |
| Guidance advocates | 47 | 9 | 67 | 6 | 129 | 98 | 0.2% |
| Guidance assistants | 24 | 41 | 15 | 4 | 84 | 37 | 0.1% |
| Computer technicians | 16 | 26 | 31 | 32 | 105 | 86 | 0.2% |
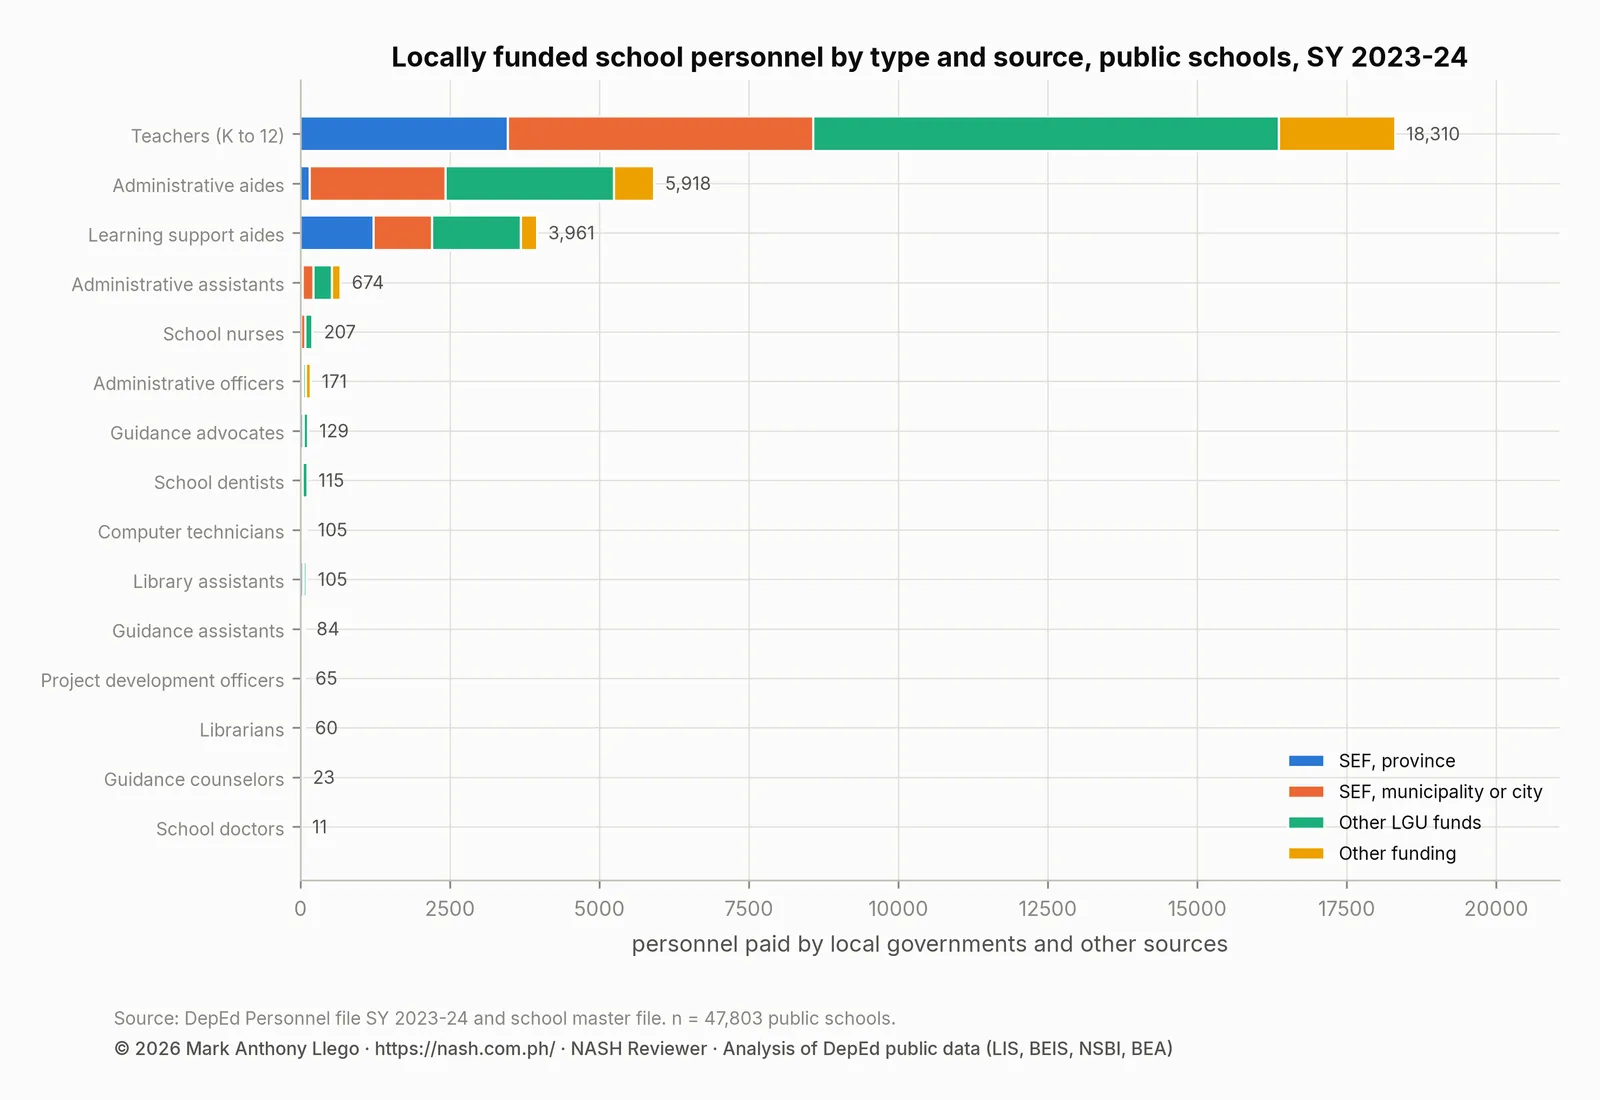
Teachers are the largest group and the most widely spread. The 18,310 locally funded teachers work in 7,320 schools, 15.3% of public schools. They are 2.0% of all teachers in public schools, beside 890,690 nationally funded ones. Municipal and city SEFs pay 5,107 of them, provincial SEFs 3,465, other LGU funds 7,793 and other sources 1,945. Administrative aides come next, 5,918 in 2,090 schools. Then come learning support aides, 3,961 in 2,100 schools; these are the classroom assistants that the National Education Plan wants certified in caregiving for learners with disabilities.
The health and specialist positions are few in number but important, because the national plantilla barely provides them below senior high school. Local governments pay for 207 school nurses, more than the 189 nationally funded School Nurse II positions in the whole country. They pay for 115 of the country’s school dentists and 11 of its doctors, which is nearly all of them. They also pay for 60 librarians and 105 library assistants. Guidance staff number 129 advocates, 84 assistants and 23 counselors, and there are 105 computer technicians. A public elementary school with a nurse or a dentist has one, in almost every case, because a local government chose to pay for it.
Locally funded personnel by region and division
| Region | Locally funded personnel | Per 10,000 learners | Schools with any | Teachers | Locally funded share of teachers | Learning support aides | Nurses, doctors, dentists | Guidance staff | Administrative staff |
|---|---|---|---|---|---|---|---|---|---|
| BARMM | 3,467 | 45.1 | 46.6% | 3,216 | 12.6% | 122 | 2 | 5 | 73 |
| CAR | 855 | 23.9 | 22.6% | 486 | 2.6% | 98 | 6 | 46 | 216 |
| Region II | 1,886 | 23.3 | 29.9% | 1,632 | 4.5% | 105 | 1 | 1 | 143 |
| Region VIII | 2,119 | 18.6 | 14.7% | 1,182 | 2.2% | 780 | 1 | 4 | 144 |
| Region VI | 1,700 | 16.3 | 28.1% | 1,150 | 2.5% | 213 | 5 | 0 | 328 |
| Region IX | 1,681 | 15.2 | 20.8% | 1,345 | 3.1% | 257 | 6 | 3 | 58 |
| MIMAROPA | 1,209 | 14.8 | 19.8% | 989 | 2.9% | 105 | 5 | 10 | 94 |
| NCR | 3,041 | 14.5 | 56.9% | 305 | 0.4% | 34 | 244 | 82 | 2,320 |
| Region XII | 1,486 | 14 | 23.9% | 1,252 | 3.0% | 111 | 1 | 0 | 118 |
| CARAGA | 960 | 13.7 | 20.1% | 726 | 2.4% | 160 | 0 | 1 | 68 |
| Region X | 1,341 | 11.6 | 20.7% | 236 | 0.5% | 437 | 0 | 1 | 662 |
| Region XI | 1,314 | 10.8 | 21.1% | 1,070 | 2.4% | 103 | 0 | 0 | 131 |
| Region III | 2,502 | 10.1 | 21.6% | 1,446 | 1.6% | 214 | 23 | 68 | 718 |
| NIR | 1,054 | 9.3 | 18.0% | 688 | 1.5% | 184 | 2 | 4 | 150 |
| Region V | 1,377 | 8.7 | 11.4% | 758 | 1.1% | 381 | 13 | 2 | 219 |
| Region IV-A | 2,690 | 8.4 | 27.3% | 1,241 | 1.2% | 410 | 22 | 7 | 1,003 |
| Region I | 700 | 6.4 | 12.4% | 332 | 0.7% | 102 | 1 | 0 | 248 |
| Region VII | 556 | 3.8 | 8.6% | 256 | 0.5% | 145 | 1 | 2 | 135 |
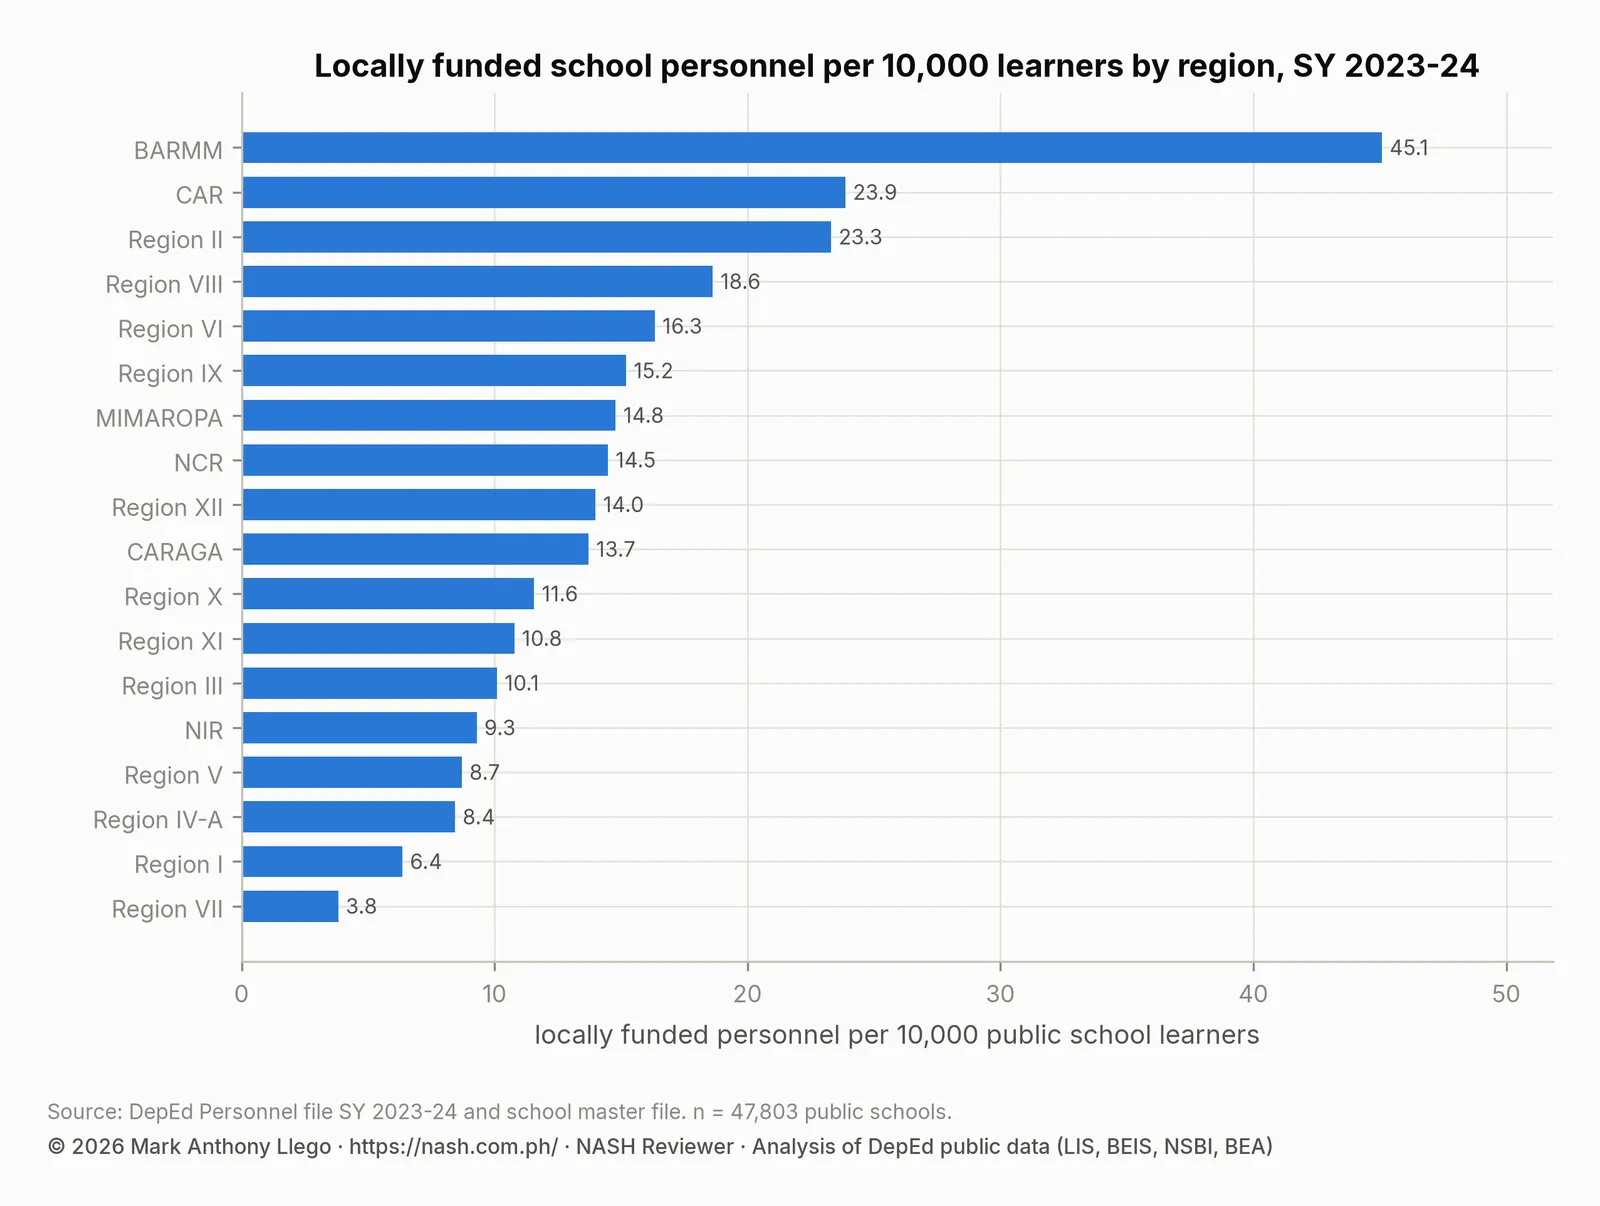
BARMM is different from every other region. Its local governments pay for 3,216 teachers, 12.6% of all teachers in the region’s public schools, against a national share of 2.0%. Locally funded workers are in 46.6% of its schools, and its 45.1 locally funded personnel per 10,000 learners is nearly double the next region’s. The teachers are in the provinces. Maguindanao I has 974 locally funded teachers in 82.0% of its schools, Maguindanao II 707 in 78.3% and Tawi-Tawi 620 in 52.5%. Lanao del Sur - II has 397. The SY 2023-2024 personnel report found that BARMM’s schools have the least nationally funded staffing in the country. Locally funded teachers are part of how the region fills that gap.
CAR (23.9 per 10,000 learners) and Region II (23.3) are next, both mainly through teachers. Region II’s 1,632 locally funded teachers are 4.5% of its teaching force, and Quirino and Cauayan City are among the top twenty divisions. Region VIII’s 2,119 locally funded personnel include 780 learning support aides, most of them in Eastern Samar. Eastern Samar, which also has 784 locally funded teachers, leads the division ranking at 112.5 per 10,000 learners.
NCR’s 3,041 locally funded personnel are a different mix: 305 teachers, but 2,320 administrative staff and 244 nurses, doctors and dentists. Those 244 are more than half of all the health personnel local governments pay for in the country. Locally funded workers are in 56.9% of NCR’s schools. Parañaque City (95.3% of schools) and Valenzuela City (92.9%) fund staff in almost every school. Mandaluyong City pays for 200 workers, or 36.5 per 10,000 learners, but in only a third of its schools.
| Division | Region | Learners | Locally funded personnel | Per 10,000 learners | Of which teachers | Schools with any |
|---|---|---|---|---|---|---|
| Eastern Samar | Region VIII | 97,433 | 1,096 | 112.5 | 784 | 50.1% |
| Malaybalay City | Region X | 54,593 | 515 | 94.3 | 0 | 9.4% |
| Tawi-Tawi | BARMM | 78,063 | 697 | 89.3 | 620 | 52.5% |
| Maguindanao I | BARMM | 142,355 | 1,007 | 70.7 | 974 | 82.0% |
| Maguindanao II | BARMM | 125,417 | 725 | 57.8 | 707 | 78.3% |
| South Cotabato | Region XII | 197,740 | 1,095 | 55.4 | 940 | 83.0% |
| Paranaque City | NCR | 103,566 | 518 | 50 | 0 | 95.3% |
| Tayabas City | Region IV-A | 22,469 | 112 | 49.8 | 47 | 74.3% |
| Davao del Sur | Region XI | 108,560 | 493 | 45.4 | 431 | 57.1% |
| Bataan | Region III | 161,495 | 718 | 44.5 | 318 | 63.8% |
| Apayao | CAR | 28,204 | 124 | 44 | 100 | 27.4% |
| Ifugao | CAR | 42,532 | 186 | 43.7 | 132 | 29.7% |
| Mati City | Region XI | 39,561 | 169 | 42.7 | 120 | 76.4% |
| Lanao del Sur - II | BARMM | 103,731 | 441 | 42.5 | 397 | 38.8% |
| Quirino | Region II | 47,705 | 192 | 40.2 | 161 | 37.4% |
| Valenzuela City | NCR | 131,253 | 490 | 37.3 | 5 | 92.9% |
| Sulu | Region IX | 144,188 | 535 | 37.1 | 482 | 35.7% |
| Mandaluyong City | NCR | 54,834 | 200 | 36.5 | 1 | 33.3% |
| Passi City | Region VI | 21,694 | 78 | 36 | 46 | 60.0% |
| Cauayan City | Region II | 34,504 | 121 | 35.1 | 91 | 36.2% |
At the other end, Region VII has 3.8 locally funded personnel per 10,000 learners, and 8.6% of its schools have any. Region I has 6.4 per 10,000 and 12.4% of schools. Region IV-A, the country’s largest region, has 8.4 per 10,000. Eleven of 226 divisions report no locally funded personnel at all, and the median division has 8.6 per 10,000 learners.
Ten school rows excluded as entry errors
Schools fill in the personnel file, and ten rows report locally funded staff in numbers that cannot be right. Together they report 62,333 personnel. One Pasig senior high school with 2,790 learners reports 47,684, and a national high school in Eastern Samar reports 7,435. An elementary school in Agusan del Sur with 444 learners reports 5,002, and a primary school in Sulu with 203 learners reports 1,002.
The rule used here excludes any school reporting more than one locally funded worker for every five learners. It removes those ten rows and leaves 29,938 personnel. Including them would put the national total at 92,271. It would also make Pasig City, with 3,263 locally funded personnel per 10,000 learners, the division with the most locally funded staff per learner in the country, by a factor of thirty. The DepEd open data quality audit discusses this kind of error. A reader using the raw file should apply a similar check.
What the Special Education Fund may pay for
The Local Government Code lets the Special Education Fund pay for, among other things, the salaries of locally funded teachers and the operation of extension classes. The joint circular of DepEd and the Department of Budget and Management on the SEF, revised in 2025, widened the list. EDCOM II’s Priority Area 26 found the fund both unequal and underused. The National Education Plan’s Outcome 6.2.A sets as a 2035 condition that “Local Government Units fully utilize SEF aligned with SIPs”. It lists an amendment to the Local School Board law among its priority legislative measures. Local School Boards and the Special Education Fund covers the 2025 circular’s list of what the fund may pay for and EDCOM II’s findings on the fund.
The pattern in this file is what such a fund produces without a national formula. Some regions and cities hire, and others do not. The hiring is concentrated where either the need (BARMM, Eastern Samar) or the money (NCR’s cities) is greatest.
What the file cannot say
- It records personnel paid by local governments and other sources as the school reports them. It does not record contracts, salaries, months of service or whether the person is a licensed teacher. “Other funding” includes parent-teacher associations (PTAs), foundations and private donors.
- It cannot say what the fund is spent on beyond people. Classrooms, repairs, feeding and sports are the SEF’s other uses and are not in a personnel file.
- The ten excluded rows show that the columns are not validated at entry. Division and regional totals here are only as good as the remaining entries.
What this means for school heads
The Local School Board is the one body outside DepEd that can put a teacher, a nurse or an aide in your school. Strand 5.5 of the Philippine Professional Standards for School Heads (PPSSH), community engagement, and strand 2.2, financial management, are the standards under which you would ask. The file shows what other schools in your region have obtained. In Maguindanao, four schools out of five have locally funded teachers. In Parañaque and Valenzuela, almost every school has a locally funded worker. In most of the Visayas, almost none do. A school head who brings the division’s SEF utilization and the School Improvement Plan to the municipal board together is doing what the plan’s 2035 condition describes. The PPSSH Domain 5 guide covers the strand, and the EDCOM II guide for aspiring school heads covers the fund.
Frequently asked questions
How many DepEd teachers are paid by local governments?
Local governments and other non-national sources paid for 18,310 teachers in 7,320 public schools in SY 2023-2024, which is 2.0% of all teachers in public schools. In BARMM the share is 12.6%, in Region II 4.5% and in Region VII 0.5%.
Which region has the most locally funded school personnel?
Relative to learners, BARMM has the most, with 45.1 per 10,000 learners and locally funded staff in 46.6% of its schools. In absolute numbers, BARMM (3,467), NCR (3,041) and Region IV-A (2,690) lead. NCR’s are mostly administrative staff and health personnel rather than teachers.
Do local governments pay for school nurses and dentists in DepEd schools?
Yes, almost all of them. Local governments and other sources pay for 207 school nurses, 115 dentists and 11 doctors in public schools. The national plantilla provides 189 School Nurse II positions, all in senior high schools, and no dentists.
Download the data
The cleaned, harmonized DepEd files behind this series are free to download in CSV and Parquet, with a codebook and checksums, under the terms of use set out in the release. Download Cleaned DepEd School Data, SY 2017-18 to 2025-26 documents every file and column. The files themselves are at data.nash.com.ph, starting with the README, the SY 2023-24 school master file (CSV, 8.0 MB) and the nine-year enrollment panel (Parquet, 17.2 MB).
More in this series
- DepEd School Counselors, Nurses, Librarians, SY 2023-2024
- DepEd Principals and Head Teachers per School, SY 2023-2024
- DepEd Teachers and School Personnel Data, SY 2023-2024
- EDCOM II Final Report: Guide for Aspiring School Heads
- DepEd Data for Aspiring School Heads: Where to Start
- For aspiring school heads: PPSSH Domain 5 Through the Data and the full report, Philippine basic education in numbers
Analysis and charts by Mark Anthony Llego for NASH Reviewer. Data: Department of Education personnel and learner datasets SY 2023-24 (public datasets); EDCOM II Final Report, January 2026. Charts may be reused only with written permission from support@nash.com.ph.