DepEd’s enrollment files for SY 2019-2020 and SY 2020-2021 show which private schools did not open in the first pandemic year and where their learners went. 1,422 private schools, one in ten, are missing from the SY 2020-2021 file. Their 67,236 learners are only 7.2% of the 928,928 learners the private sector lost that year.
The common account of SY 2020-2021 is that private schools closed and their learners moved into public schools. The enrollment files allow that account to be checked school by school, because every school carries the same identifier from year to year.
A private school that is in the SY 2019-2020 file and missing from the SY 2020-2021 file did not report enrollment that year. In practice, that means it did not open. Its learners either enrolled elsewhere or enrolled nowhere.
Below are the schools that disappeared and the learners they held, then a harder question at the level of the municipality: did public enrollment rise more where private schools lost more? The answer is yes, but by much less than the common account implies.
Private schools that did not open for SY 2020-2021
The SY 2019-2020 file lists 14,435 private schools with 4,304,676 learners. The SY 2020-2021 file is missing 1,422 of them, one in ten. The missing schools held 67,236 learners in their last year, and their median size was 22.
They were small:
- 1,045 of the 1,422 had 50 learners or fewer;
- 220 had between 51 and 100;
- 108 had between 101 and 200;
- 38 had between 201 and 500;
- 11 had more than 500.
Eight in ten (1,142) offered elementary grades only; 153 offered elementary and secondary, and 127 secondary only. The typical closure was a small private kindergarten or elementary school with two or three dozen learners.
A further 833 private schools present in SY 2020-2021 are missing from SY 2021-2022, with 30,082 learners in their last year. Some closures were not permanent. 188 of the 1,422 schools that missed SY 2020-2021 appear again in a later file. So do 80 of the 833 that missed SY 2021-2022.
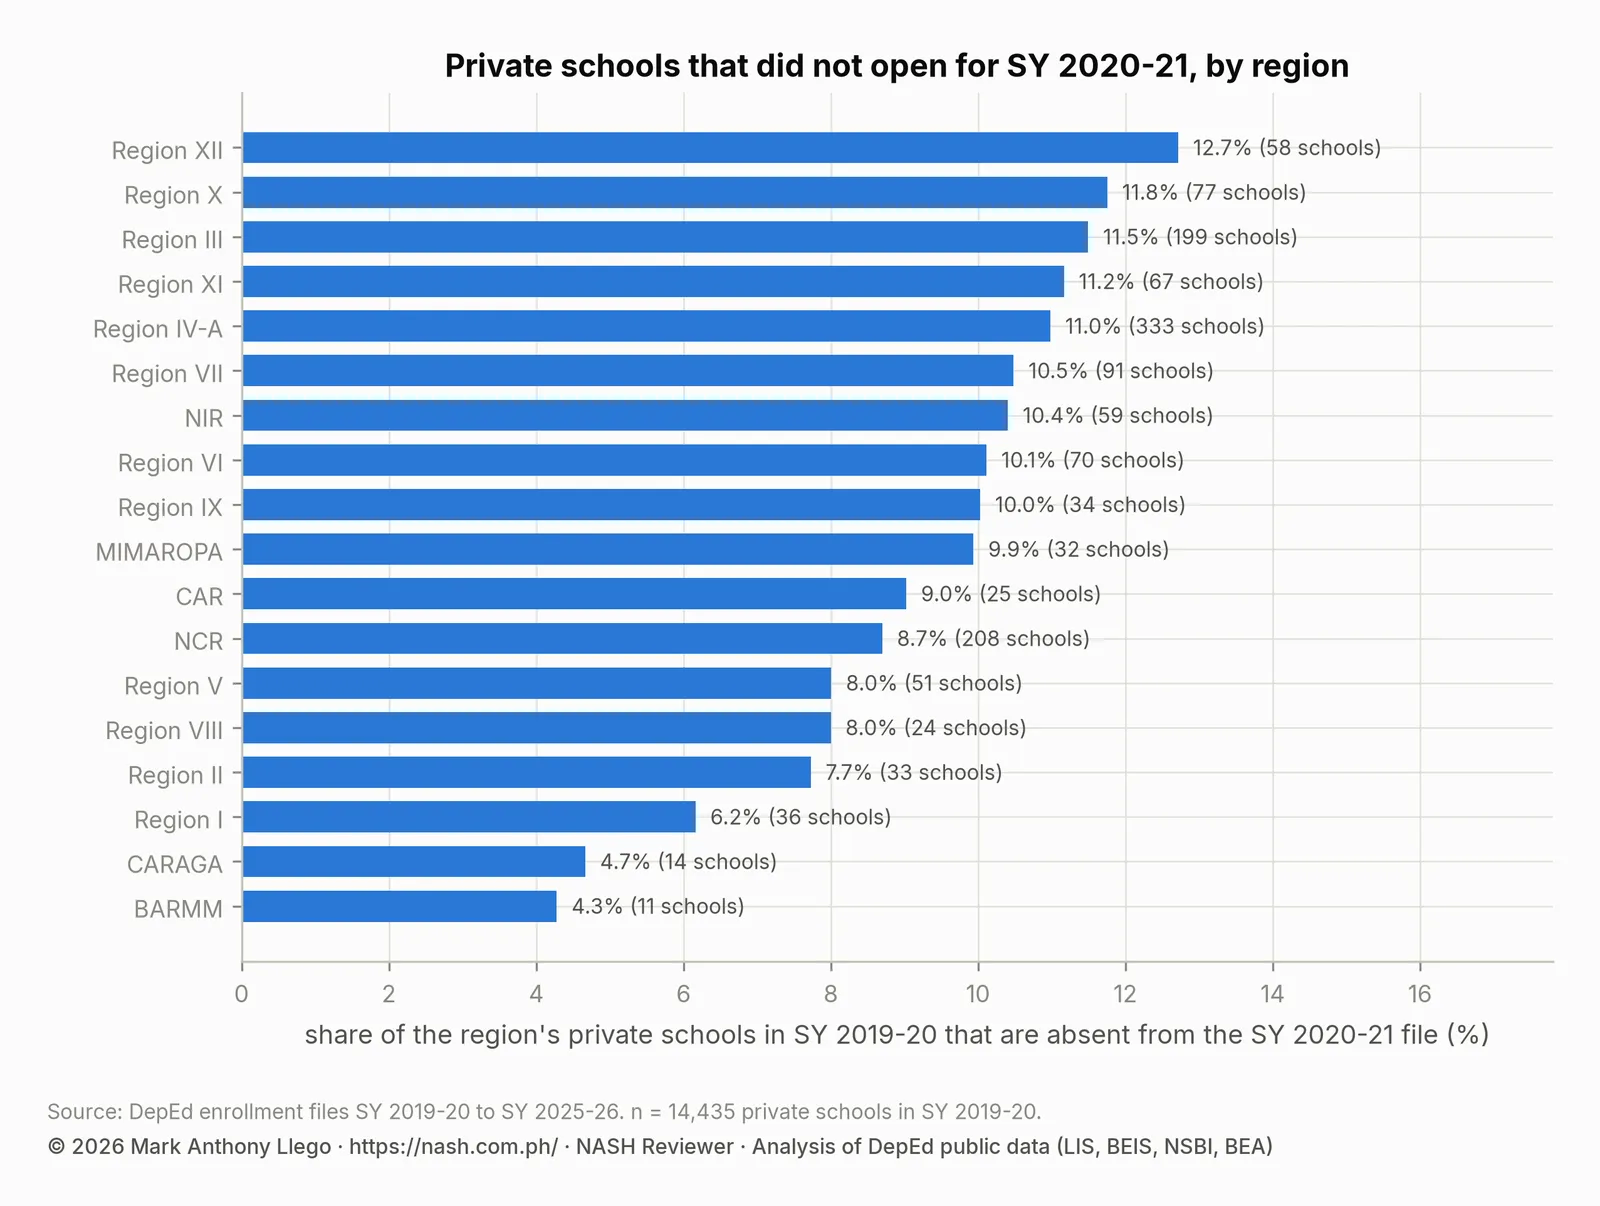
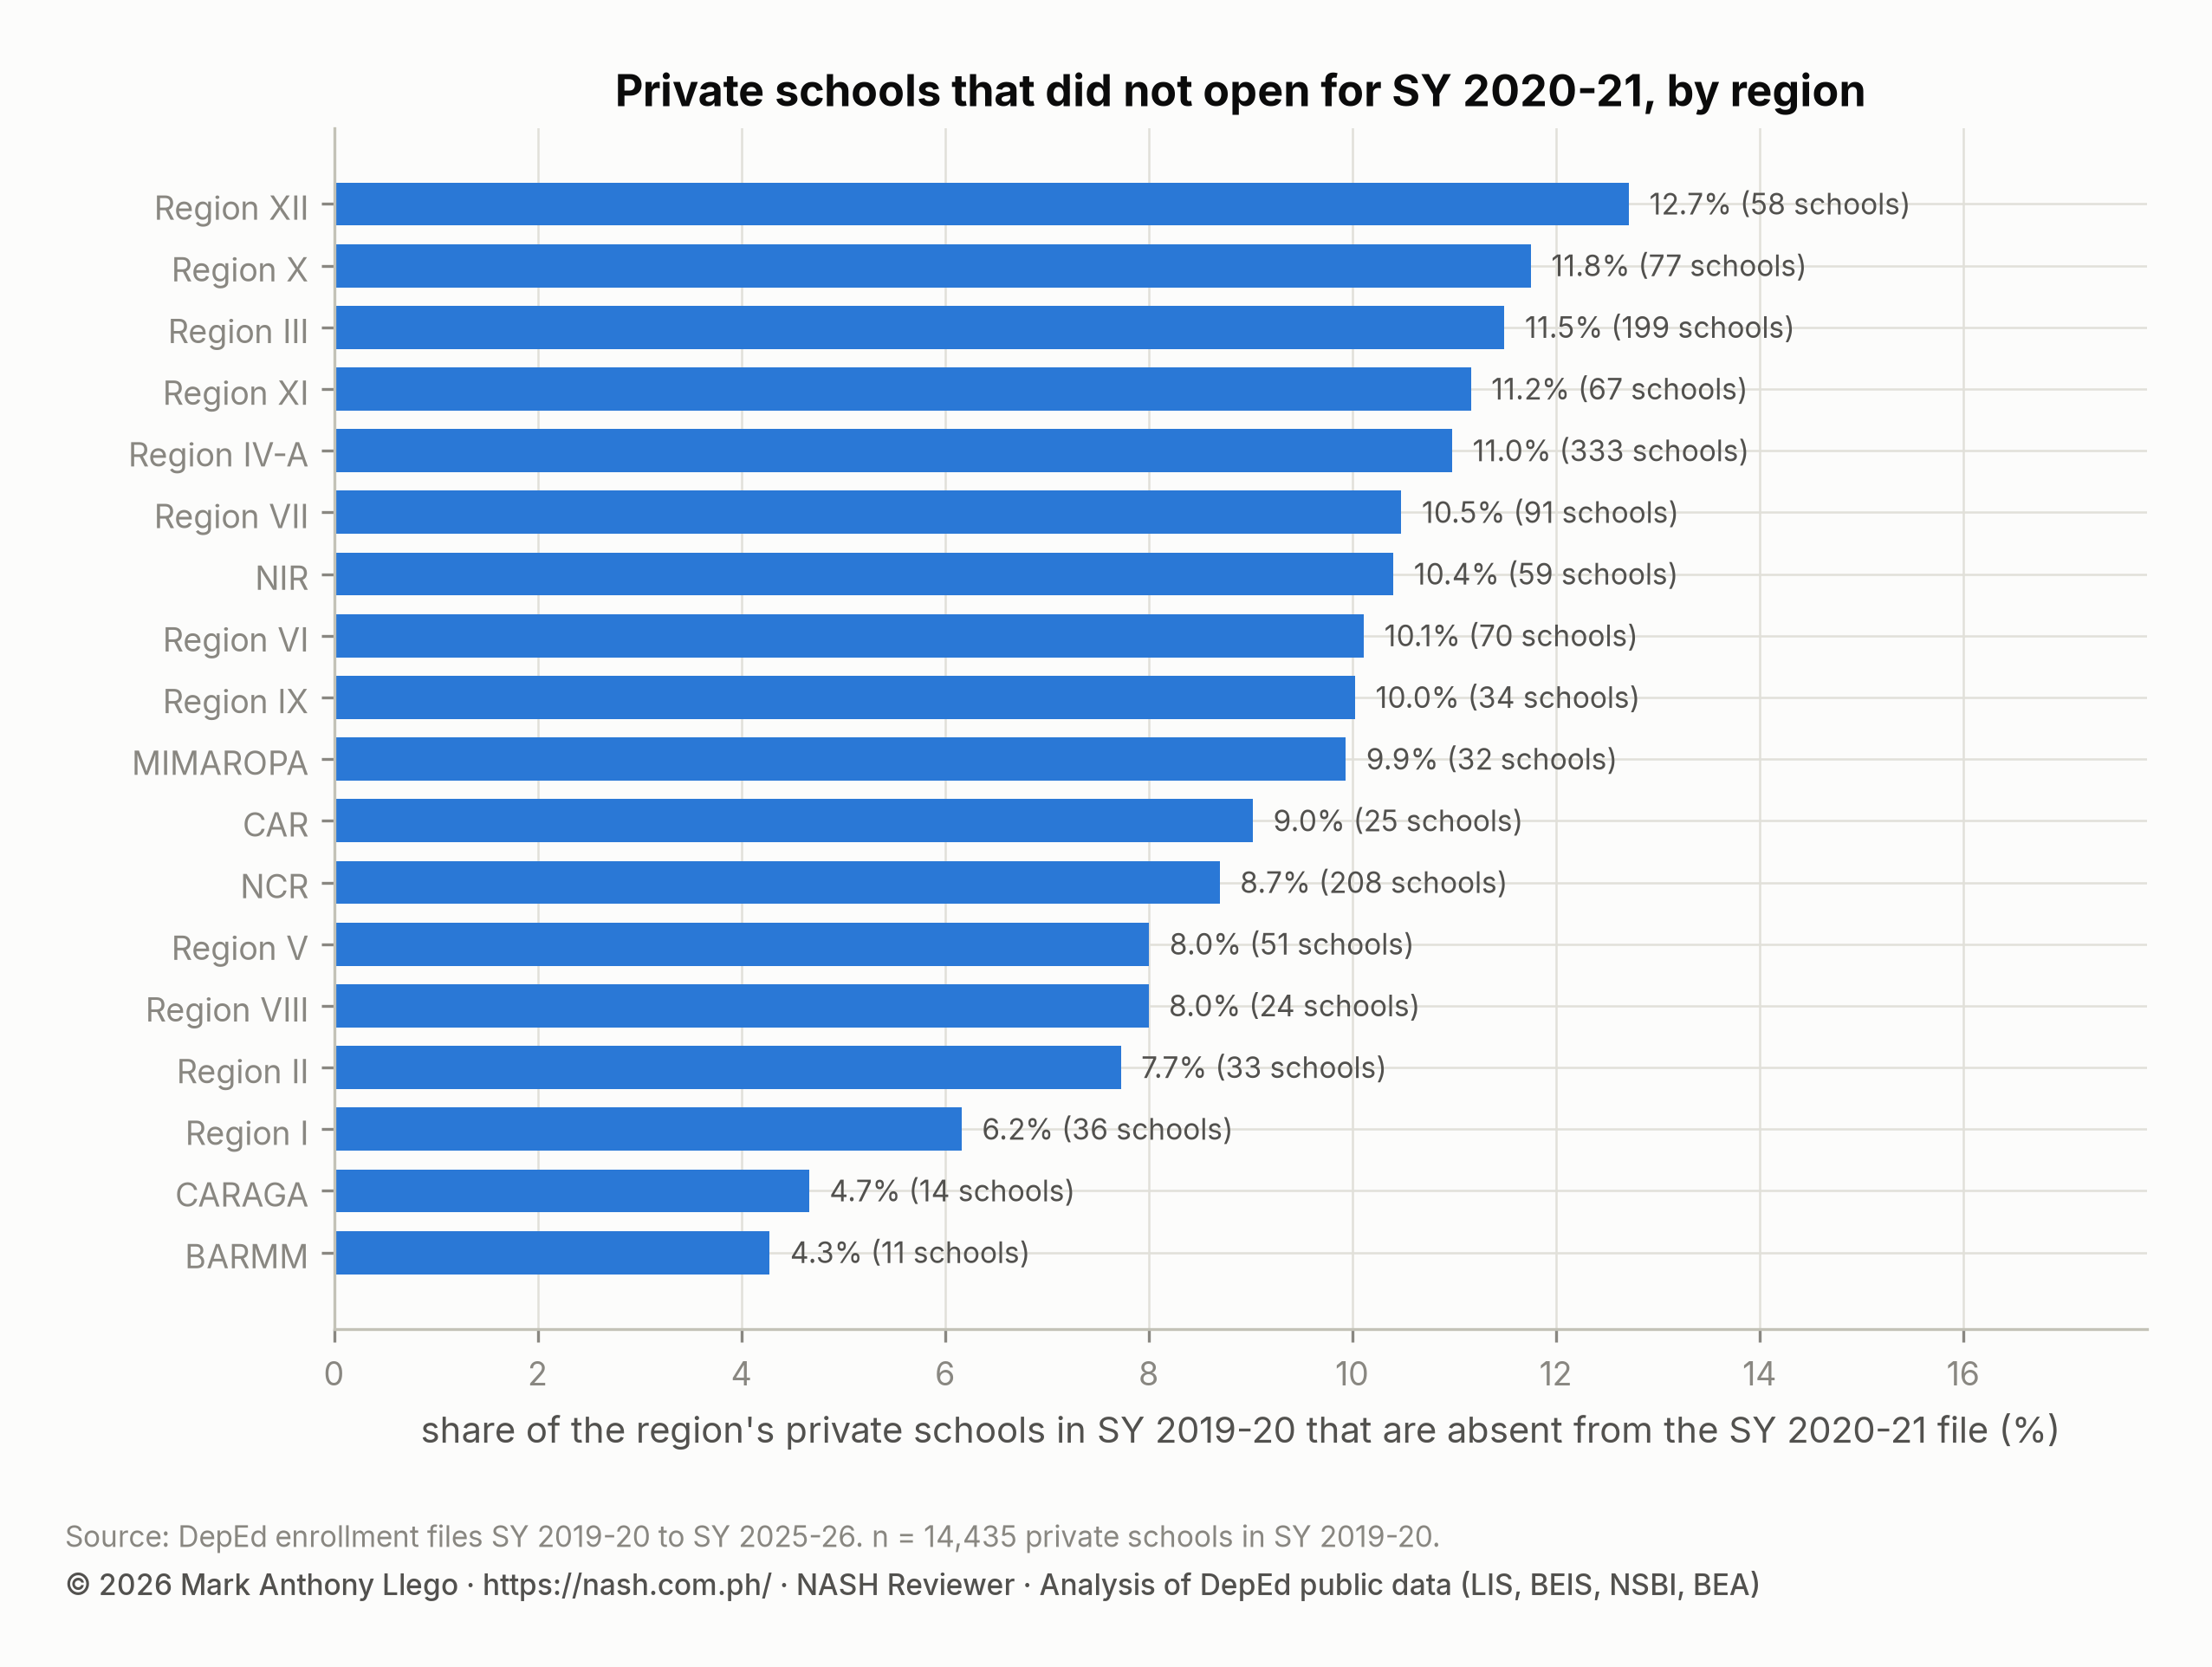
By share, Region XII lost the most: 12.7% of its private schools, or 58 of 456. Region X (11.8%) and Region III (11.5%) follow; the table lists every region. BARMM lost 4.3% and CARAGA 4.7%.
By count, Region IV-A’s 333 and NCR’s 208 closures were the largest. NCR’s share, 8.7%, was below the national 9.9%, because the capital’s private schools were larger and more likely to survive a year online.
| Region | Private schools SY 2019-20 | Closed after SY 2019-20 | Share closed | Learners in closed schools | Private enrollment change | Public enrollment change | Private loss as share of public enrollment |
|---|---|---|---|---|---|---|---|
| Region XII | 456 | 58 | 12.7% | 2,313 | -21.3% | +1.9% | 2.8% |
| Region X | 655 | 77 | 11.8% | 2,071 | -15.1% | +0.7% | 2.3% |
| Region III | 1731 | 199 | 11.5% | 11,116 | -23.7% | +2.2% | 5.6% |
| Region XI | 600 | 67 | 11.2% | 4,510 | -24.2% | -1.9% | 4.1% |
| Region IV-A | 3032 | 333 | 11.0% | 17,999 | -25.7% | +1.8% | 7.6% |
| Region VII | 868 | 91 | 10.5% | 4,766 | -21.4% | -0.1% | 4.4% |
| NIR | 567 | 59 | 10.4% | 1,788 | -16.5% | +0.8% | 2.0% |
| Region VI | 692 | 70 | 10.1% | 1,970 | -20.2% | +3.4% | 2.5% |
| Region IX | 339 | 34 | 10.0% | 1,749 | -13.1% | +0.2% | 1.2% |
| MIMAROPA | 322 | 32 | 9.9% | 960 | -12.1% | +0.9% | 1.1% |
| CAR | 277 | 25 | 9.0% | 849 | -14.8% | +3.0% | 3.8% |
| NCR | 2391 | 208 | 8.7% | 11,165 | -26.5% | -0.9% | 10.9% |
| Region V | 637 | 51 | 8.0% | 1,700 | -15.4% | -5.7% | 1.6% |
| Region VIII | 300 | 24 | 8.0% | 836 | -14.5% | +1.5% | 1.1% |
| Region II | 427 | 33 | 7.7% | 547 | -13.2% | +4.1% | 1.8% |
| Region I | 584 | 36 | 6.2% | 2,155 | -18.2% | +2.5% | 2.8% |
| CARAGA | 300 | 14 | 4.7% | 524 | -13.6% | +2.1% | 1.4% |
| BARMM | 257 | 11 | 4.3% | 218 | -7.4% | -2.4% | 1.1% |
At the division level, the closures cluster in the private-school belt around Manila and in Cebu. Rizal lost 63 of its 526 private schools. Quezon City lost 36 of 662.
Pampanga lost 18.6% of its private schools and Cebu City 17.4%. The table lists the twenty divisions with the most closures.
| Division | Region | Private schools SY 2019-20 | Closed after SY 2019-20 | Share closed | Learners in closed schools |
|---|---|---|---|---|---|
| Rizal | Region IV-A | 526 | 63 | 12.0% | 2,955 |
| Quezon City | NCR | 662 | 36 | 5.4% | 2,026 |
| Pampanga | Region III | 188 | 35 | 18.6% | 1,573 |
| Cebu City | Region VII | 190 | 33 | 17.4% | 1,810 |
| Laguna | Region IV-A | 250 | 33 | 13.2% | 1,465 |
| Antipolo City | Region IV-A | 204 | 30 | 14.7% | 2,220 |
| Tarlac | Region III | 156 | 27 | 17.3% | 1,454 |
| Iloilo | Region VI | 244 | 25 | 10.2% | 481 |
| Bacoor City | Region IV-A | 173 | 24 | 13.9% | 2,066 |
| Bacolod City | NIR | 154 | 23 | 14.9% | 644 |
| Dasmarinas City | Region IV-A | 165 | 23 | 13.9% | 1,738 |
| Cebu | Region VII | 227 | 23 | 10.1% | 1,668 |
| City of San Jose Del Monte | Region III | 134 | 22 | 16.4% | 1,655 |
| Batangas | Region IV-A | 234 | 21 | 9.0% | 698 |
| Cavite | Region IV-A | 335 | 21 | 6.3% | 804 |
| Imus City | Region IV-A | 143 | 20 | 14.0% | 1,054 |
| Paranaque City | NCR | 149 | 20 | 13.4% | 1,178 |
| Misamis Oriental | Region X | 86 | 19 | 22.1% | 442 |
| Davao City | Region XI | 271 | 19 | 7.0% | 1,824 |
| Pasig City | NCR | 150 | 19 | 12.7% | 1,388 |
Closures explain 7% of the private enrollment loss
Here the data diverge from the common account. The private sector lost 928,928 learners between SY 2019-2020 and SY 2020-2021. The 1,422 schools that did not open account for 67,236 of them, or 7.2%.
The 13,013 private schools that stayed open lost 873,880 learners between them, 94.1% of the total. Their enrollment fell from 4,237,440 to 3,363,560 (−20.6%). The 243 private schools that appear for the first time in SY 2020-2021 added 12,188 learners back.
The private sector did not shrink because schools closed. It shrank because the schools that stayed open lost one learner in five. Families who could not pay fees during the lockdown, or who did not want to pay for distance learning, withdrew their children.
The schools that closed were the smallest in the sector. Together they held fewer learners than a single large division loses in a bad year.
Public enrollment gains by municipality, SY 2020-2021
The national totals set a ceiling. Public enrollment rose by 139,486 in SY 2020-2021 while private enrollment fell by 928,928. Even if every public gain were a transfer, public schools absorbed at most 15% of the private loss. The other 790,000 learners were in no school in the file: they deferred, were home-schooled outside the system, or were simply not enrolled.
The municipality-level comparison narrows the estimate. The comparison takes the 1,637 municipalities and cities with at least 500 public learners in SY 2019-2020 and groups them by what happened to their private schools:
- In the 253 municipalities with no private school, public enrollment rose 0.5% (pooled), and the median municipality rose 1.6%.
- In the 903 municipalities with private schools but no closure, public enrollment was flat (0.0% pooled), and the median municipality rose 1.6%.
- In the 481 municipalities with at least one closure, public enrollment rose 1.0% (pooled), and the median municipality rose 2.3%.
Sorting the 1,384 municipalities with private schools into quarters, by how much private enrollment they lost per 100 public learners, shows the same pattern:
| Private loss as share of public enrollment, SY 2019-20 to 2020-21 | Municipalities | Private loss per 100 public learners (median) | Public enrollment change 2019-20 to 2020-21 (pooled) | Median municipality | Public change 2019-20 to 2021-22 (pooled) |
|---|---|---|---|---|---|
| lowest quarter | 346 | -0.1 | -0.6% | +0.9% | +3.3% |
| second | 346 | 0.5 | +0.5% | +1.7% | +5.1% |
| third | 346 | 1.5 | +0.4% | +1.9% | +5.9% |
| highest quarter | 346 | 5.2 | +1.1% | +2.9% | +8.6% |
In the quarter of municipalities where private schools lost the most, 5.2 private learners per 100 public ones at the median, public enrollment rose 1.1% in SY 2020-2021. It rose 8.6% by SY 2021-2022. In the quarter where private schools lost the least, public enrollment fell 0.6% and then rose 3.3%.
The gap of about five points over two years is the transfer effect. It is real but modest.
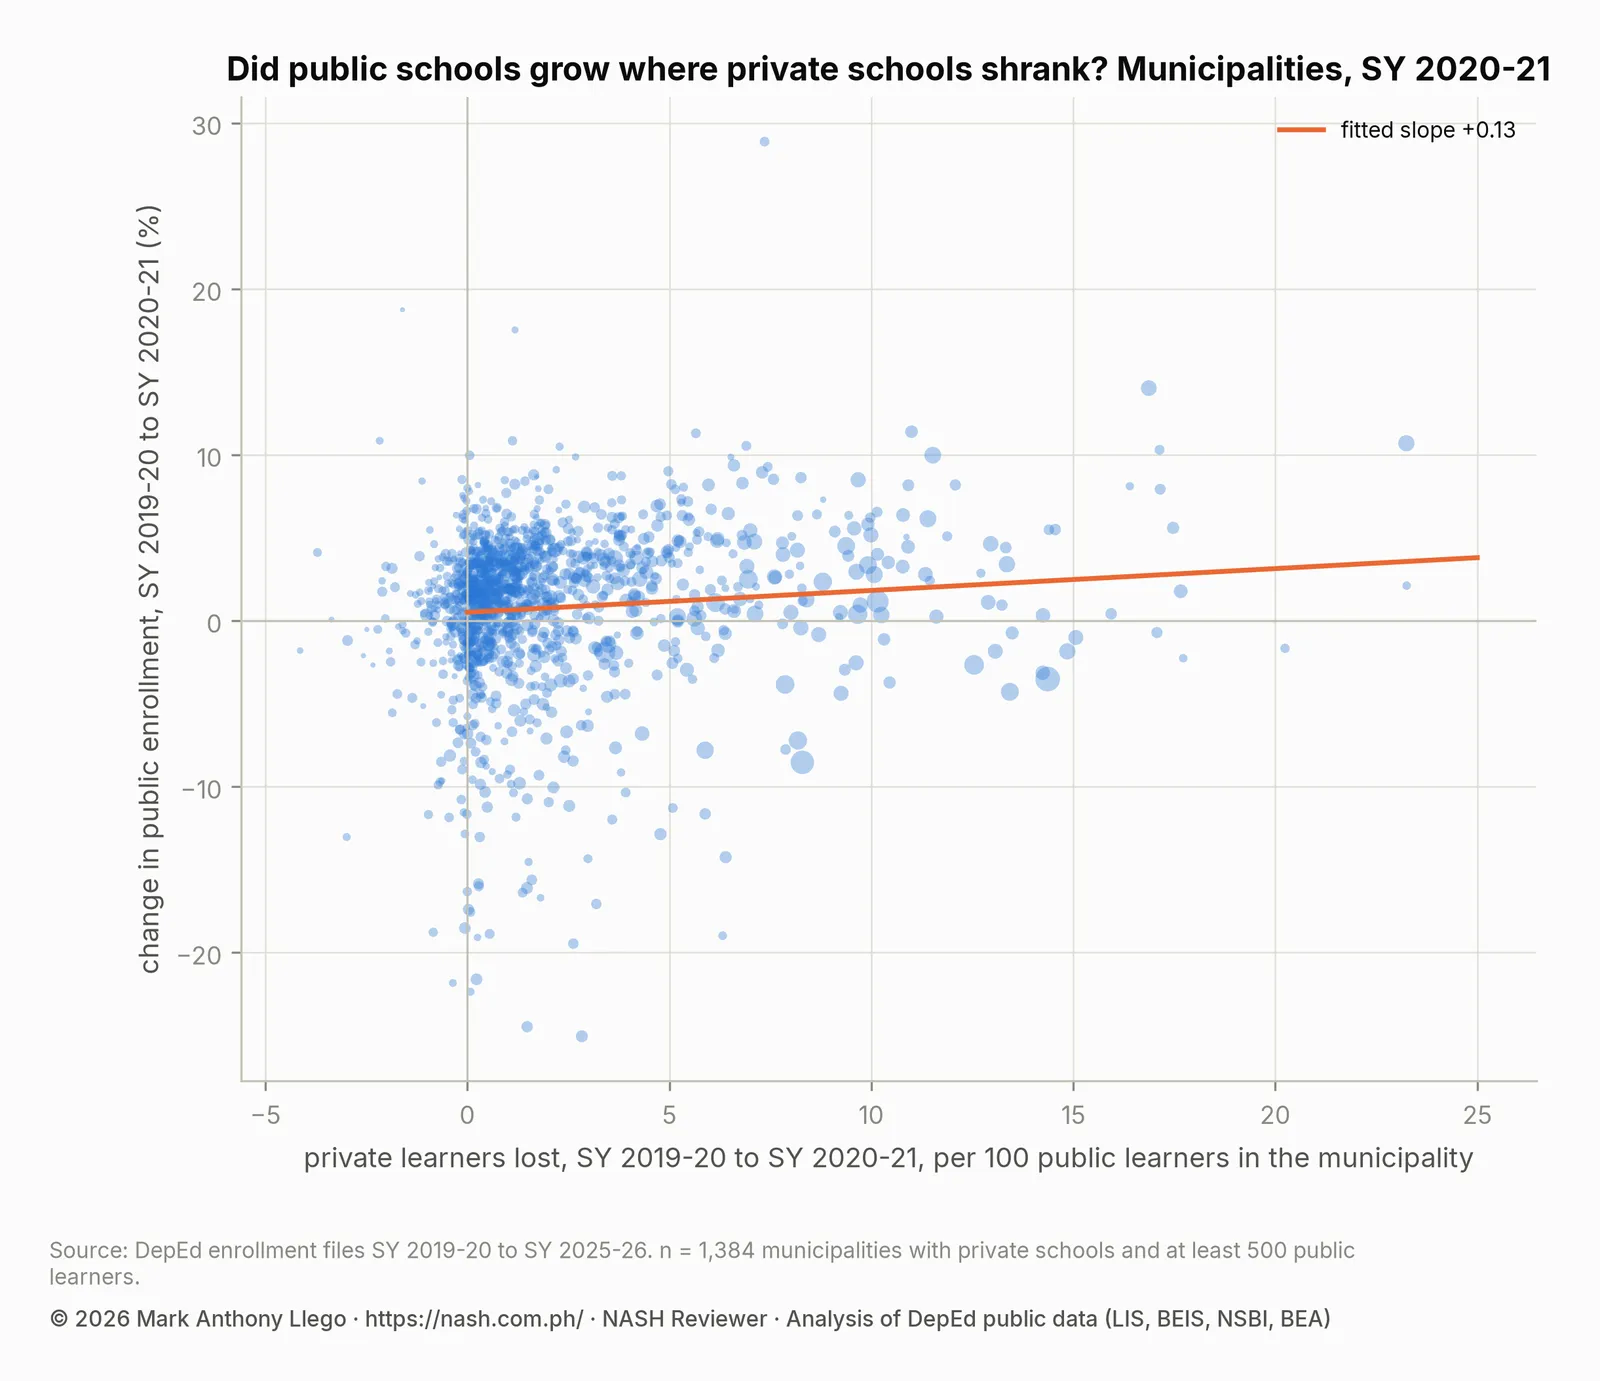
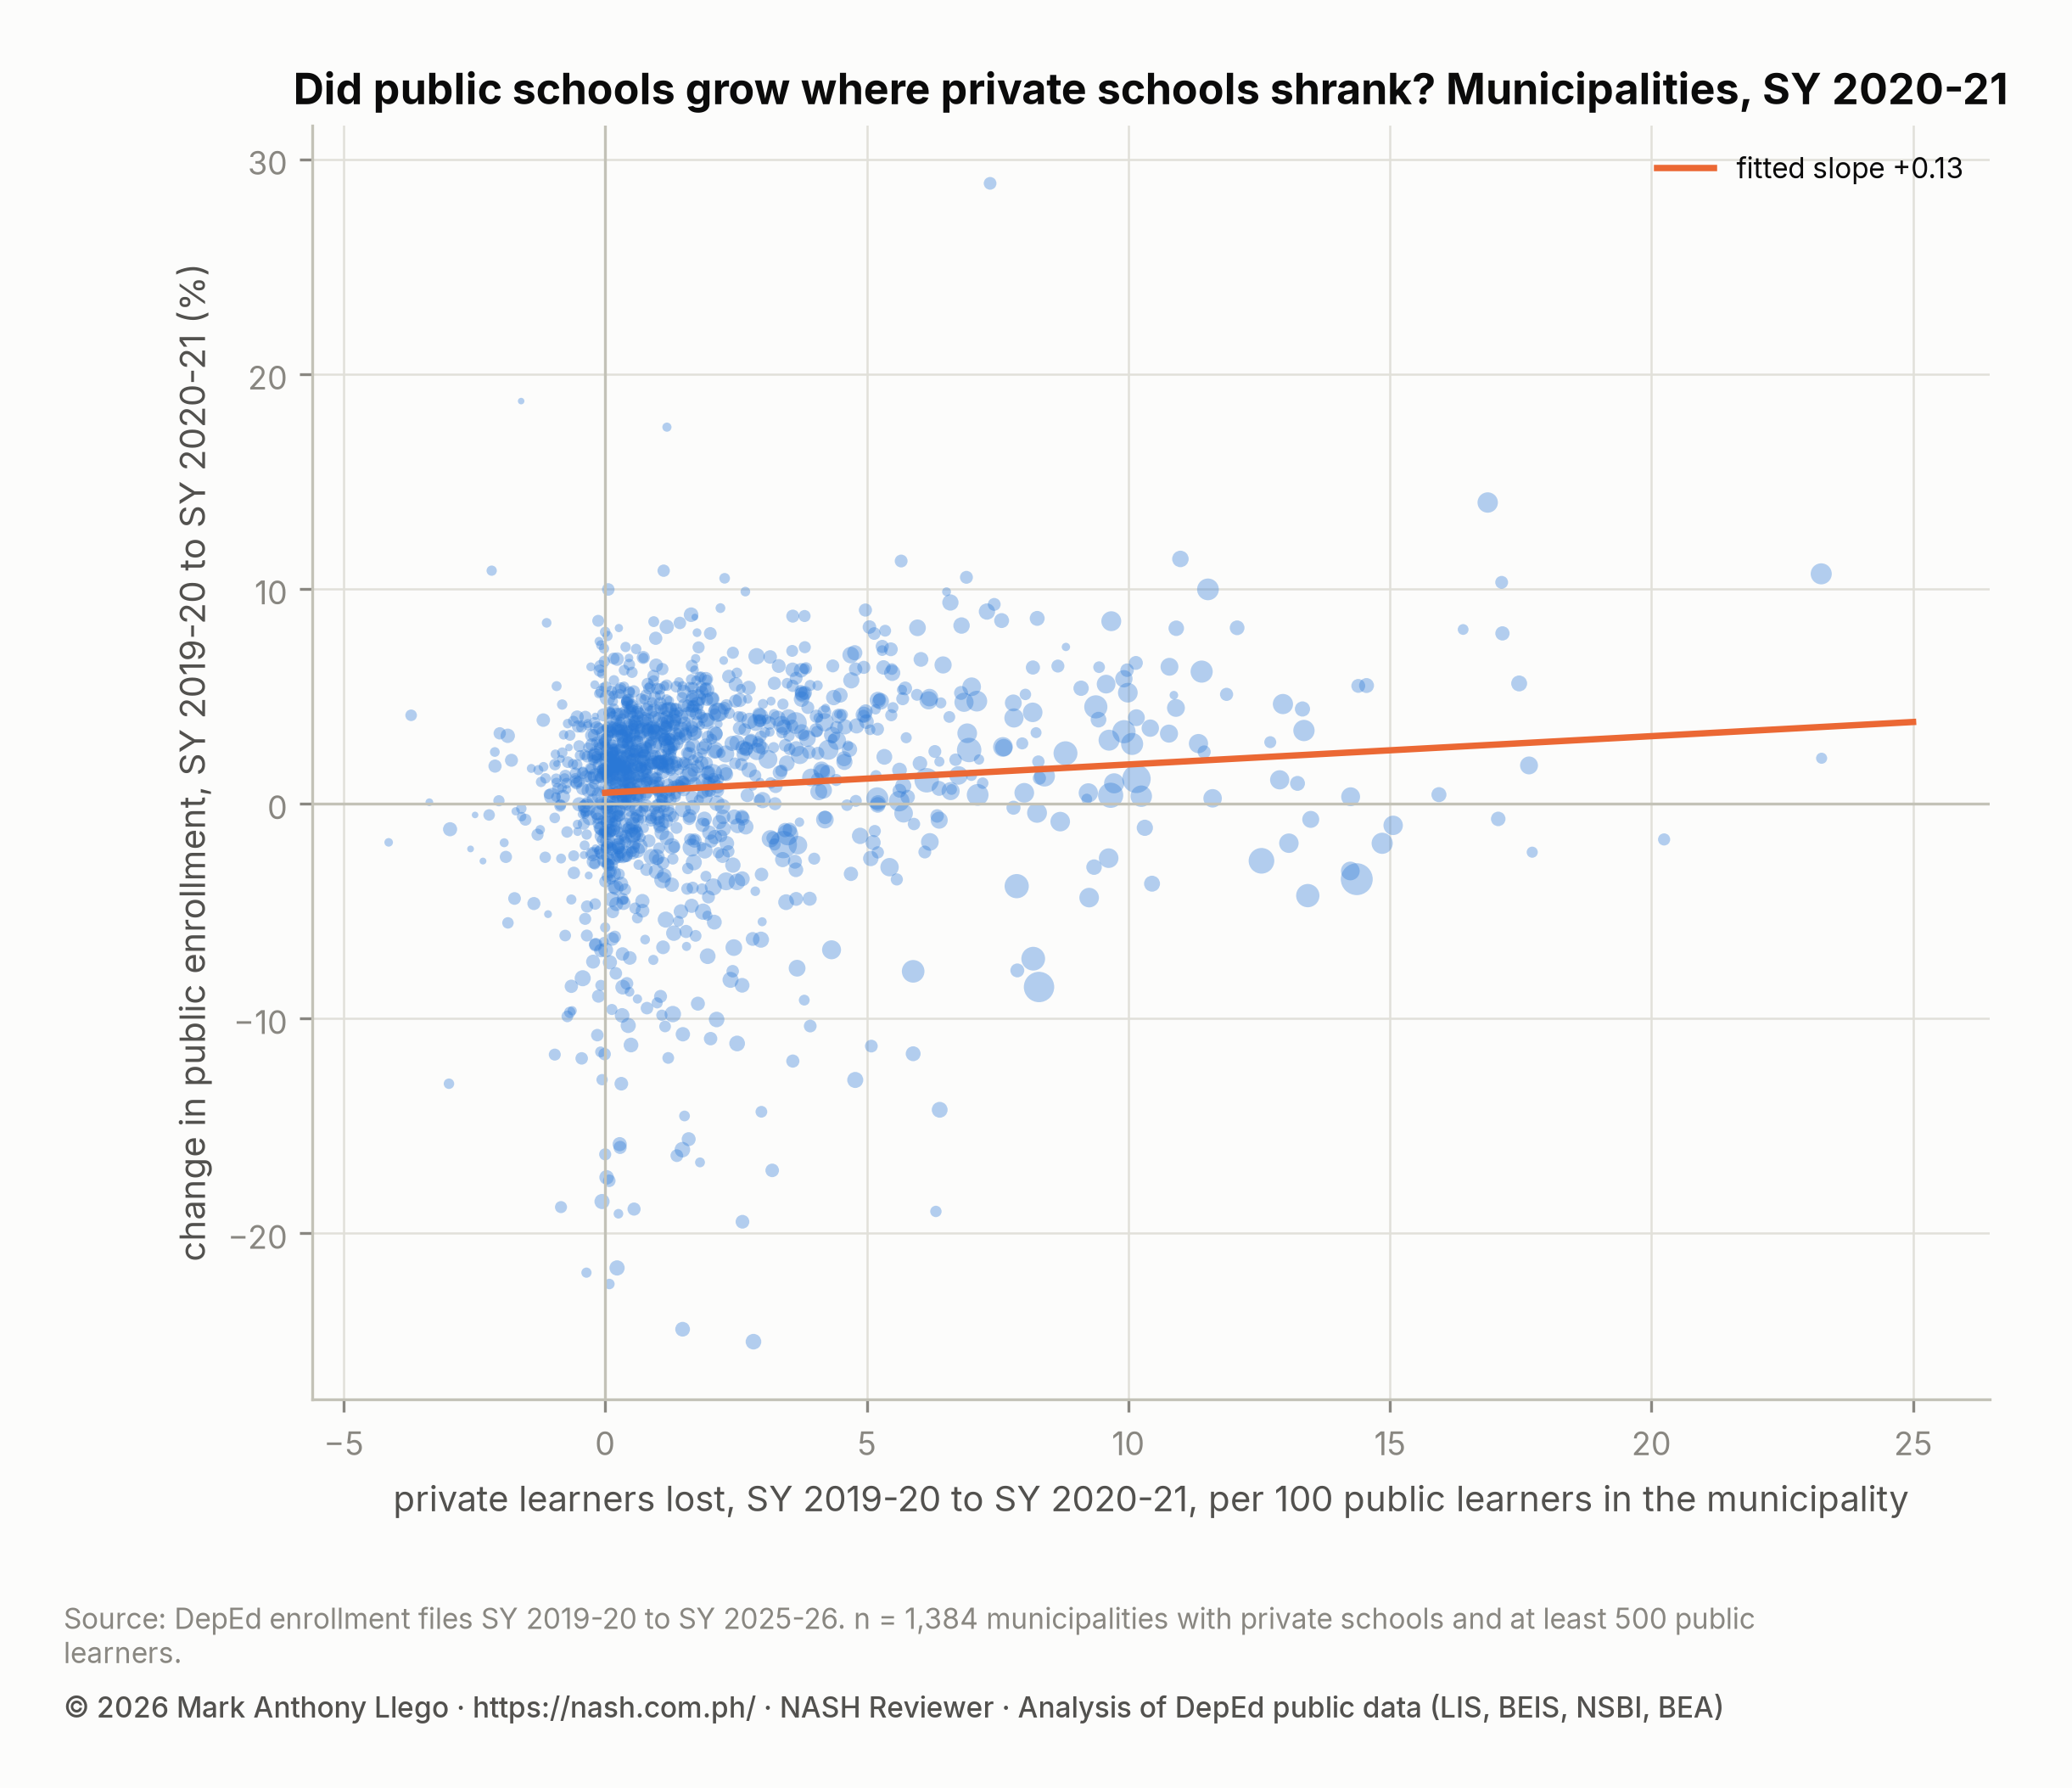
A weighted regression with region effects gives an estimate. For each private learner lost per 100 public learners in a municipality, public enrollment in SY 2020-2021 rose by 0.13 percentage points (confidence interval 0.02 to 0.24). That is, about one private learner in eight enrolled in a local public school the same year.
Measured to SY 2021-2022, the coefficient rises to 0.30 (0.18 to 0.42). By the second year, roughly three in ten of the private learners lost had appeared in public schools in the same municipality. Closures alone have a larger coefficient, 1.03 (0.17 to 1.89). That fits a pattern in which learners from a school that shuts must go somewhere, while learners withdrawn from a school that stays open often go nowhere for a year.
What this means
The pandemic did not move a million learners from private to public schools in a year. It removed about 930,000 learners from private rolls. Roughly one in eight of them enrolled in a nearby public school at once, and perhaps three in ten had done so by the following year. The rest returned to private schools as they reopened in person, came back to school in the SY 2021-2022 rebound of 1.33 million learners, or did not come back.
The private sector’s share of enrollment was 15.9% in SY 2019-2020, 12.9% in SY 2020-2021 and 14.5% in SY 2025-2026. It has recovered about half of what it lost.
For public schools the effect was concentrated. The municipalities in the top quarter of private loss took in several percent more learners over two years, mostly in Cavite, Rizal, Laguna, Bulacan, Pampanga and Metro Cebu. Those are the places where classroom pressure was greatest in SY 2021-2022 and SY 2022-2023.
How these numbers were made and what the file cannot say
- A school “closed” here if it is in one year’s file and not the next. Some schools that failed to report were open; 188 of the 1,422 reappear later.
- The files cannot track learners individually. The municipality comparison measures association, not transfers. The regression coefficients are read as the share of lost private learners that appear in local public rolls.
- Municipalities are matched by region, province and municipality name across the two files. Those with fewer than 500 public learners in SY 2019-2020 are excluded to keep percentage changes meaningful.
- Regions follow SY 2025-2026 boundaries.
- Private enrollment changes include learners who moved between private schools, which the files cannot see.
What this means for school heads
The National Assessment for School Heads (NASH) tests judgment under uncertainty, and SY 2020-2021 is the recent case study. A school head who expected a large number of transferees in June 2020 was wrong, and so was one who expected none. The data say about one in eight arrived at once and more came over two years, concentrated in the private-school belt.
Domain 1 (Strand 1.3) of the Philippine Professional Standards for School Heads (PPSSH) asks for planning on evidence. Domain 2 (Strand 2.1, “records management”) asks for the enrollment records that would have shown each school its own version of this. The SY 2020-2021 enrollment report gives the national figures for that year.
Frequently asked questions
How many private schools in the Philippines closed in 2020 because of the pandemic?
1,422 private schools in the SY 2019-2020 file did not report enrollment for SY 2020-2021, and 833 more dropped out the following year. They were small. The median closing school had 22 learners, and together the first wave held 67,236.
Did private school learners transfer to public schools in SY 2020-2021?
Partly. For each private learner lost per 100 public learners in a municipality, public enrollment rose 0.13 points in SY 2020-2021 and 0.30 points by SY 2021-2022. Roughly one in eight transferred at once and about three in ten within two years. Most of the private loss came from schools that stayed open, not from closures.
How much of the private enrollment loss in SY 2020-2021 came from closures?
Closures explain 7.2% of the loss. The 1,422 closed schools held 67,236 of the 928,928 learners the private sector lost. The 13,013 schools that stayed open lost 873,880.
Download the data
The cleaned, harmonized DepEd files behind this series are free to download in CSV and Parquet, with a codebook and checksums, under the terms of use set out in the release. Download Cleaned DepEd School Data, SY 2017-18 to 2025-26 documents every file and column. The files themselves are at data.nash.com.ph, starting with the README, the SY 2023-24 school master file (CSV, 8.0 MB) and the nine-year enrollment panel (Parquet, 17.2 MB).
More in this series
- DepEd Enrollment SY 2020-2021: The Pandemic Drop and DepEd Enrollment SY 2021-2022: Rebound to 27.6 Million
- NAT Grade 6 SY 2023-2024: Private vs Public School Scores
- DepEd Enrollment Trends SY 2017-2018 to SY 2025-2026
- Enrollment by school year: SY 2017-18, SY 2018-19, SY 2019-20, SY 2020-21, SY 2021-22, SY 2022-23, SY 2023-24, SY 2024-25, SY 2025-26
- DepEd Data for Aspiring School Heads: Where to Start
- For aspiring school heads: How to Read DepEd Data and the full report, Philippine basic education in numbers
Analysis and charts by Mark Anthony Llego for NASH Reviewer. Data: Department of Education enrollment datasets SY 2019-20 to SY 2025-26 (Learner Information System). Charts may be reused only with written permission from support@nash.com.ph.