Region V (the Bicol Region, often searched as Region 5 or Bicol) lacked 7,415 classrooms in 2023, according to DepEd’s classroom shortage data as published in the EDCOM II classroom construction dashboard. Its share of the national shortage of 165,443 classrooms is 4.5%, the 10th largest among the 18 regions. Set against enrollment, the gap is smaller than in most of the country: 4.9 classrooms for every 1,000 learners enrolled in SY 2024-25, against 7.4 nationally, which places Bicol 14th of the 18 regions by rate.
No part of Bicol reaches the national rate. All 13 schools divisions are below 7.4, the highest being Legaspi City at 6.6. What divides the region is the School Building Program (SBP) 2026. Its 2,370 classrooms for Region V equal 32.0% of the shortage, against 19.6% nationally, but they are spread unevenly: the Sorsogon division has more classrooms on the list than it is short, while the Albay division has classrooms for 11.7% of its shortage, the lowest in the region. Daraga National High School in Albay, short 135 classrooms, more than any other school in Bicol, has none.
The figures below come from the cleaned school-level data behind the dashboard. Every file is listed on the EDCOM II classroom data page.
Key findings
- Region V lacked 7,415 classrooms in 2023, 4.9 for every 1,000 learners against 7.4 nationally, and none of its 13 divisions is above the national rate.
- Camarines Sur, the provincial division, holds the largest shortage, 2,384 classrooms (32.2%), and Legaspi City has the highest rate, 6.6 per 1,000 learners.
- The SBP 2026 list holds 2,370 classrooms for the region, 7.3% of the national list against the region’s 4.5% of the shortage, and 1,492 of them (63.0%) are PSIP III classrooms.
- Coverage runs from 11.7% in the Albay division to 164.3% in Iriga City, and three divisions, Iriga City, Sorsogon and Naga City, have more classrooms on the list than their shortage.
- Only three of the 10 schools with the largest shortages are on the list; Daraga National High School, short 135, and Nabua National High School, short 103, have none.
- Every city and municipality with a shortage gets at least one 2026 classroom, and 14 get more than their shortage, 185 classrooms beyond it in all.
- 31.1% of the region’s schools report a building for condemnation or demolition, 2,115 buildings, against 28.9% nationally.
Region V against the country
The table compares the region with the country on the same definitions.
| Indicator | Region V | Philippines |
|---|---|---|
| Schools in the 2023 shortage data | 3,852 | 47,659 |
| Schools with a classroom shortage | 51.5% | 54.2% |
| Classroom shortage (2023) | 7,415 | 165,443 |
| Shortage per 1,000 learners | 4.9 | 7.4 |
| SBP 2026 classrooms | 2,370 | 32,419 |
| SBP 2026 classrooms as a share of the shortage | 32.0% | 19.6% |
| Schools with a shortage that get any SBP 2026 classroom | 17.2% | 13.3% |
| Schools with two or more shifts (SY 2024-25) | 1.9% | 4.3% |
| Median learners per classroom, elementary | 24.5 | 24.9 |
| Last Mile Schools | 16.2% | 18.5% |
| Schools using makeshift rooms (2023) | 33.1% | 29.0% |
| Schools with a building for condemnation or demolition | 31.1% | 28.9% |
On the shortage itself, Bicol is better off than the country: its rate is about two-thirds of the national one, and fewer of its schools run shifts. On the 2026 list it is also ahead, with classrooms for 32.0% of its shortage and 17.2% of its schools with a shortage receiving at least one. The two rows where it is worse off are about the rooms it already has: more of its schools use makeshift rooms, 33.1% against 29.0%, and more have a building for condemnation or demolition, 31.1% against 28.9%.
Kindergarten to Grade 10 accounts for 5,847 classrooms of the shortage and senior high school for 1,569, or 21.2%, a larger senior high share than the country’s, where Kindergarten to Grade 10 accounts for 89.3% of the shortage. The shortage is also mostly rural: the region’s 3,448 rural schools hold 68.4% of it and its 401 urban schools 31.3%, nearly the reverse of the national split, where urban schools carry 60.2%. Per learner, urban schools lack more, 5.6 classrooms per 1,000 against 4.6 in rural schools. Meanwhile 1,326 schools report 3,839 more Kindergarten to Grade 10 classrooms than they need; those rooms do not reduce another school’s shortage.
Classroom shortage by division in Region V
Region V has 13 schools divisions: six provincial divisions, one for each province, and seven city divisions, Legaspi City, Naga City, Sorsogon City, Ligao City, Masbate City, Tabaco City and Iriga City. DepEd’s division list spells Legazpi as “Legaspi City”; the city’s own name in the PSGC is Legazpi. The chart ranks the divisions by the shortage per 1,000 learners.
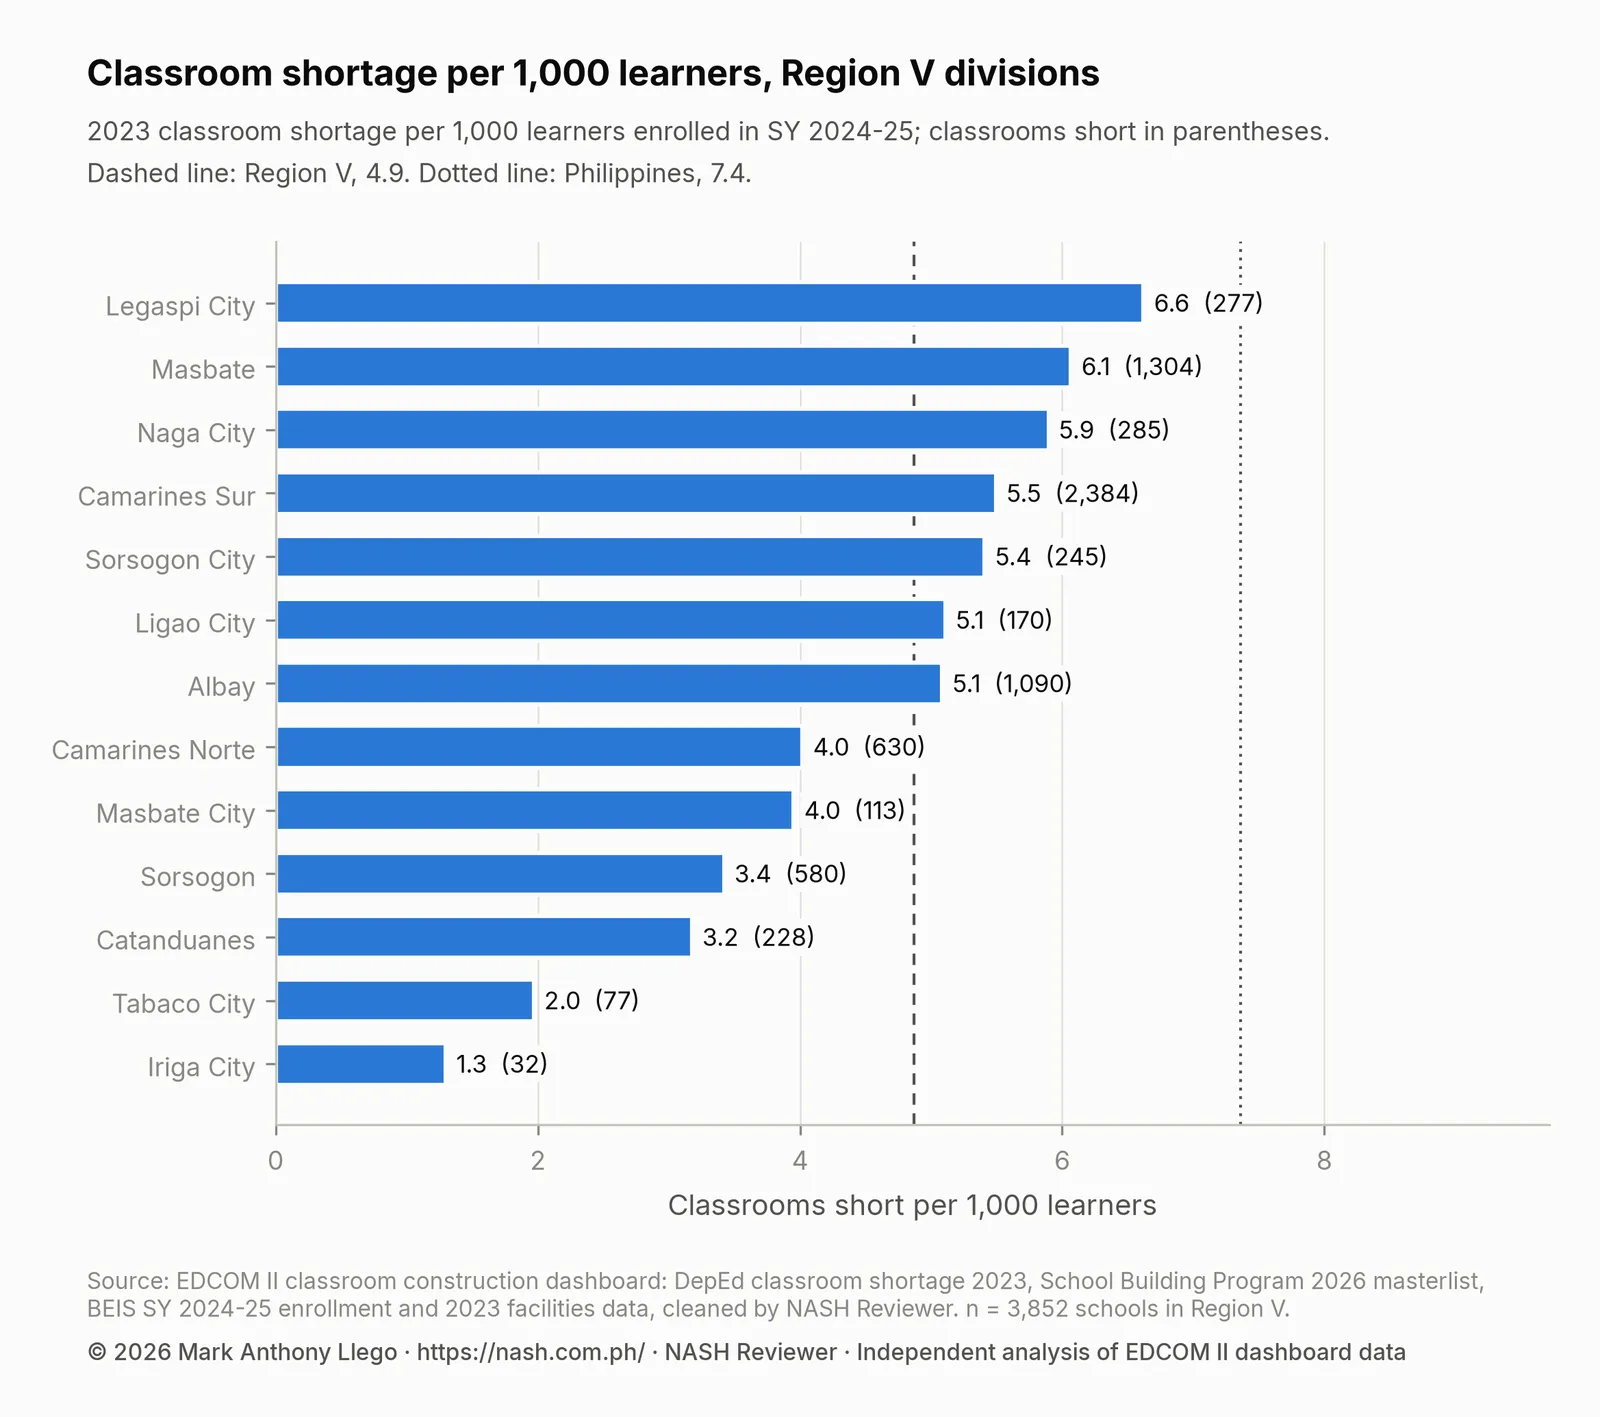
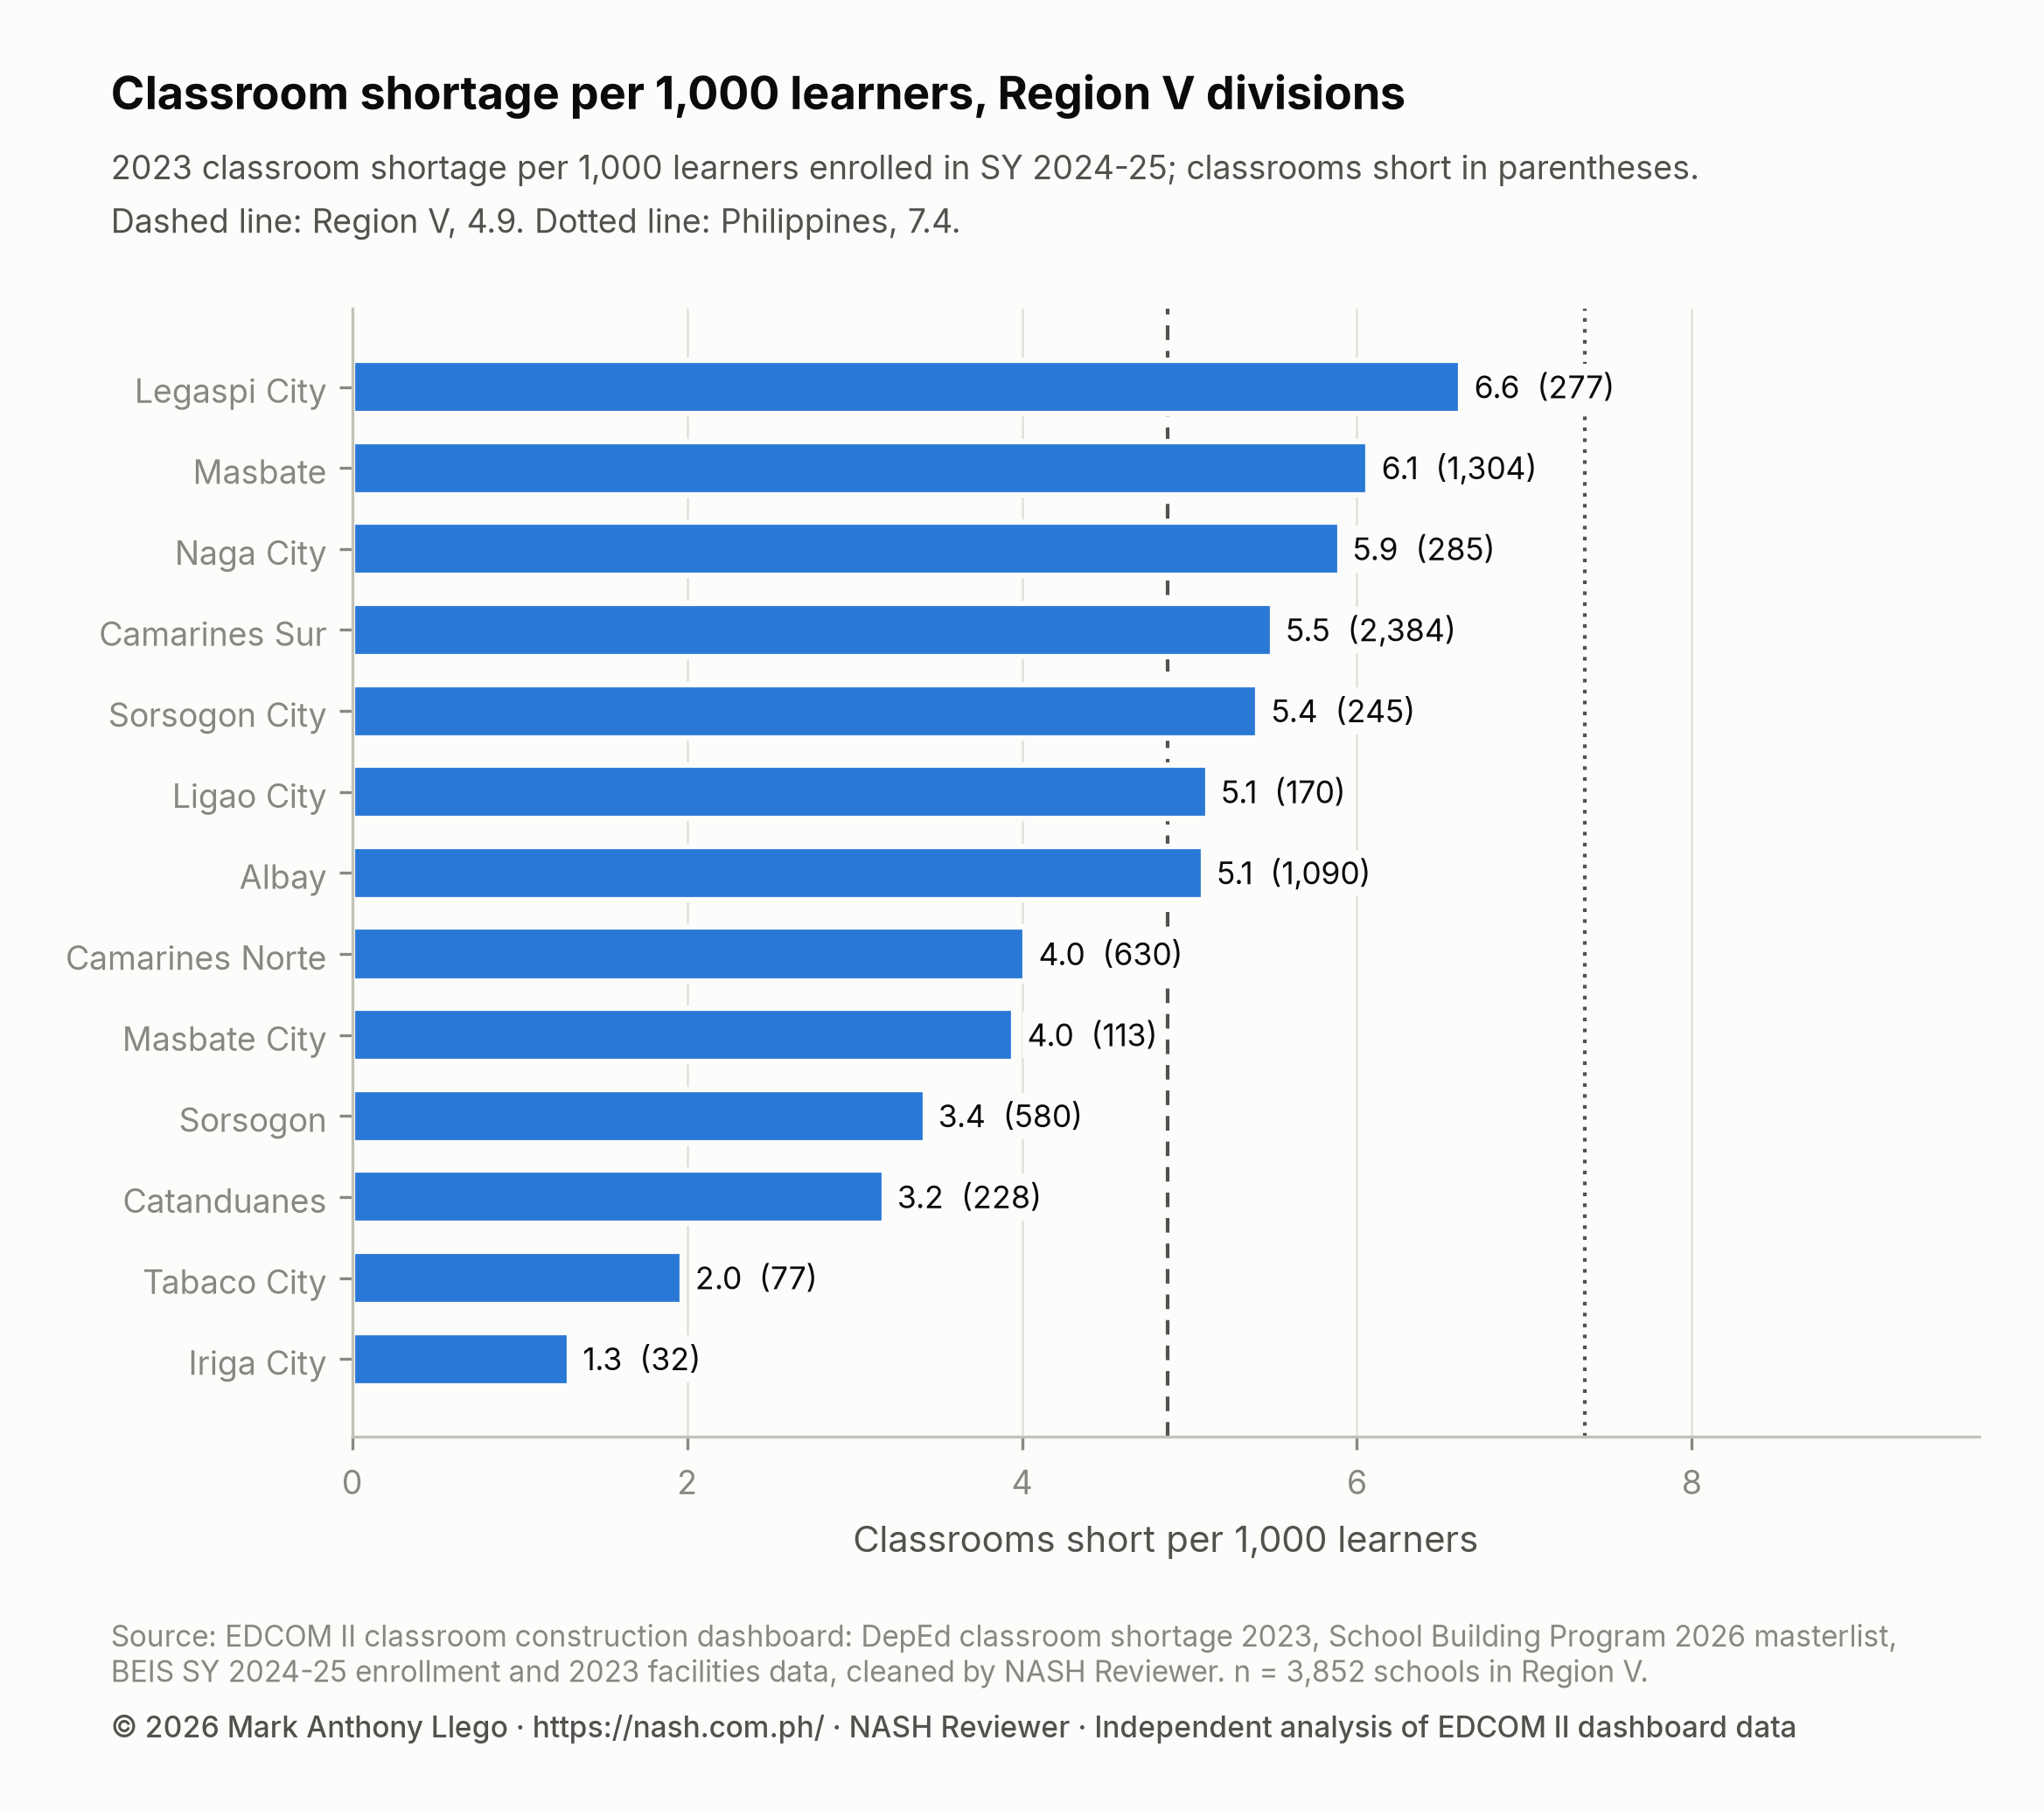
Every bar stops short of the national line. Legaspi City, Masbate and Naga City lead, and the rates fall to 1.3 in Iriga City. Albay’s three city divisions sit far apart: Legaspi City at 6.6, Ligao City at 5.1 and Tabaco City at 2.0, all within one province.
By count, the provincial divisions dominate. Camarines Sur is short 2,384 classrooms, 32.2% of the region’s, and Masbate (1,304) and Albay (1,090) follow; together these three hold most of Bicol’s shortage.
| Division | Schools | Learners (SY 2024-25) | Classroom shortage (2023) | Shortage per 1,000 learners | Schools with a shortage | SBP 2026 classrooms | Coverage |
|---|---|---|---|---|---|---|---|
| Legaspi City | 56 | 41,883 | 277 | 6.6 | 44.6% | 39 | 14.1% |
| Masbate | 699 | 214,842 | 1,304 | 6.1 | 57.9% | 189 | 14.5% |
| Naga City | 42 | 48,367 | 285 | 5.9 | 71.4% | 286 | 100.3% |
| Camarines Sur | 1,091 | 430,127 | 2,384 | 5.5 | 58.7% | 320 | 13.4% |
| Sorsogon City | 83 | 45,302 | 245 | 5.4 | 45.8% | 227 | 92.6% |
| Ligao City | 67 | 33,185 | 170 | 5.1 | 49.3% | 41 | 24.2% |
| Albay | 554 | 214,477 | 1,090 | 5.1 | 46.9% | 128 | 11.7% |
| Camarines Norte | 317 | 156,650 | 630 | 4.0 | 57.7% | 187 | 29.7% |
| Masbate City | 44 | 28,554 | 113 | 4.0 | 65.9% | 63 | 55.8% |
| Sorsogon | 531 | 169,565 | 580 | 3.4 | 37.7% | 644 | 111.0% |
| Catanduanes | 268 | 71,789 | 228 | 3.2 | 39.6% | 157 | 68.9% |
| Tabaco City | 50 | 39,158 | 77 | 2.0 | 52.0% | 31 | 40.2% |
| Iriga City | 50 | 24,863 | 32 | 1.3 | 20.0% | 53 | 164.3% |
In Naga City, 71.4% of schools have a shortage; in Iriga City, 20.0% do. Coverage, the division’s SBP 2026 classrooms as a share of its shortage, spans 11.7% in Albay to 164.3% in Iriga City. The four divisions with the most classrooms short, Camarines Sur, Masbate, Albay and Camarines Norte, all have coverage of 29.7% or less, while Sorsogon, Naga City and Iriga City are fully covered on paper. The division totals leave out five SBP classrooms at two schools that have no division in the data; the regional totals include them.
Provinces and cities: Camarines Sur, Albay, Masbate, Sorsogon, Camarines Norte and Catanduanes
The Philippine Standard Geographic Code (PSGC) places all of Bicol’s schools in its six provinces; the region has no highly urbanized city, so each city with its own schools division is counted in its province here: Naga and Iriga in Camarines Sur, Legazpi, Ligao and Tabaco in Albay, Sorsogon City in Sorsogon and Masbate City in Masbate.
| Province or city | Cities and municipalities | Schools | Classroom shortage (2023) | Shortage per 1,000 learners | SBP 2026 classrooms | Coverage |
|---|---|---|---|---|---|---|
| Camarines Sur | 37 | 1,183 | 2,702 | 5.3 | 659 | 24.4% |
| Albay | 18 | 727 | 1,614 | 4.9 | 239 | 14.8% |
| Masbate | 21 | 743 | 1,417 | 5.8 | 253 | 17.9% |
| Sorsogon | 15 | 614 | 825 | 3.8 | 875 | 106.1% |
| Camarines Norte | 12 | 317 | 630 | 4.0 | 187 | 29.7% |
| Catanduanes | 11 | 268 | 228 | 3.2 | 157 | 68.9% |
Camarines Sur, with Naga and Iriga, holds 2,702 classrooms of shortage, 36.4% of the region’s, and its 2026 list covers 24.4% of it. Albay, the second largest at 1,614, has the lowest coverage of the six provinces, 14.8%, and Masbate, with the highest provincial rate (5.8), has 17.9%. Sorsogon is the only province whose list is longer than its shortage: 875 classrooms for 825.
Among the region’s 114 cities and municipalities, the City of Naga has the largest shortage, 285 classrooms, and its 286 classrooms on the list match it almost exactly. Below it, the 10 largest split into two groups:
| City or municipality | Province or city | Income class | Schools | Classroom shortage (2023) | SBP 2026 classrooms | Coverage |
|---|---|---|---|---|---|---|
| City of Naga | Camarines Sur | 1st | 43 | 285 | 286 | 100.3% |
| City of Legazpi | Albay | 1st | 58 | 277 | 39 | 14.1% |
| City of Sorsogon | Sorsogon | 2nd | 83 | 245 | 227 | 92.6% |
| Daraga | Albay | 1st | 56 | 223 | 17 | 7.6% |
| Pili | Camarines Sur | 1st | 47 | 208 | 47 | 22.6% |
| Aroroy | Masbate | 1st | 63 | 187 | 7 | 3.7% |
| Calabanga | Camarines Sur | 1st | 46 | 178 | 10 | 5.6% |
| City of Ligao | Albay | 3rd | 67 | 170 | 41 | 24.2% |
| Guinobatan | Albay | 1st | 41 | 168 | 2 | 1.2% |
| Goa | Camarines Sur | 1st | 38 | 159 | 20 | 12.6% |
The City of Naga and the City of Sorsogon have lists close to or above their shortage. Most of the others have little: Guinobatan in Albay is short 168 and has two classrooms on the list (1.2%), Aroroy in Masbate 187 and seven, Calabanga 178 and 10, and Daraga 223 and 17. Four of the 10 are in Albay. No city or municipality with a shortage is left off the list entirely, so in Bicol the gaps are within towns and divisions rather than whole towns with nothing, and 14 cities and municipalities receive more classrooms than their shortage, 185 beyond it in all. The city table follows the PSGC, so it names the City of Legazpi where DepEd’s division list says Legaspi City; the two show the same shortage and SBP classrooms.
Schools with the largest classroom shortages in Region V
The 10 schools with the largest shortages are large schools, nearly all of them high schools; all but one are in the provinces of Albay and Camarines Sur, and all but one hold classes in shifts. Together they are short 785 classrooms, 10.6% of the region’s shortage. The school ID identifies each one in the school table.
| School ID | School | Division | City or municipality | Learners (SY 2024-25) | Learners per classroom | Classroom shortage (2023) | SBP 2026 classrooms | Two or more shifts |
|---|---|---|---|---|---|---|---|---|
| 301825 | Daraga National High School | Albay | Daraga | 7,079 | 90.8 | 135 | 0 | No |
| 302001 | Nabua National High School | Camarines Sur | Nabua | 7,419 | 463.7 | 103 | 0 | Yes |
| 301849 | Marcial O. Rañola Memorial School | Albay | Guinobatan | 7,161 | 64.5 | 100 | 0 | Yes |
| 302279 | Sorsogon National High School | Sorsogon City | City of Sorsogon | 9,581 | 56.0 | 94 | 20 | Yes |
| 302264 | Camarines Sur National High School | Naga City | City of Naga | 10,188 | 58.2 | 91 | 64 | Yes |
| 301837 | Ligao National High School | Ligao City | City of Ligao | 7,581 | 60.2 | 72 | 26 | Yes |
| 302258 | Oro Site High School | Legaspi City | City of Legazpi | 2,246 | 83.2 | 51 | 0 | Yes |
| 302038 | San Rafael National High School | Camarines Sur | Tigaon | 3,874 | 62.5 | 47 | 0 | Yes |
| 302261 | Legazpi City National High School | Legaspi City | City of Legazpi | 3,713 | 56.3 | 46 | 0 | Yes |
| 301952 | Calabanga National Science High School | Camarines Sur | Calabanga | 3,548 | 55.4 | 46 | 0 | Yes |
Daraga National High School has the largest shortage in the region, 135 classrooms, for 7,079 learners, and it is the only school in the table without shifts. Nabua National High School’s 463.7 learners per classroom is far above any other school here; a figure that high suggests few instructional classrooms on record, and the school’s 2023 count is worth checking. Three schools are short 46 classrooms: Legazpi City National High School and Calabanga National Science High School are in the table, and Cabangan High School in Legazpi, with fewer learners, falls just outside it, since ties are broken by enrollment.
Only three of the 10 are on the SBP 2026 list, Camarines Sur National High School in Naga with 64 classrooms, Ligao National High School with 26 and Sorsogon National High School with 20, all in city divisions. The seven with nothing on the list are in the Albay, Legaspi City and Camarines Sur divisions.
Beyond the top 10, the 385 schools with the largest shortages, the top 10% of the region’s schools, hold 59.2% of it, against 66.0% nationally; 256 schools (6.6%) hold half, and the 115 schools short by 10 or more classrooms hold 36.3%. Among schools with a shortage, the median is 2.0 classrooms, against 3.0 nationally. Philippine Classroom Shortage 2023: Where the Gap Is sets out how these shares are measured.
SBP 2026 classrooms in Region V
The SBP 2026 list has 589 lines for Region V, 2,370 classrooms at 524 schools. Of these, 878 are funded under the General Appropriations Act (GAA) 2026 with PHP 2.89 billion. The other 1,492 belong to PSIP III, the third Public-Private Partnership for School Infrastructure Project, still for bidding, with construction expected from March 2027 to July 2028.
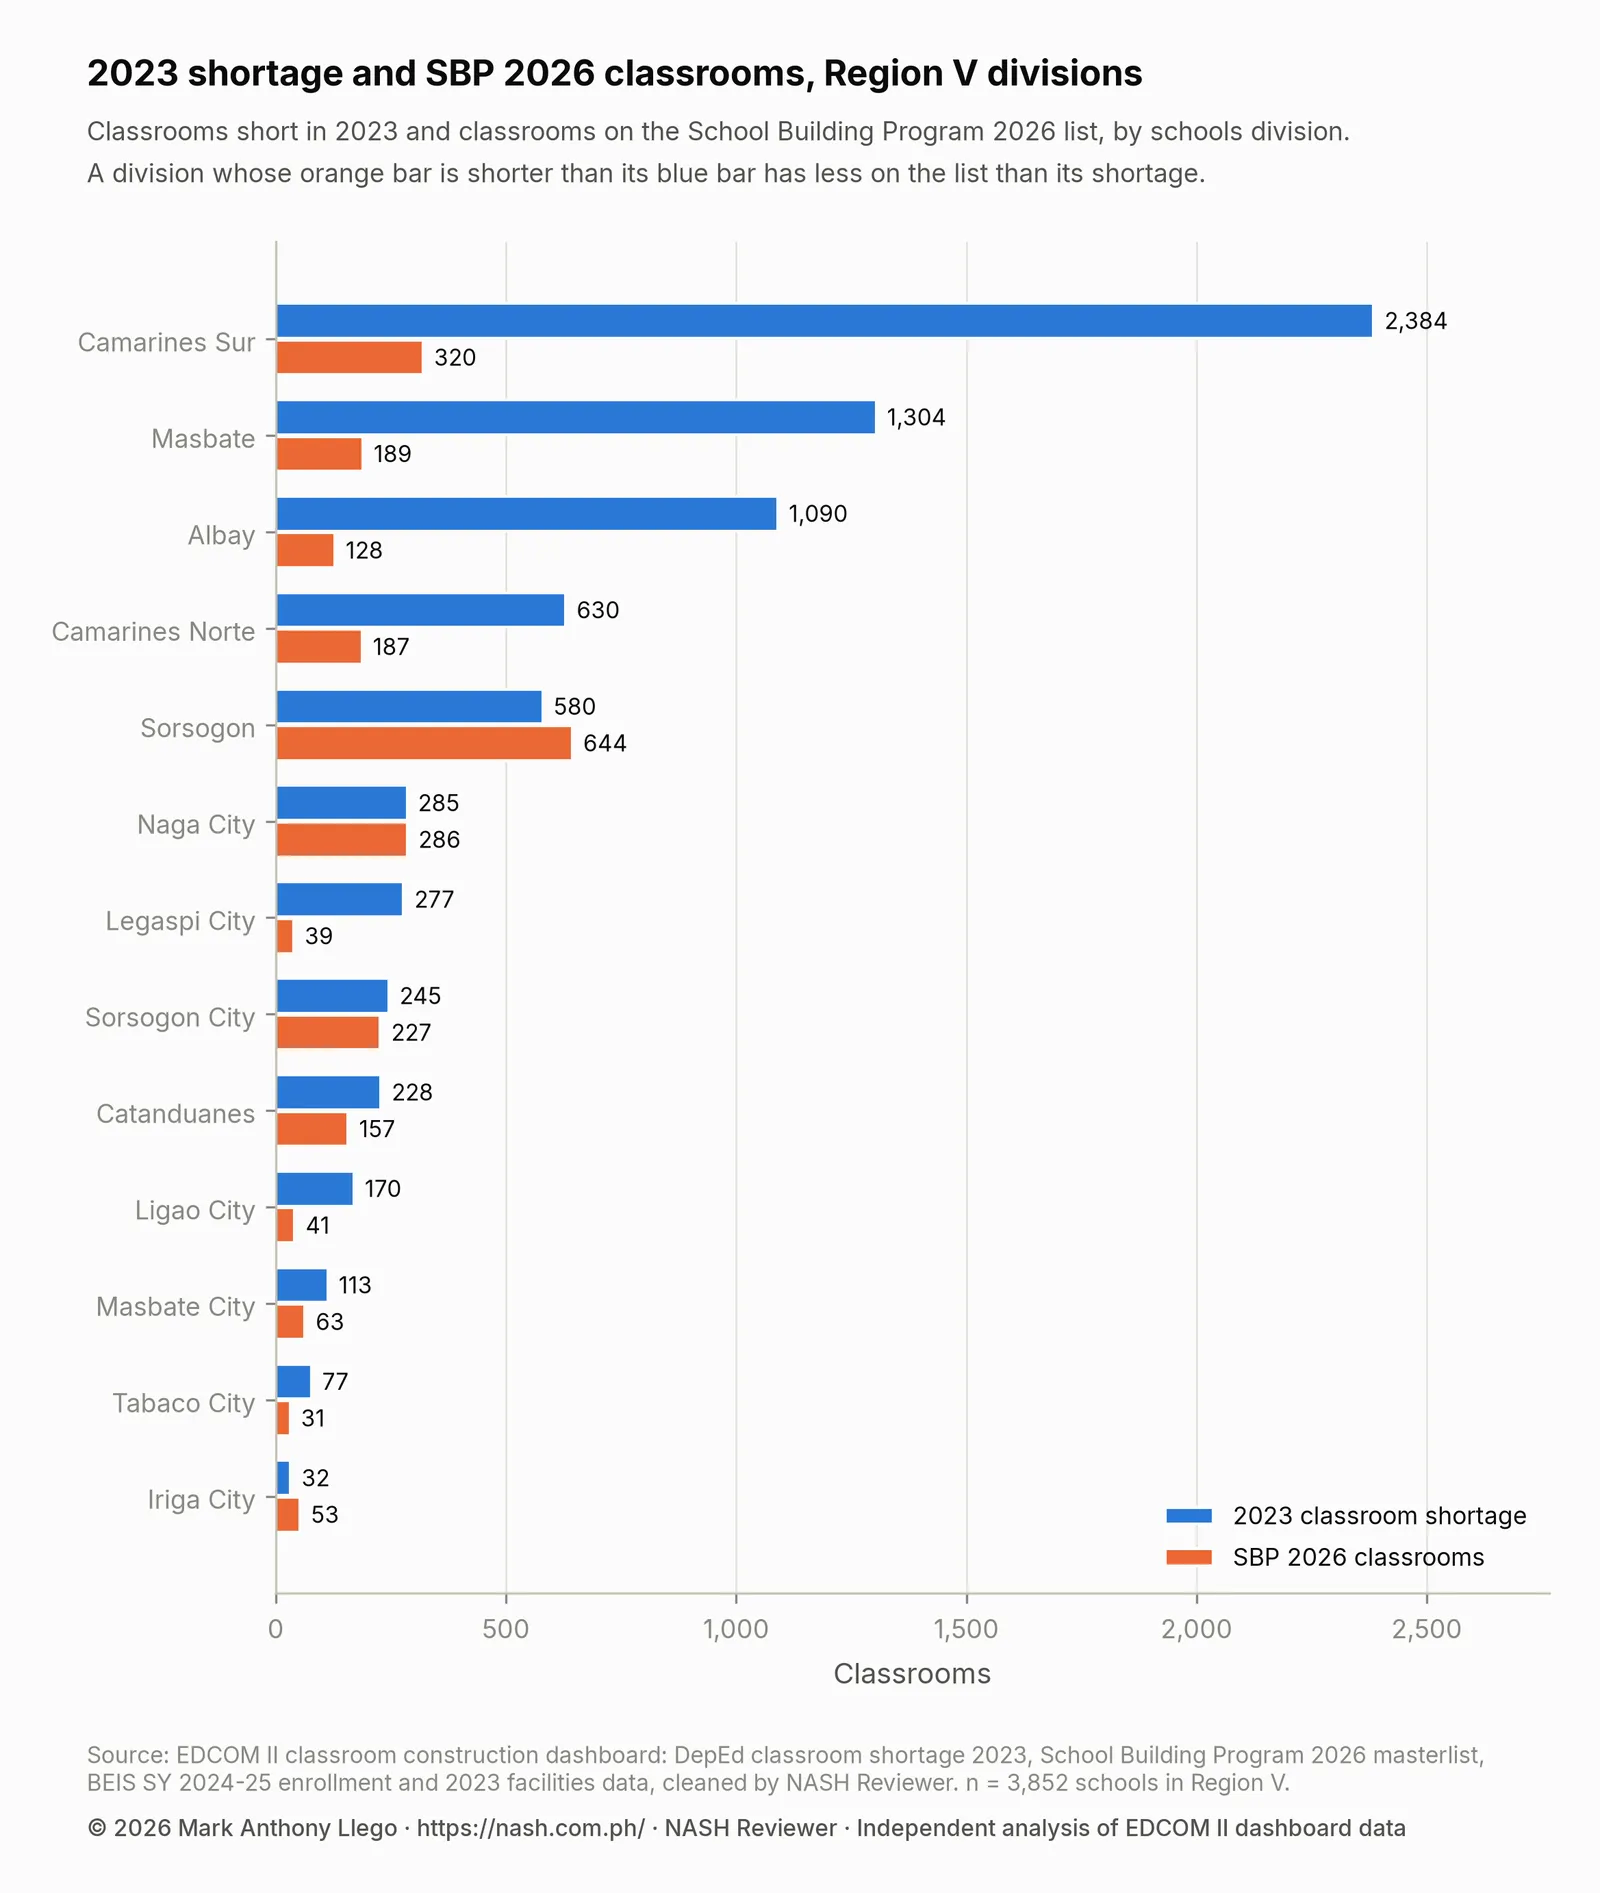
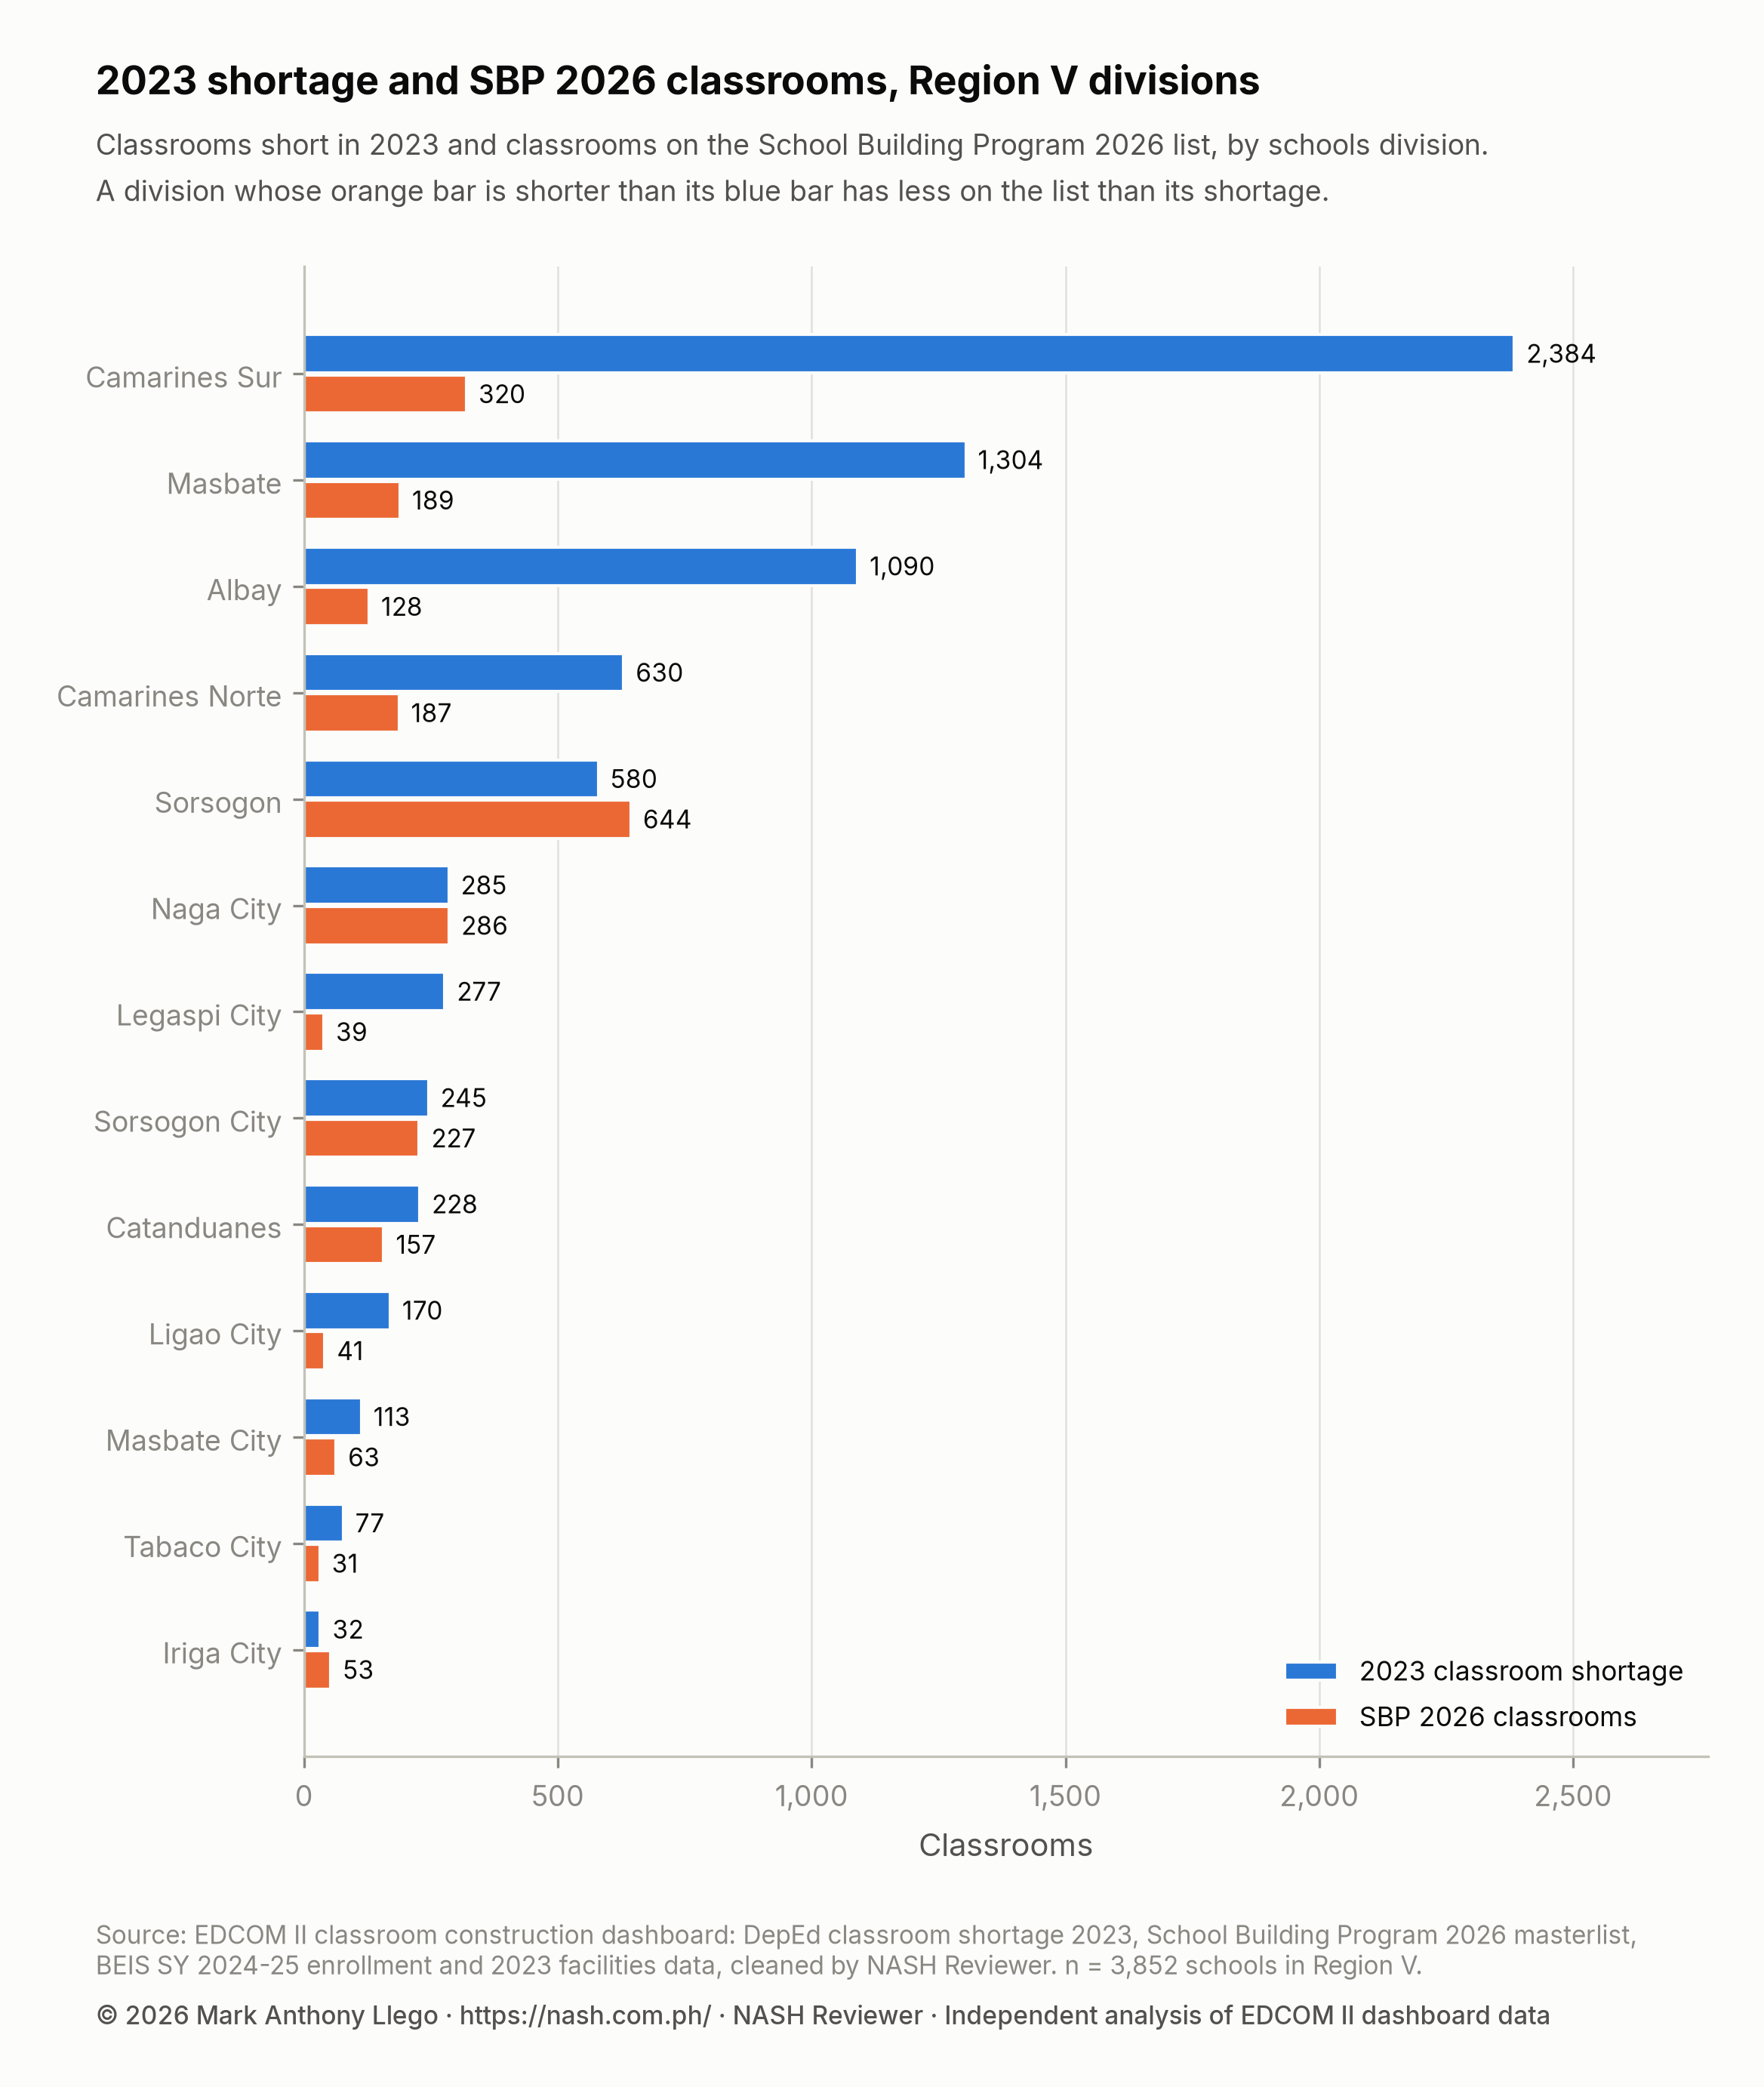
The chart shows two kinds of division. In the three largest, Camarines Sur, Masbate and Albay, the orange bar is a small fraction of the blue one. In Sorsogon, Naga City and Iriga City it is as long or longer, and in Sorsogon City it comes close. Legaspi City and Ligao City, with 39 and 41 classrooms for shortages of 277 and 170, sit with the first group.
| Modality group | Lines | Schools | Classrooms | Share of the region’s SBP classrooms |
|---|---|---|---|---|
| DPWH | 69 | 69 | 214 | 9.0% |
| LGU | 164 | 164 | 493 | 20.8% |
| DepEd | 164 | 164 | 171 | 7.2% |
| PSIP III (PPP) | 192 | 169 | 1,492 | 63.0% |
PSIP III holds 63.0% of the region’s 2026 classrooms, on 192 lines at 169 schools, more than its 50.3% share of the national list. Of the funded classrooms, local governments implement 493 (20.8% of the region’s list), the Department of Public Works and Highways (DPWH) 214 and DepEd 171. DepEd’s share, 7.2%, is larger than its 4.0% of the national list, spread over 164 small lines. DepEd School Building Program 2026 in Numbers explains the modalities and their budgets.
Measured school by school, 1,281 of the region’s 2026 classrooms (54.1%) fall within the receiving school’s own 2023 shortage, close to the national 53.0%, and 578 (24.4%) go to 174 schools with no 2023 shortage. 342 of the 1,985 schools with a shortage, 17.2%, receive any classroom, as do 45 of the 104 schools short by more than 10 (43.3%). Counted this way, the 2026 list meets 17.3% of the region’s shortage and leaves 6,134 classrooms unmet. Do 2026 Classrooms Go Where the Shortage Is? explains why a classroom beyond a school’s own shortage meets no other school’s need.
Class shifts and crowded classrooms in Region V
In SY 2024-25, 72 of the region’s 3,874 schools in the enrollment data (1.9%) held classes in two or more shifts, none in three, against 4.3% nationally. They are large schools: they enroll 174,398 learners, 11.5% of the region’s total, and nine of them are among the 10 schools with the largest shortages. Of the 72, 83.3% had a shortage, and 31 (43.1%) receive SBP 2026 classrooms.
The median school has 24.5 learners per classroom in elementary, 31.9 in junior high and 28.5 in senior high, close to or below the national 24.9, 32.1 and 30.6. 191 schools have more than 50 learners per classroom, with 12.2% of the learners counted, and bringing each down to 50 would take at least 966 classrooms. Class Shifts and Crowded Classrooms in DepEd Schools explains the measure.
The condition of existing rooms is the region’s weaker side. In the 2023 facilities data, 1,197 schools (31.1%) report a building for condemnation or demolition, 2,115 buildings in all, against 28.9% nationally, and 1,274 schools (33.1%) use makeshift rooms, against 29.0%. These two rows describe the rooms a school already has, which the shortage figure alone does not show.
Last Mile Schools in Region V
625 of the region’s schools (16.2%) are flagged as Last Mile Schools, schools in geographically isolated, disadvantaged and conflict-affected areas and hardship posts, fewer than the national 18.5%. They hold 917 classrooms of shortage, 12.4% of the region’s, and more of them have a shortage than other schools, 60.8% against 49.7%.
They are a little less likely to be on the 2026 list: 10.9% receive any classroom, against 13.9% of the region’s other schools, with 144 classrooms between them. 336 Last Mile Schools with a shortage, 784 classrooms in all, receive none. DepEd’s own Last Mile School modality has seven lines with 14 classrooms in the region. Last Mile Schools: Classroom Need and 2026 Allocation compares them nationally.
What this means for school heads in Region V
Bicol’s regional figures look comfortable, a low rate and a long 2026 list, but they average very different divisions. Read your own division’s line before the regional one.
- Look past the regional coverage. The region’s 32.0% combines 111.0% in Sorsogon and 164.3% in Iriga City with 11.7% in Albay and 13.4% in Camarines Sur. A school head in Albay or Camarines Sur should expect the regional figure to overstate what the division will receive.
- Make the case for large schools with nothing on the list. Seven of the 10 schools with the largest shortages, in the Albay, Legaspi City and Camarines Sur divisions, have no 2026 classroom. Cite the shortage, the enrollment and the shifts together: a school short 100 classrooms for 7,161 learners, as Marcial O. Rañola Memorial School is, states its need in two numbers.
- Record condemned buildings in the SIP. With 31.1% of the region’s schools reporting a building for condemnation or demolition, put each such building, and the classes held in it, in the school improvement plan and the annual implementation plan, and raise it with the division.
- Know the timeline of your classrooms. Most of the region’s 2026 classrooms, 1,492, are PSIP III, expected from March 2027 to July 2028; plan for crowded rooms and shifts in the meantime.
- Check the record before you cite it. Figures such as 463.7 learners per classroom are a reason to check a school’s classroom count with the division before the data are used for planning. A new school ID, a merged annex or a missing building can all change a school’s figures.
How these numbers were made
The data are the cleaned tables behind the EDCOM II classroom construction dashboard: DepEd’s 2023 classroom shortage by school, the SBP 2026 masterlist, SY 2024-25 enrollment and class shifts from the Basic Education Information System (BEIS), 2023 school facilities, and school coordinates from the National School Building Inventory (NSBI) for SY 2022-23. How the EDCOM Classroom Data Was Cleaned documents every table and cleaning rule.
A school’s shortage is DepEd’s 2023 figure for Kindergarten to Grade 10 plus senior high school, counted only where the school lacks classrooms. The shortage per 1,000 learners divides the shortage of schools with SY 2024-25 learners by those learners and multiplies by 1,000. Learners per classroom divide SY 2024-25 learners by 2023 instructional classrooms. A division’s coverage is its SBP 2026 classrooms, GAA and PSIP III together, divided by its 2023 shortage. Classrooms within a school’s shortage are counted up to the size of that shortage, and any beyond it are counted as beyond. Regions and provinces follow the PSGC; Region V has no highly urbanized city, so its city divisions fall inside their provinces in the province table. Divisions are DepEd’s schools divisions, with DepEd’s spelling.
The analysis was done in Python with pandas, and the charts drawn with Matplotlib.
Limits
The sources span several years: the shortage and facilities are from 2023, enrollment and shifts from SY 2024-25, and the allocations from 2026, so a school’s figures may have changed since. The SBP list shows planned classrooms, not finished ones, and most of Region V’s are PSIP III classrooms not yet bid out; nationally, 103 PSIP III lines repeat an earlier line exactly, and they are kept here, as in the dashboard. The shortage is DepEd’s own estimate, and new, merged or renumbered schools may be missing or counted under a new ID; a few school records, such as very high learners per classroom, may reflect missing classrooms in the data. Division totals of SBP classrooms leave out the two schools with no division in the data. These are descriptive figures: they show where the shortage and the 2026 classrooms are, not why.
Frequently asked questions
How big is the classroom shortage in the Bicol Region?
DepEd’s 2023 data put Region V’s classroom shortage at 7,415 classrooms, 4.5% of the national shortage of 165,443. That is 4.9 classrooms per 1,000 learners, against 7.4 nationally, and 51.5% of the region’s public schools have a shortage.
Which division in Region V has the biggest classroom shortage?
By count, Camarines Sur, the provincial division, with 2,384 classrooms, 32.2% of the region’s shortage. By rate, Legaspi City, short 6.6 classrooms per 1,000 learners, followed by Masbate at 6.1. No Bicol division is above the national rate of 7.4.
How many classrooms will Region V get under the SBP 2026?
The SBP 2026 masterlist has 2,370 classrooms for Region V on 589 lines at 524 schools, equal to 32.0% of the region’s 2023 shortage, against 19.6% nationally. Of these, 878 are funded under the GAA 2026 with PHP 2.89 billion, and 1,492 are PSIP III classrooms still for bidding. The list is a plan; it does not mean the classrooms are built.
Which Bicol divisions get more SBP 2026 classrooms than their shortage?
Three: Iriga City, with 53 classrooms for a shortage of 32 (164.3%), Sorsogon, with 644 for 580 (111.0%), and Naga City, with 286 for 285 (100.3%). Coverage compares totals, so even in these divisions some schools with a shortage may receive nothing; the Albay division, at 11.7%, has the lowest coverage in the region.
Download the data and cite this post
The cleaned EDCOM II classroom data behind this series are free to download for personal study; to reuse them, email support@nash.com.ph for written permission first. How the EDCOM Classroom Data Was Cleaned explains every table and cleaning rule. The files are at data.nash.com.ph: start with the README, then the school table (Parquet, or CSV), the School Building Program lines (CSV), the city and municipality table (CSV), and every table for Stata and SPSS. Every regional figure in this report can be computed from the school table, filtered to Region V by deped_region.
Every file, with its rows, columns and checksum, is listed on the EDCOM II classroom data page. To cite the data: Llego, M. A. (2026). EDCOM II classroom construction dashboard data, cleaned, version 1.1. NASH Reviewer. https://nash.com.ph/edcom-classroom-data
To cite this post: Llego, M. A. (2026, October 28). Classroom shortage in Region V, 2023–2026: Albay and Legazpi. NASH Reviewer Blog. https://nash.com.ph/blog/classroom-shortage-region-5-bicol
References
- Llego, M. A. (2026). EDCOM II classroom construction dashboard data, cleaned, version 1.1 [Data set]. NASH Reviewer. https://nash.com.ph/edcom-classroom-data
More in this series
- How the EDCOM Classroom Data Was Cleaned
- Philippine Classroom Shortage 2023: Where the Gap Is
- DepEd School Building Program 2026 in Numbers
- Do 2026 Classrooms Go Where the Shortage Is?
- Classroom Allocation by LGU Income Class, 2026
- Class Shifts and Crowded Classrooms in DepEd Schools
- Last Mile Schools: Classroom Need and 2026 Allocation
- Regional reports: NCR, CAR, Region I, Region II, Region III, Region IV-A, MIMAROPA, Region V, Region VI, NIR, Region VII, Region VIII, Region IX, Region X, Region XI, Region XII, Caraga, BARMM
- Rankings and deep dives: Congressional districts, Top 20 cities and municipalities, Rizal, Quezon City, City of Manila, Tawi-Tawi, Cavite, Cost of a classroom
- Explainers: PSIP III, Senior high shortage, Junior high shortage, Excess classrooms, Learning Continuity Spaces, How learners reach school
- For teachers and school heads: Action research and thesis topics
- Related: CRLA Results SY 2025-26 in Region V: A Gap in Every Grade, DepEd Classroom and School Building Data, SY 2023-2024, DepEd School Improvement Plan (SIP): Steps, AIP and SRC
Analysis and charts by Mark Anthony Llego for NASH Reviewer. Data: EDCOM II classroom construction dashboard and Department of Education data. NASH Reviewer is not affiliated with EDCOM II or DepEd. Charts may be reused only with written permission from support@nash.com.ph.