Region I (the Ilocos Region, often searched as Region 1) lacked 3,061 classrooms in 2023, according to DepEd’s classroom shortage data as published in the EDCOM II classroom construction dashboard. That is 1.9% of the country’s shortage of 165,443 classrooms, the third smallest of the 18 regions. Measured against learners, the region is short 2.9 classrooms for every 1,000 learners enrolled in SY 2024-25, the lowest rate of any region and well under half the national 7.4.
Region I is also the only region where the School Building Program (SBP) 2026 lists more classrooms than the 2023 shortage: 3,097 against 3,061, a coverage of 101.2%, against 19.6% nationally. It holds 9.6% of the national list for 1.9% of the national shortage. Coverage, though, compares totals, not schools. School by school, only 34.9% of the region’s 2026 classrooms fall within the receiving school’s own shortage, 32.2% go to schools with no 2023 shortage, and only 239 of the 867 schools with a shortage receive any classroom. Counted that way, the list meets 35.3% of the shortage and leaves 1,981 classrooms unmet, most of them in Pangasinan, which holds 69.4% of the region’s shortage.
The figures below come from the cleaned school-level data behind the dashboard. Every file is listed on the EDCOM II classroom data page.
Key findings
- Region I lacked 3,061 classrooms in 2023, 2.9 for every 1,000 learners, the lowest rate of any region, and only 30.3% of its schools had a shortage, against 54.2% nationally.
- The SBP 2026 list holds 3,097 classrooms for the region, 101.2% of its shortage, the only region where the list is larger than the shortage.
- Even so, only 239 of the region’s 867 schools with a shortage (27.6%) get any SBP 2026 classroom, and 998 classrooms (32.2%) go to schools with no 2023 shortage.
- Pangasinan holds 69.4% of the region’s shortage, 2,125 classrooms, and the Pangasinan I, Lingayen division alone 42.0%.
- Ilocos Norte province is short 64 classrooms and receives 425, more than La Union, which is short 516.
- PSIP III accounts for 64.4% of the region’s 2026 classrooms, against 50.3% nationally.
- 960 schools (33.6%) report a building for condemnation or demolition, above the national 28.9%, with 2,161 buildings in all.
Region I against the country
The Ilocos Region’s main indicators appear here beside the country’s, computed the same way for both.
| Indicator | Region I | Philippines |
|---|---|---|
| Schools in the 2023 shortage data | 2,860 | 47,659 |
| Schools with a classroom shortage | 30.3% | 54.2% |
| Classroom shortage (2023) | 3,061 | 165,443 |
| Shortage per 1,000 learners | 2.9 | 7.4 |
| SBP 2026 classrooms | 3,097 | 32,419 |
| SBP 2026 classrooms as a share of the shortage | 101.2% | 19.6% |
| Schools with a shortage that get any SBP 2026 classroom | 27.6% | 13.3% |
| Schools with two or more shifts (SY 2024-25) | 0.6% | 4.3% |
| Median learners per classroom, elementary | 20.5 | 24.9 |
| Last Mile Schools | 12.4% | 18.5% |
| Schools using makeshift rooms (2023) | 12.2% | 29.0% |
| Schools with a building for condemnation or demolition | 33.6% | 28.9% |
On almost every row, Region I is better placed than the country: fewer schools with a shortage, a lower rate, fewer shifts, less crowding and fewer makeshift rooms. It differs most on the 2026 list, at 101.2% of the shortage against 19.6%, and its schools with a shortage are about twice as likely as the country’s to receive a classroom, 27.6% against 13.3%. The one row where it fares worse is buildings for condemnation or demolition, reported by 33.6% of its schools against 28.9% nationally.
Kindergarten to Grade 10 accounts for 2,340 classrooms of the shortage, and senior high school for 721, 23.6% of it, a much larger part than in the country, where Kindergarten to Grade 10 holds 89.3% of the shortage. Rural schools hold 61.7% of the shortage and urban schools 38.3%; the 440 urban schools are short 3.2 classrooms per 1,000 learners and the 2,420 rural schools 2.7. The region also has many spare rooms: 1,679 schools report more Kindergarten to Grade 10 classrooms than they need, 5,308 in all, more than its whole shortage. One school’s extra rooms do not reduce another school’s shortage, but the figure shows how unevenly rooms are spread.
Classroom shortage by division in Region I
Region I has 14 schools divisions: five provincial divisions, with Pangasinan split into Pangasinan I, Lingayen and Pangasinan II, Binalonan, and nine city divisions, from Laoag and Batac in the north to Urdaneta and San Carlos in the south. Figure 1 ranks them by classrooms short per 1,000 learners, so divisions of very different sizes can be read side by side.
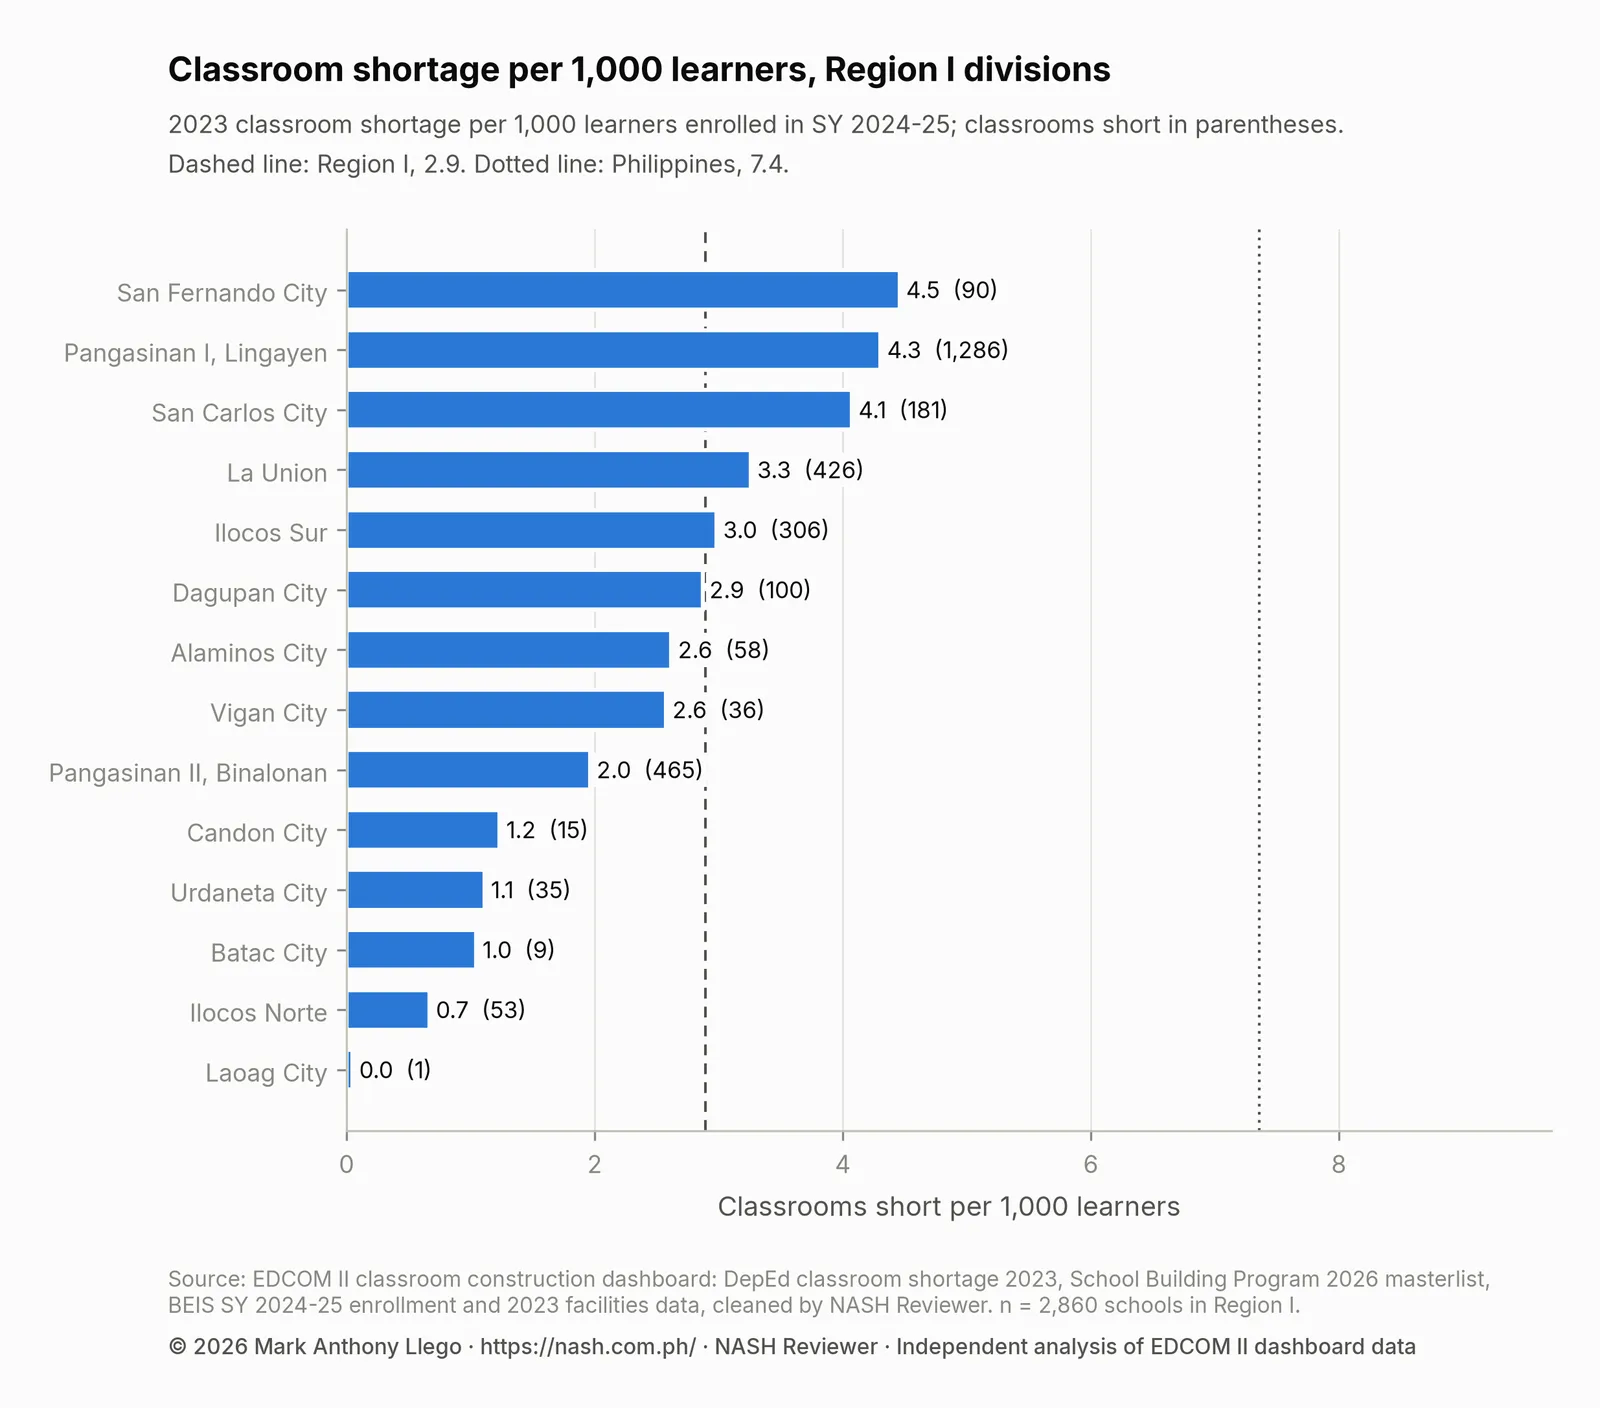
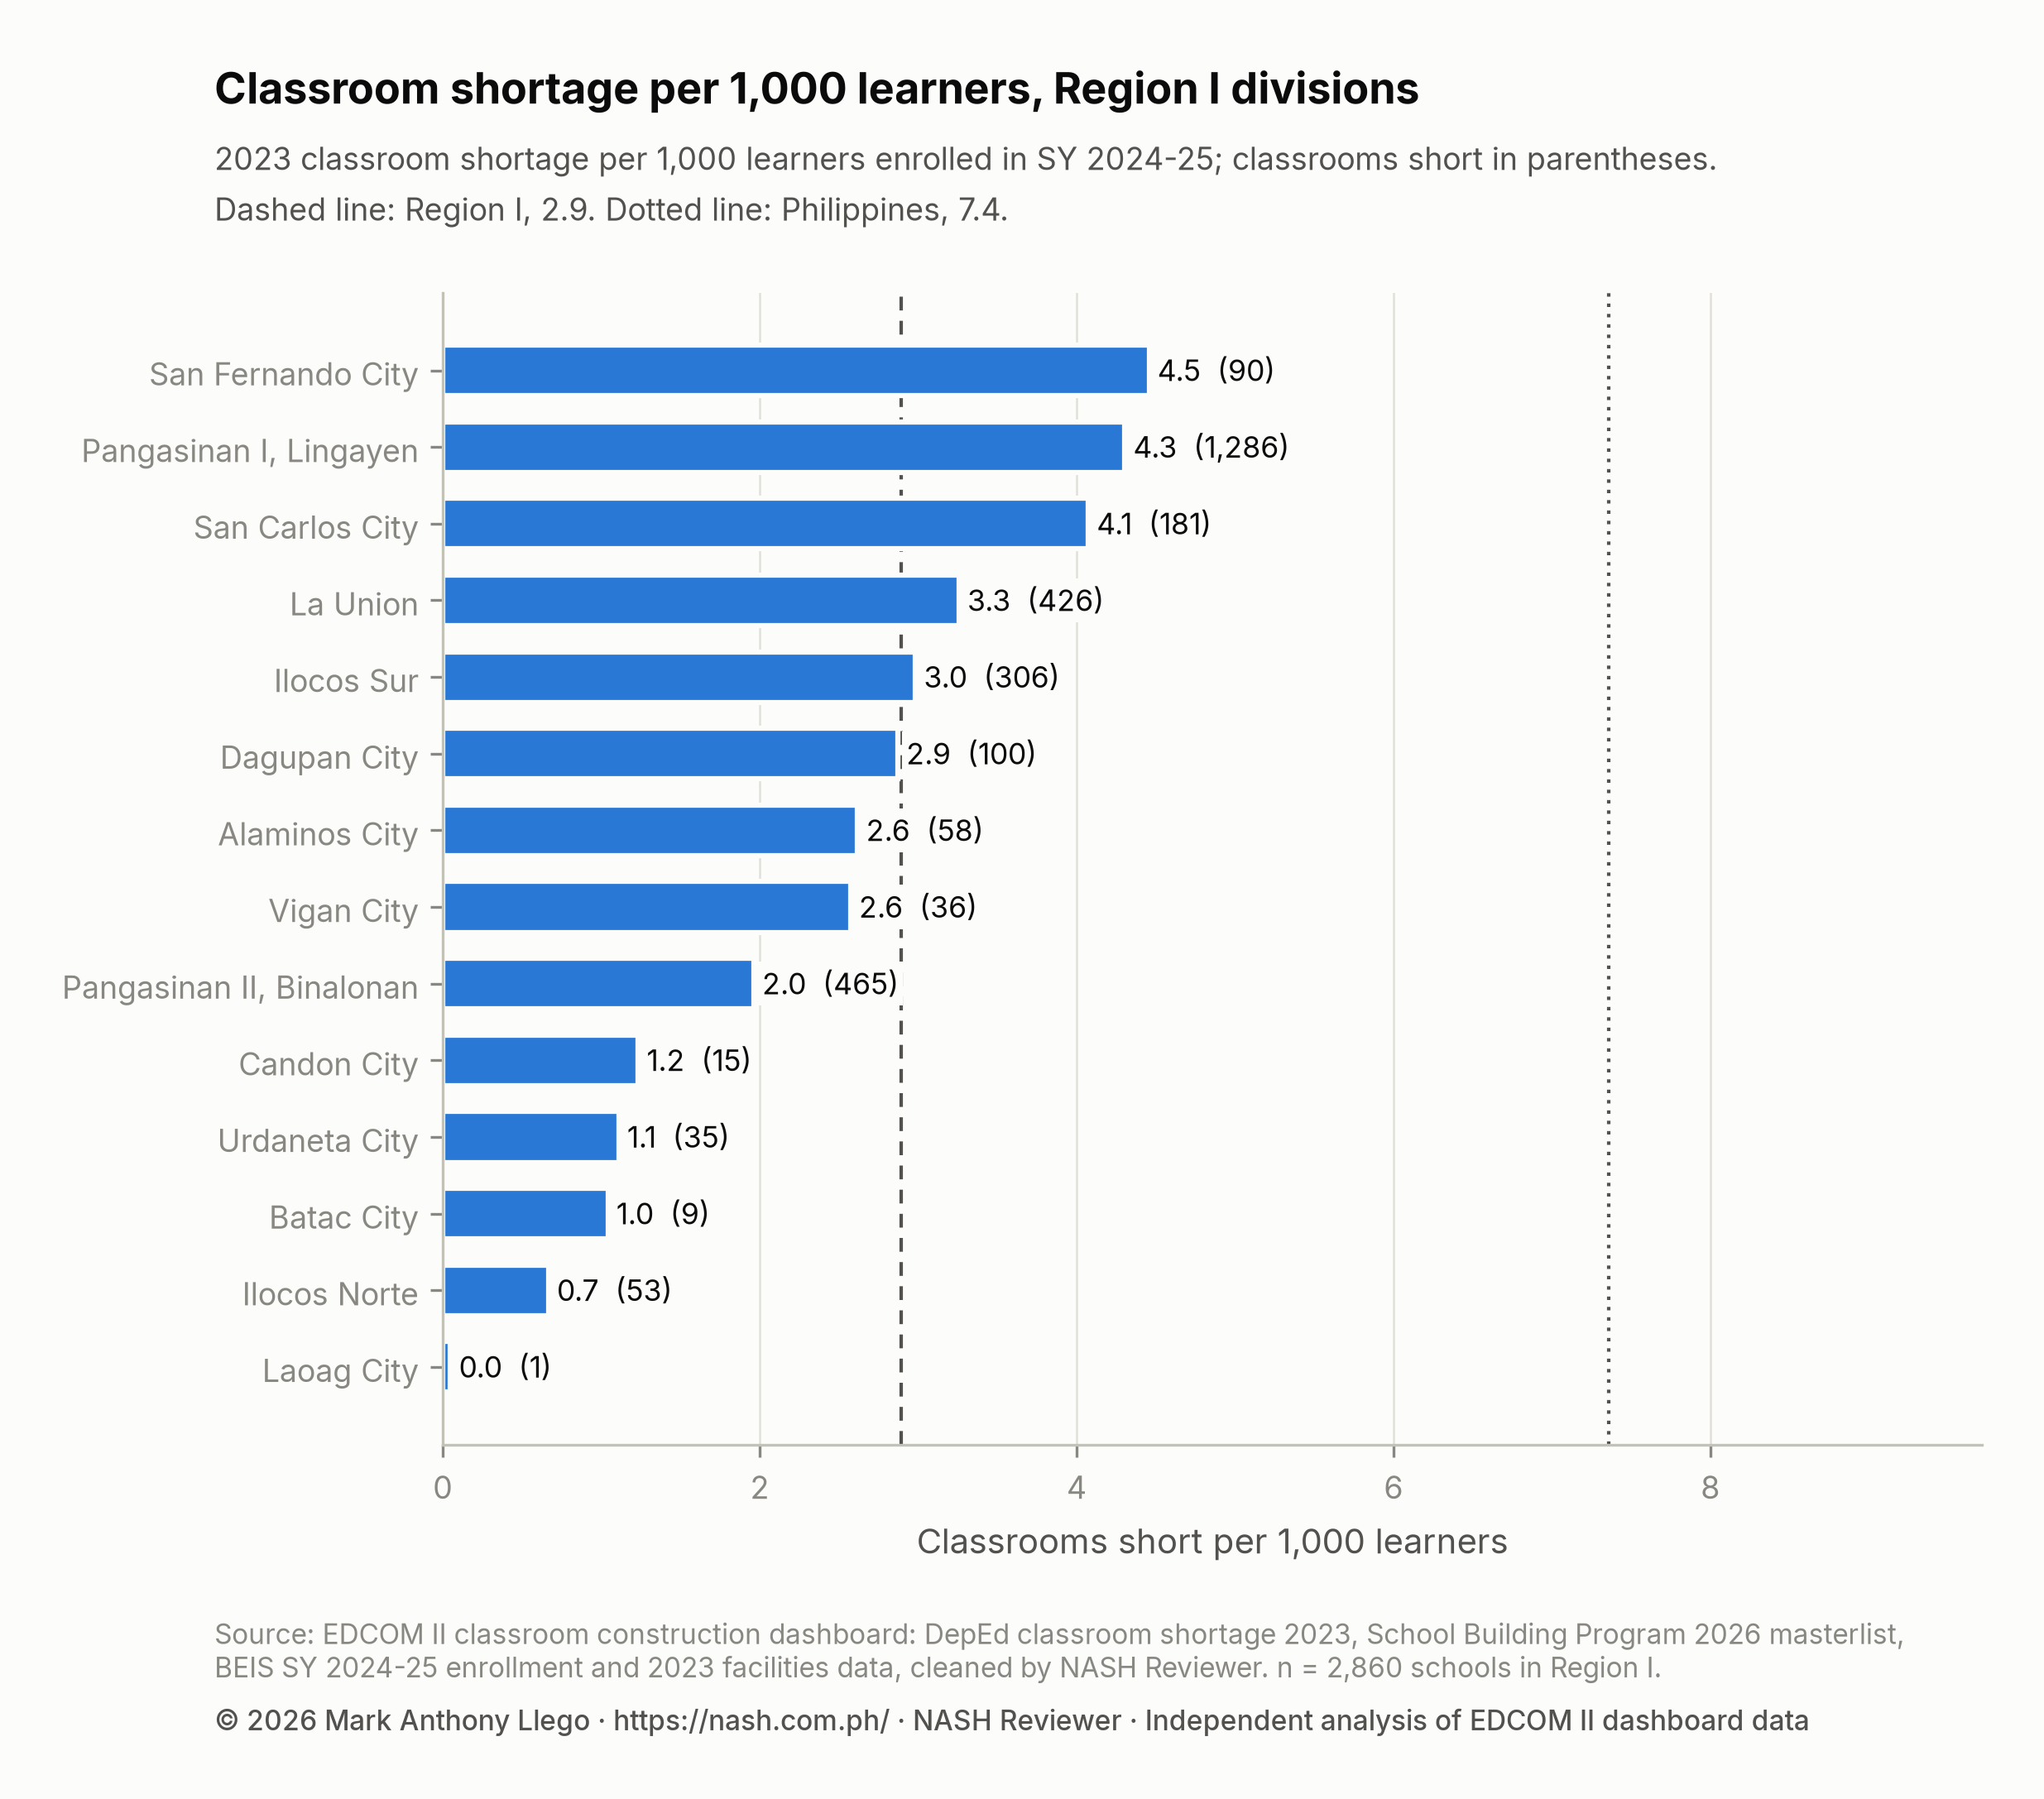
No division reaches the national rate. The highest, San Fernando City in La Union, is short 4.5 classrooms per 1,000 learners, and Pangasinan I, Lingayen, at 4.3, combines a high rate with by far the largest count. At the other end, the north is almost free of shortage: Ilocos Norte is at 0.7, Batac City at 1.0 and Laoag City is short a single classroom.
Pangasinan’s two divisions differ sharply. Pangasinan I, Lingayen is short 1,286 classrooms, 42.0% of the region’s shortage, at 4.3 per 1,000 learners; Pangasinan II, Binalonan, with somewhat fewer learners, is short 465 at 2.0.
| Division | Schools | Learners (SY 2024-25) | Classroom shortage (2023) | Shortage per 1,000 learners | Schools with a shortage | SBP 2026 classrooms | Coverage |
|---|---|---|---|---|---|---|---|
| San Fernando City | 33 | 20,193 | 90 | 4.5 | 39.4% | 144 | 160.0% |
| Pangasinan I, Lingayen | 661 | 298,829 | 1,286 | 4.3 | 43.6% | 754 | 58.6% |
| San Carlos City | 76 | 44,335 | 181 | 4.1 | 53.9% | 220 | 121.8% |
| La Union | 386 | 130,715 | 426 | 3.3 | 32.1% | 258 | 60.6% |
| Ilocos Sur | 505 | 102,538 | 306 | 3.0 | 25.3% | 143 | 46.8% |
| Dagupan City | 39 | 34,978 | 100 | 2.9 | 46.2% | 87 | 86.6% |
| Alaminos City | 46 | 22,121 | 58 | 2.6 | 19.6% | 50 | 86.3% |
| Vigan City | 21 | 13,990 | 36 | 2.6 | 9.5% | 82 | 227.8% |
| Pangasinan II, Binalonan | 559 | 237,041 | 465 | 2.0 | 31.3% | 758 | 163.0% |
| Candon City | 34 | 11,998 | 15 | 1.2 | 8.8% | 32 | 216.3% |
| Urdaneta City | 64 | 31,360 | 35 | 1.1 | 37.5% | 142 | 408.0% |
| Batac City | 33 | 8,825 | 9 | 1.0 | 18.2% | 23 | 250.2% |
| Ilocos Norte | 364 | 80,133 | 53 | 0.7 | 9.6% | 362 | 678.1% |
| Laoag City | 39 | 20,896 | 1 | 0.0 | 2.6% | 40 | 4,000.0% |
The share of schools with a shortage runs from 2.6% in Laoag City to 53.9% in San Carlos City, the only division where more than half of the schools are short. Coverage, the division’s SBP 2026 classrooms as a share of its 2023 shortage, runs from 46.8% in Ilocos Sur to 4,000.0% in Laoag City, which has 40 classrooms on the list for a shortage of one; nine of the 14 divisions have more classrooms on the list than their shortage. The two Pangasinan divisions receive almost the same number, 754 and 758, although Pangasinan I, Lingayen’s shortage is nearly three times Pangasinan II, Binalonan’s. The division totals leave out two SBP classrooms at two new schools that have no division in the data; the regional totals include them.
Provinces and cities: Pangasinan, La Union, Ilocos Sur and Ilocos Norte
The Philippine Standard Geographic Code (PSGC) places all of Region I’s schools in its four provinces. The city divisions, from Dagupan and San Carlos in Pangasinan to Vigan and Candon in Ilocos Sur, are counted inside their provinces here.
| Province or city | Cities and municipalities | Schools | Classroom shortage (2023) | Shortage per 1,000 learners | SBP 2026 classrooms | Coverage |
|---|---|---|---|---|---|---|
| Pangasinan | 48 | 1,445 | 2,125 | 3.2 | 2,012 | 94.7% |
| La Union | 20 | 419 | 516 | 3.4 | 403 | 78.1% |
| Ilocos Sur | 34 | 560 | 357 | 2.8 | 257 | 72.1% |
| Ilocos Norte | 23 | 436 | 64 | 0.6 | 425 | 668.5% |
Pangasinan holds 2,125 classrooms of shortage, 69.4% of the region’s, and receives 2,012, 94.7% of it. La Union, with the highest provincial rate, 3.4, and Ilocos Sur both receive less than their shortage. Ilocos Norte stands apart: short 64 classrooms, 0.6 per 1,000 learners, it receives 425, more than La Union’s 403 for a shortage of 516.
Among the region’s 125 cities and municipalities, Malasiqui, Pangasinan, has the largest shortage, 184 classrooms. The 10 largest are all in Pangasinan and La Union:
| City or municipality | Province or city | Income class | Schools | Classroom shortage (2023) | SBP 2026 classrooms | Coverage |
|---|---|---|---|---|---|---|
| Malasiqui | Pangasinan | 1st | 73 | 184 | 117 | 63.5% |
| City of San Carlos | Pangasinan | 2nd | 76 | 181 | 220 | 121.8% |
| Bolinao | Pangasinan | 1st | 47 | 159 | 28 | 17.6% |
| Bayambang | Pangasinan | 1st | 57 | 151 | 62 | 41.0% |
| City of Dagupan | Pangasinan | 2nd | 39 | 100 | 87 | 86.6% |
| Mangatarem | Pangasinan | 1st | 54 | 96 | 42 | 44.0% |
| City of San Fernando | La Union | 2nd | 33 | 90 | 144 | 160.0% |
| Bugallon | Pangasinan | 1st | 31 | 78 | 40 | 51.3% |
| Rosario | La Union | 1st | 20 | 73 | 18 | 24.8% |
| Urbiztondo | Pangasinan | 1st | 26 | 66 | 53 | 80.6% |
Within the 10, coverage runs from 17.6% in Bolinao, short 159 and receiving 28, to 160.0% in the City of San Fernando. Across the region, 64 of the 125 cities and municipalities receive more classrooms than their shortage, 1,072 beyond it in all, while 11 with a shortage, 68 classrooms between them, receive none; the largest of these is Quirino, Ilocos Sur, short 12. EDCOM II found a similar pattern nationally: seven of the 10 municipalities with the highest funds for FY 2026 classroom construction received allocations exceeding their estimated 2023 shortages (EDCOM II, 2026). The city figures follow the PSGC and the SBP masterlist’s own municipality; for the cities in this table they match the division of the same name.
Schools with the largest classroom shortages in Region I
The 10 schools with the largest shortages are big national high schools and integrated schools in Pangasinan and La Union, five of them in Pangasinan I, Lingayen. Together they are short 425 classrooms, 13.9% of the region’s shortage. School IDs are given so each can be found in the school table.
| School ID | School | Division | City or municipality | Learners (SY 2024-25) | Learners per classroom | Classroom shortage (2023) | SBP 2026 classrooms | Two or more shifts |
|---|---|---|---|---|---|---|---|---|
| 500002 | Rosario Integrated School | La Union | Rosario | 5,866 | 77.2 | 60 | 0 | Yes |
| 300222 | MANGATAREM NATIONAL HIGH SCHOOL | Pangasinan I, Lingayen | Mangatarem | 5,019 | 56.4 | 53 | 20 | No |
| 300168 | Bayambang NHS (Bayambang) | Pangasinan I, Lingayen | Bayambang | 8,084 | 44.9 | 44 | 30 | No |
| 300220 | Malasiqui NHS | Pangasinan I, Lingayen | Malasiqui | 4,168 | 61.3 | 44 | 30 | Yes |
| 300155 | Alaminos City National High School | Alaminos City | City of Alaminos | 5,975 | 51.1 | 42 | 16 | Yes |
| 300112 | Don Eulogio De Guzman Memorial NHS | La Union | Bauang | 3,699 | 56.9 | 41 | 0 | Yes |
| 300365 | Umingan National High School | Pangasinan II, Binalonan | Umingan | 4,280 | 48.6 | 39 | 54 | No |
| 500610 | BUGALLON INTEGRATED SCHOOL | Pangasinan I, Lingayen | Bugallon | 3,604 | 52.2 | 38 | 30 | No |
| 300122 | Naguilian National HS | La Union | Naguilian | 2,953 | 50.1 | 33 | 16 | No |
| 300052 | Ilocos Sur National High School | Vigan City | City of Vigan | 7,996 | 46.0 | 31 | 48 | Yes |
Rosario Integrated School in La Union has the largest shortage in the region, 60 classrooms, for 5,866 learners at 77.2 per classroom; it holds classes in shifts and has no SBP 2026 classroom. The list reaches most of these schools: eight of the 10 are on it, and Umingan National High School receives 54 classrooms, more than its shortage of 39, as does Ilocos Sur National High School in Vigan City, with 48 for 31. The two left off are Rosario Integrated School and Don Eulogio De Guzman Memorial NHS in La Union, both on shifts. Ilocos Sur National High School shares 10th place with Urbiztondo Integrated School, also short 31; ties are broken by enrollment.
Across all schools, the shortage is more concentrated than in the country. The 286 schools with the largest shortages, the top 10% of the region’s schools, hold 76.5% of it, against 66.0% nationally, and 90 schools (3.1%) hold half, against 4.7% of schools nationally. 64 schools short by 10 or more classrooms hold 43.2% of the shortage, and among schools with a shortage the median is 2.0 classrooms. For the method behind these shares, see Philippine Classroom Shortage 2023: Where the Gap Is.
SBP 2026 classrooms in Region I
The SBP 2026 list has 501 lines for Region I, 3,097 classrooms at 449 schools. Of these, 1,102 are funded under the General Appropriations Act (GAA) 2026, with PHP 3.48 billion; the other 1,995 are PSIP III classrooms, under the third Public-Private Partnership for School Infrastructure Project, which is still for bidding, with construction expected from March 2027 to July 2028, and have no budget on the list yet. Figure 2 sets each division’s 2023 shortage and 2026 classrooms side by side.
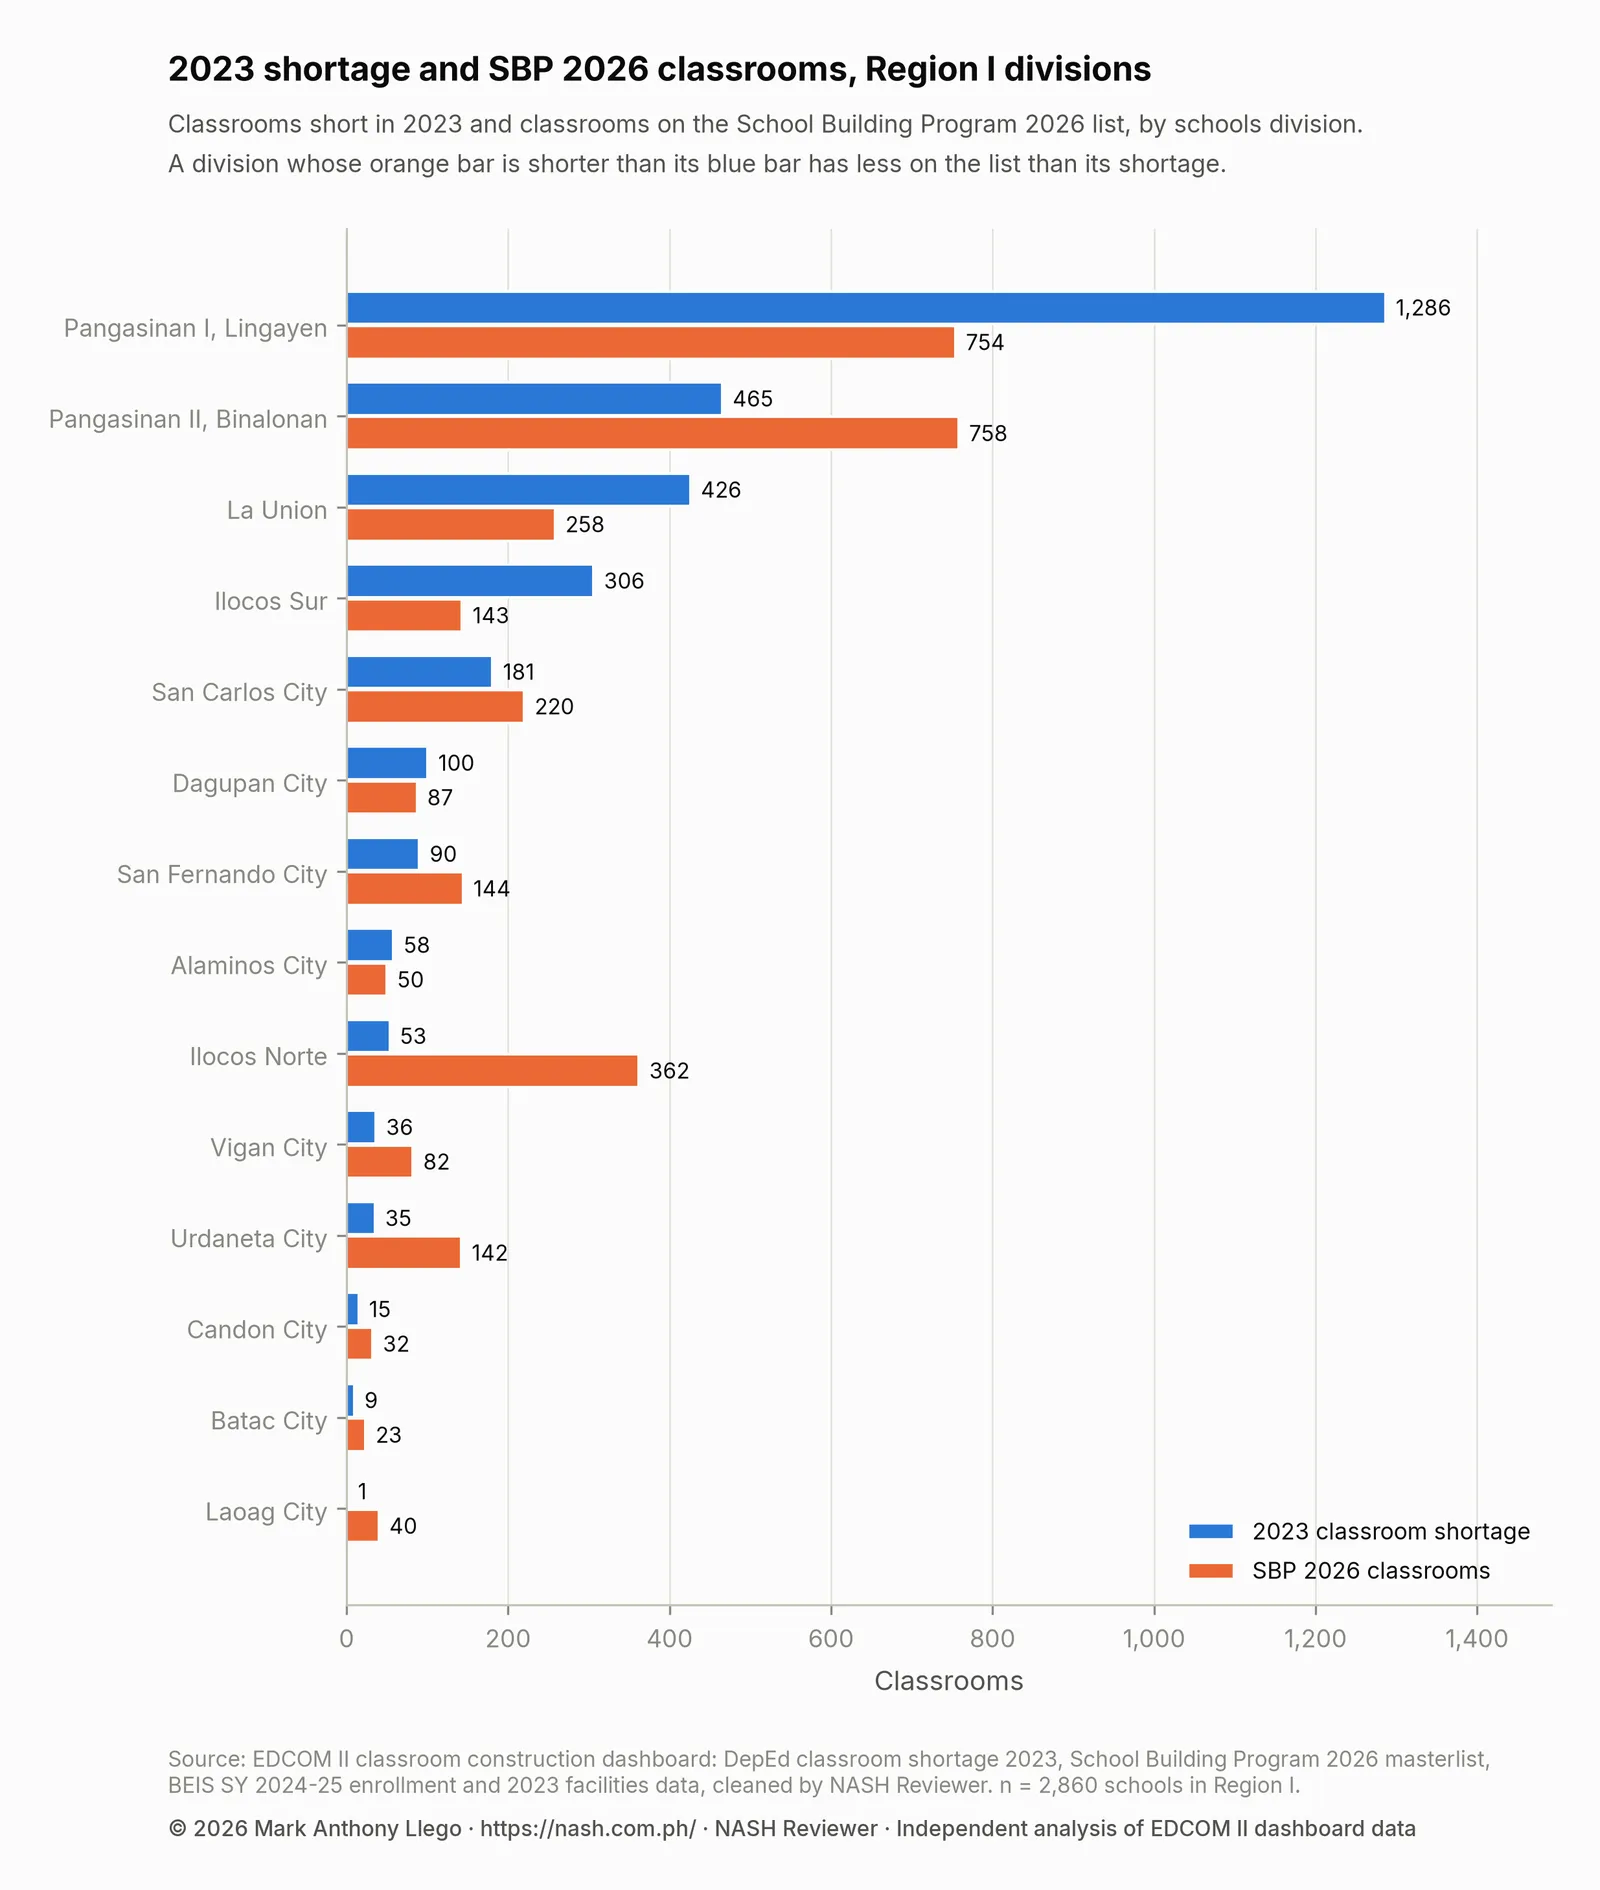
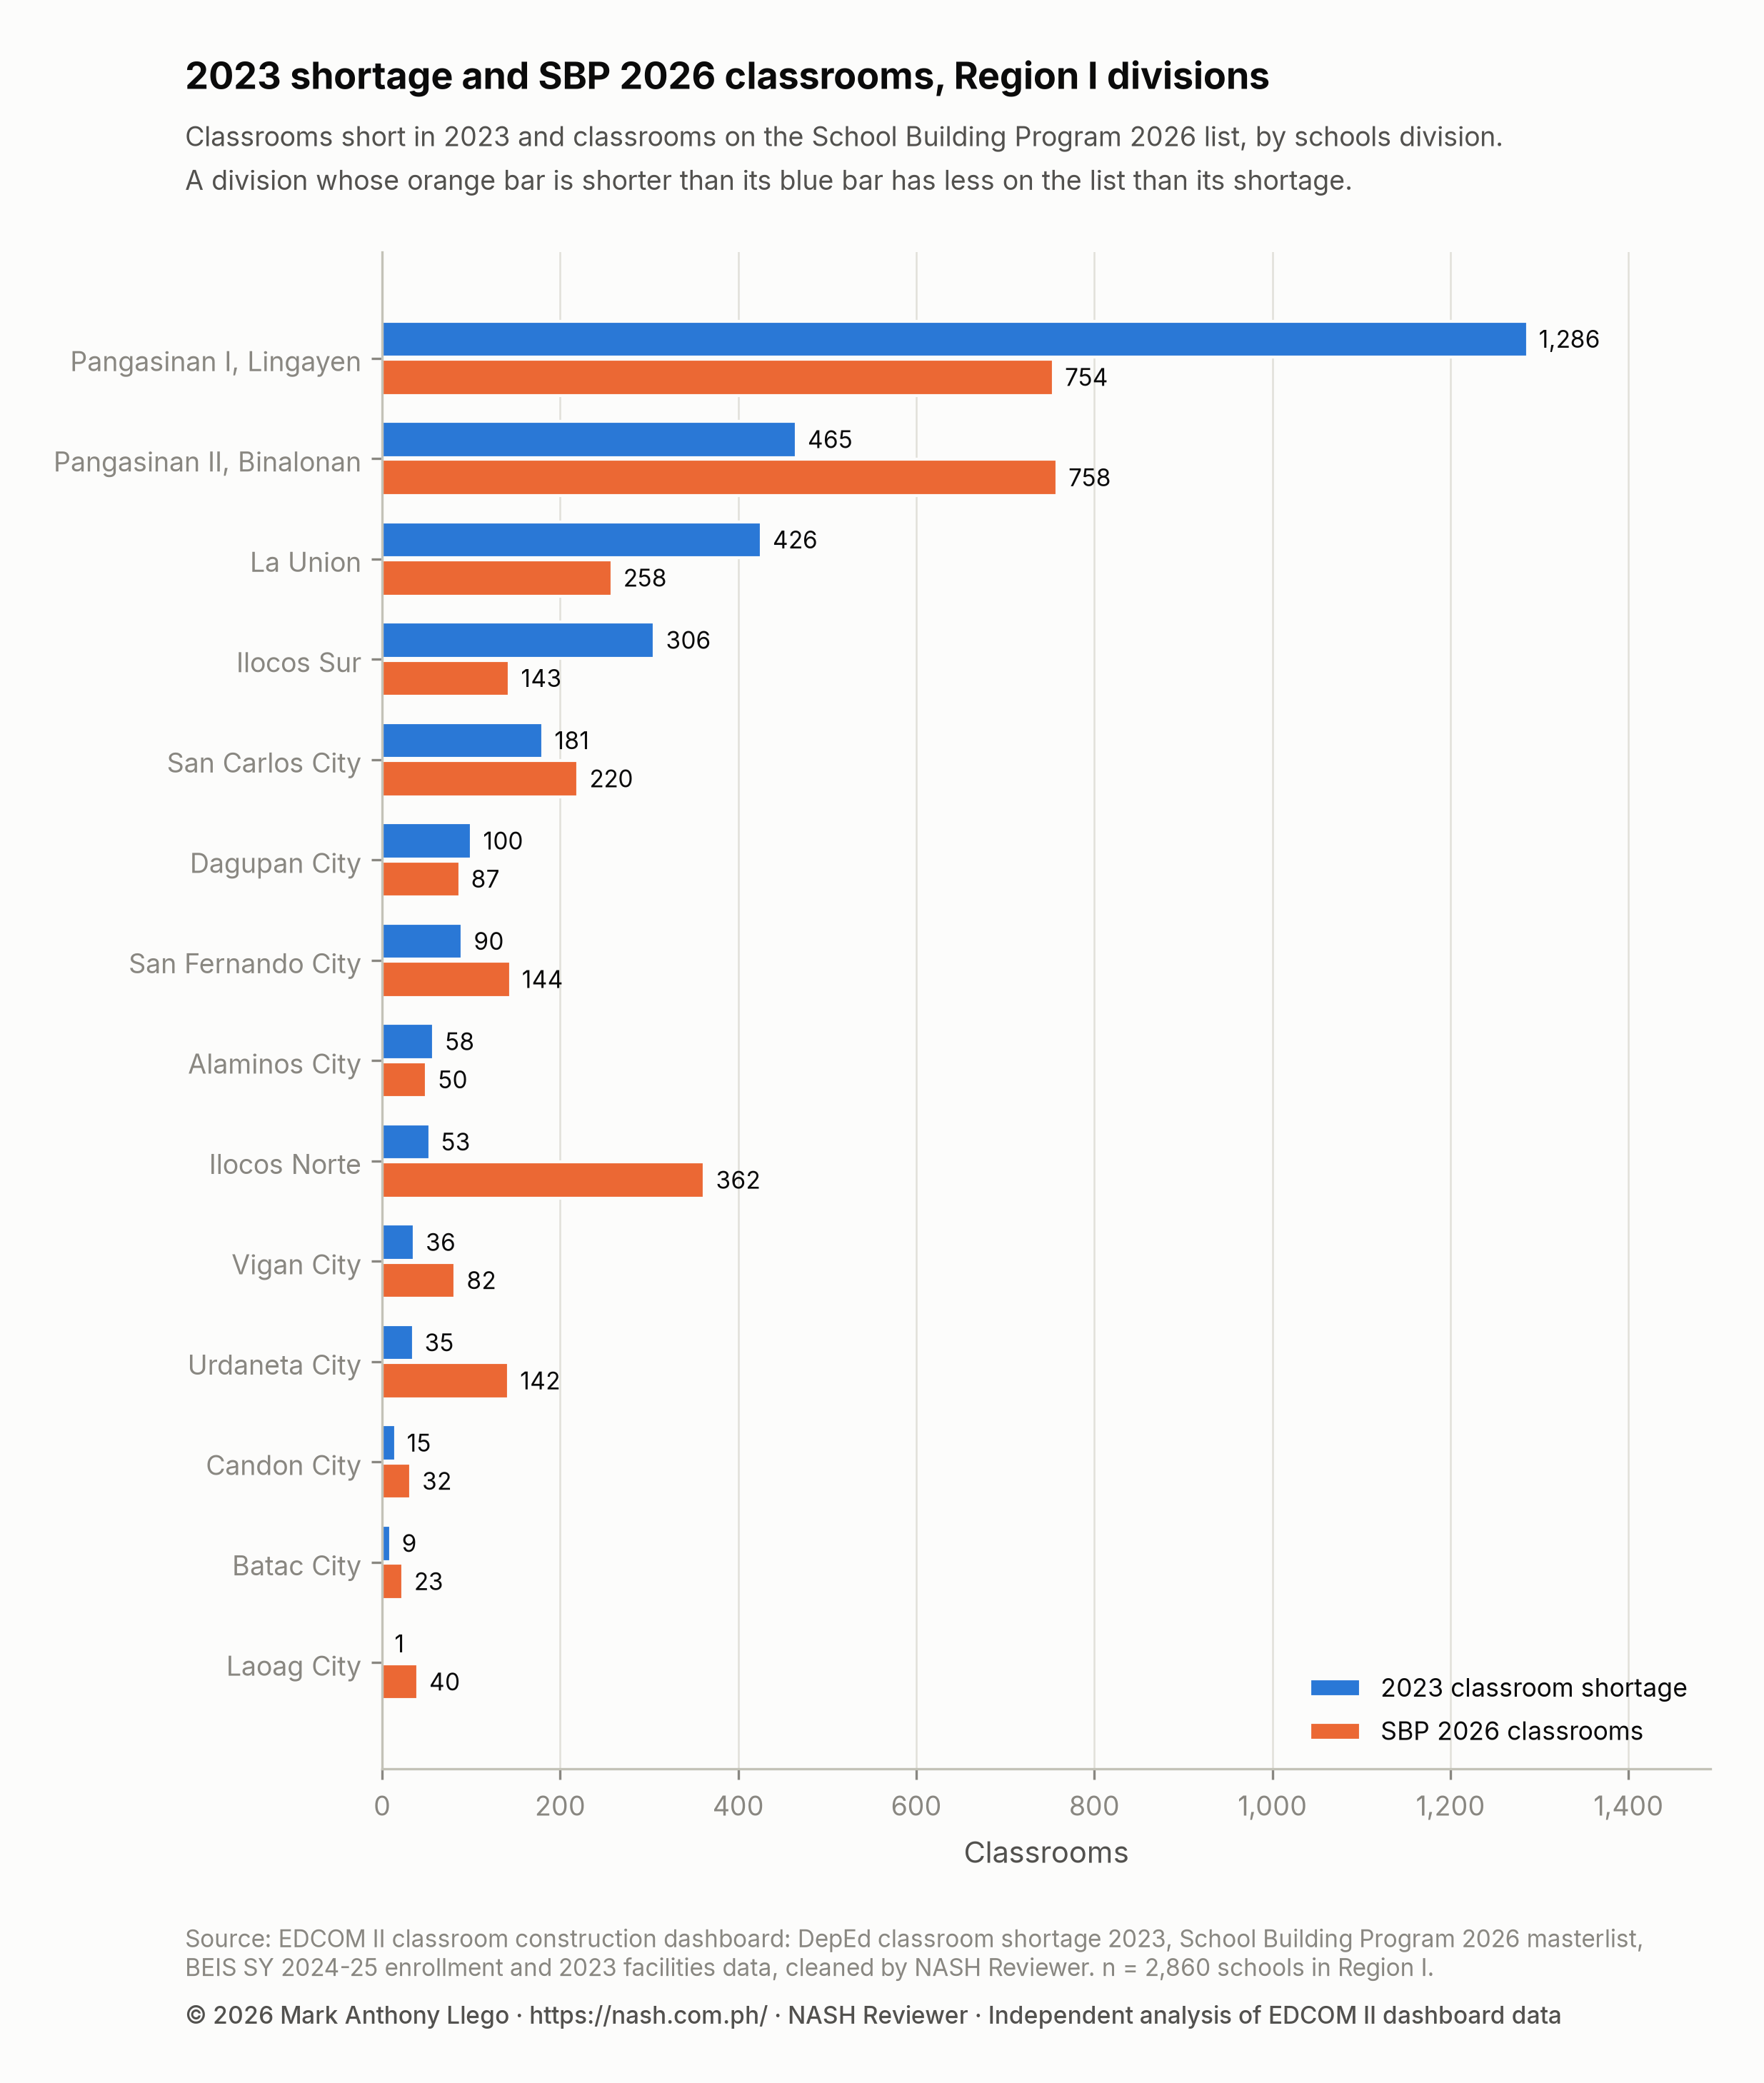
The chart splits the region in two. Pangasinan I, Lingayen, La Union and Ilocos Sur, three of the four divisions with the largest shortages, have orange bars shorter than their blue ones. In Pangasinan II, Binalonan, Ilocos Norte and most of the city divisions, the orange bar is the longer one.
| Modality group | Lines | Schools | Classrooms | Share of the region’s SBP classrooms |
|---|---|---|---|---|
| DPWH | 106 | 106 | 476 | 15.4% |
| LGU | 135 | 135 | 531 | 17.1% |
| DepEd | 80 | 80 | 95 | 3.1% |
| PSIP III (PPP) | 180 | 164 | 1,995 | 64.4% |
PSIP III makes up 1,995 of the region’s 2026 classrooms, 64.4%, against half of the national list, on 180 lines at 164 schools. Local governments implement 531 classrooms (17.1%), the Department of Public Works and Highways (DPWH) 476 (15.4%) and DepEd 95 (3.1%). For what each modality builds and what it costs, see DepEd School Building Program 2026 in Numbers.
A coverage above 100% does not mean the shortage is met. School by school, 1,081 of the region’s 2026 classrooms (34.9%) fall within the receiving school’s own 2023 shortage, against 53.0% nationally. Another 998 (32.2%) go to 206 schools that had no 2023 shortage, against 23.0% of the national list, and most of the rest go to schools beyond their own shortage. Only 239 of the 867 schools with a shortage (27.6%) receive any classroom, though 42 of the 61 schools short by more than 10 do (68.9%). Counted this way, the list meets 35.3% of the region’s shortage, against 10.4% nationally, and leaves 1,981 classrooms unmet. Do 2026 Classrooms Go Where the Shortage Is? explains why a classroom beyond a school’s own shortage meets no other school’s need.
Class shifts and crowded classrooms in Region I
Shifts are rare in the region but concentrated in large schools. In SY 2024-25, 18 of the region’s 2,865 schools in the enrollment data (0.6%) held classes in two or more shifts, none in three, yet they enroll 62,158 learners, 5.9% of the total. 94.4% of them had a 2023 shortage, and 13 (72.2%) receive SBP 2026 classrooms.
The median school has 20.5 learners per classroom in elementary, 27.5 in junior high and 28.6 in senior high, against 24.9, 32.1 and 30.6 nationally. Crowding is limited to a small group: 112 schools pass 50 learners per classroom, holding 9.5% of the learners counted, and at least 432 classrooms would bring each of them down to 50. Class Shifts and Crowded Classrooms in DepEd Schools explains the measure.
The 2023 facilities data show the region’s other need. Only 350 schools (12.2%) use makeshift rooms, against 29.0% nationally, but 960 schools (33.6%) report a building for condemnation or demolition, 2,161 buildings in all, against 28.9% of schools nationally.
Last Mile Schools in Region I
355 of the region’s schools (12.4%) are flagged as Last Mile Schools, schools in geographically isolated, disadvantaged and conflict-affected areas and hardship posts, fewer than the national 18.5%. They hold 206 classrooms of shortage, 6.7% of the region’s. They are more likely to have a shortage than the region’s other schools, 36.3% against 29.5%.
On the 2026 list, they are less likely to receive classrooms than other schools, 11.8% against 16.1%, with 100 classrooms between them, and 103 Last Mile Schools with a shortage, 167 classrooms in all, receive none. DepEd’s own Last Mile School modality has nine lines with 24 classrooms in the region. The national picture is in Last Mile Schools: Classroom Need and 2026 Allocation.
What this means for school heads in Region I
A regional total above 100% can make it look as if the Ilocos Region’s classroom problem is solved. For most schools with a shortage it is not, so the case has to be made school by school.
- Look up your school before the region. Search the school table by school ID for the school’s own 2023 shortage and SBP 2026 classrooms; every file is linked from the EDCOM II classroom data page.
- Do not let the regional coverage speak for your school. Only 27.6% of the region’s schools with a shortage receive any classroom; if yours is short and not on the list, state the shortage, enrollment and any shifts with their years in the school improvement plan and the annual implementation plan.
- Read what each line is for. A school with no 2023 shortage may receive classrooms to replace a building for condemnation or for enrollment since 2023; the SBP lines file gives each line’s scope of work, which helps explain a list like Laoag City’s 40 classrooms for a shortage of one.
- Record buildings for condemnation. 960 of the region’s schools report one; a condemned building is a case for replacement that the shortage count alone may not show.
- In Pangasinan I, Lingayen and La Union, lead with the gap. These divisions hold most of the region’s shortage and get less than it on the list, 58.6% and 60.6%, while neighboring divisions get more.
- Follow the PSIP III lines. 164 of the region’s schools have PSIP III lines, still for bidding; plan with the division on the expected construction period from March 2027 to July 2028.
How these numbers were made
The data are the cleaned tables behind the EDCOM II classroom construction dashboard: DepEd’s 2023 classroom shortage by school, the SBP 2026 masterlist, SY 2024-25 enrollment and class shifts from the Basic Education Information System (BEIS), 2023 school facilities, and school coordinates from the National School Building Inventory (NSBI) for SY 2022-23. How the EDCOM Classroom Data Was Cleaned documents every table and cleaning rule.
A school’s shortage is DepEd’s 2023 figure for Kindergarten to Grade 10 plus senior high school, counted only where the school lacks classrooms. The shortage per 1,000 learners divides the shortage of schools with SY 2024-25 learners by those learners and multiplies by 1,000. Learners per classroom divide SY 2024-25 learners by 2023 instructional classrooms. A division’s coverage is its SBP 2026 classrooms divided by its 2023 shortage, so it compares totals and can pass 100% while some schools with a shortage receive nothing. Classrooms within a school’s shortage are counted up to the size of that shortage, and any beyond it are counted as beyond. Regions follow the PSGC, with the region’s cities counted inside its four provinces; divisions are DepEd’s schools divisions.
The analysis was done in Python with pandas, and the charts drawn with Matplotlib.
Limits
The sources span several years: the shortage and facilities are from 2023, enrollment and shifts from SY 2024-25, and the allocations from 2026, so a school’s figures may have changed since, and a school with no 2023 shortage may have one now. The SBP list shows planned classrooms, not finished ones, and most of the region’s are PSIP III classrooms still for bidding. The data do not say why a school receives classrooms; a line may replace a condemned building or serve growth rather than meet the 2023 shortage. The shortage is DepEd’s own estimate, and new, merged or renumbered schools may be missing or counted under a new ID. Division totals of SBP classrooms leave out the two schools with no division in the data. These are descriptive figures: they show where the shortage and the 2026 classrooms are, not why.
Frequently asked questions
How big is the classroom shortage in Region I?
DepEd’s 2023 data put the Ilocos Region’s classroom shortage at 3,061 classrooms, 1.9% of the national shortage of 165,443. That is 2.9 classrooms per 1,000 learners, the lowest of any region, against 7.4 nationally, and 30.3% of the region’s public schools have a shortage.
Which province in the Ilocos Region has the biggest classroom shortage?
Pangasinan, with 2,125 classrooms, 69.4% of the region’s shortage; within it, the Pangasinan I, Lingayen division is short 1,286. By rate, the highest division is San Fernando City in La Union, at 4.5 classrooms per 1,000 learners, and the highest province La Union, at 3.4.
How many classrooms will Region I get under the SBP 2026?
The SBP 2026 masterlist has 3,097 classrooms for Region I on 501 lines at 449 schools: 1,102 funded under the GAA 2026 with PHP 3.48 billion, and 1,995 under PSIP III. They equal 101.2% of the region’s 2023 shortage, against 19.6% nationally. The list is a plan; it does not mean the classrooms are built.
Does the SBP 2026 list cover Region I’s whole classroom shortage?
Not school by school. The list’s total is larger than the shortage, but 32.2% of its classrooms go to schools with no 2023 shortage, and only 27.6% of the schools with a shortage receive any. Counted against each school’s own shortage, the list meets 35.3% of it and leaves 1,981 classrooms unmet.
Download the data and cite this post
The cleaned EDCOM II classroom data behind this series are free to download for personal study; to reuse them, email support@nash.com.ph for written permission first. How the EDCOM Classroom Data Was Cleaned explains every table and cleaning rule. The files are at data.nash.com.ph: start with the README, then the school table (Parquet, or CSV), the School Building Program lines (CSV), the city and municipality table (CSV), and every table for Stata and SPSS. Every regional figure in this report can be computed from the school table, filtered to Region I by deped_region.
Every file, with its rows, columns and checksum, is listed on the EDCOM II classroom data page. To cite the data: Llego, M. A. (2026). EDCOM II classroom construction dashboard data, cleaned, version 1.1. NASH Reviewer. https://nash.com.ph/edcom-classroom-data
To cite this post: Llego, M. A. (2026, October 28). Classroom shortage in Region I, 2023–2026: Pangasinan. NASH Reviewer Blog. https://nash.com.ph/blog/classroom-shortage-region-1-ilocos
References
- Llego, M. A. (2026). EDCOM II classroom construction dashboard data, cleaned, version 1.1 [Data set]. NASH Reviewer. https://nash.com.ph/edcom-classroom-data
- Second Congressional Commission on Education (EDCOM II). (2026, October 20). Put classrooms where they’re needed most, EDCOM 2 tells DepEd [News release]. https://edcom2.gov.ph/put-classrooms-where-theyre-needed-most-edcom-2-tells-deped/
More in this series
- How the EDCOM Classroom Data Was Cleaned
- Philippine Classroom Shortage 2023: Where the Gap Is
- DepEd School Building Program 2026 in Numbers
- Do 2026 Classrooms Go Where the Shortage Is?
- Classroom Allocation by LGU Income Class, 2026
- Class Shifts and Crowded Classrooms in DepEd Schools
- Last Mile Schools: Classroom Need and 2026 Allocation
- Regional reports: NCR, CAR, Region I, Region II, Region III, Region IV-A, MIMAROPA, Region V, Region VI, NIR, Region VII, Region VIII, Region IX, Region X, Region XI, Region XII, Caraga, BARMM
- Rankings and deep dives: Congressional districts, Top 20 cities and municipalities, Rizal, Quezon City, City of Manila, Tawi-Tawi, Cavite, Cost of a classroom
- Explainers: PSIP III, Senior high shortage, Junior high shortage, Excess classrooms, Learning Continuity Spaces, How learners reach school
- For teachers and school heads: Action research and thesis topics
- Related: CRLA Results SY 2025-26 in Region I: Pangasinan and Grade 1, DepEd School Improvement Plan (SIP): Steps, AIP and SRC, How to Read DepEd Data: A Guide for Aspiring School Heads
Analysis and charts by Mark Anthony Llego for NASH Reviewer. Data: EDCOM II classroom construction dashboard and Department of Education data. NASH Reviewer is not affiliated with EDCOM II or DepEd. Charts may be reused only with written permission from support@nash.com.ph.