Rizal province, with the City of Antipolo, lacked 8,516 classrooms in 2023, according to DepEd’s classroom shortage data as published in the EDCOM II classroom construction dashboard. That is 5.1% of the country’s shortage of 165,443 classrooms, the second largest of the 118 provinces and highly urbanized cities after Cavite. Measured against learners, the gap is wider still: Rizal is short 13.5 classrooms for every 1,000 learners enrolled in SY 2024-25, 1.8 times the national rate of 7.4, and 294 of its 369 schools in the shortage data (79.7%) lack classrooms.
The School Building Program (SBP) 2026 lists 314 classrooms for Rizal, enough for 3.7% of that shortage. What the list holds lands mostly where the need is: 84.7% of its classrooms fall within the receiving school’s own 2023 shortage, and the schools on the list have larger shortages than the schools left off. But it reaches only 31 of the 294 schools with a shortage. Counted school by school, the 2026 list meets 3.1% of Rizal’s shortage and leaves 8,249 classrooms unmet.
The Region IV-A report gives Rizal’s division and province figures. The figures below, from the cleaned school-level data behind the dashboard, go school by school. Every file is listed on the EDCOM II classroom data page.
Key findings
- Rizal, with Antipolo, lacked 8,516 classrooms in 2023, 13.5 per 1,000 learners against 7.4 nationally, and the two districts DepEd’s 2023 table labels Rizal, 1st and 2nd District have the largest shortages of any congressional district.
- The City of Antipolo holds 2,663 classrooms of the shortage (31.3%), and San Mateo has the highest rate, 15.9 classrooms per 1,000 learners.
- Large gaps are the norm: among schools with a shortage the median is 16.5 classrooms, against 3.0 nationally, and Antipolo National High School alone is short 193.
- The SBP 2026 list holds 314 classrooms for Rizal (3.7% of the shortage), 212 of them PSIP III, and only 31 of the 294 schools with a shortage (10.5%) receive any.
- The list leans modestly toward the larger shortages: listed schools have a median shortage of 26.0 classrooms and unlisted ones 15.0 (Mann–Whitney p = 0.015, rank-biserial r = 0.27).
- 107 schools (28.8%) held classes in two or more shifts in SY 2024-25, enrolling 49.8% of Rizal’s learners, and 164 schools have more than 50 learners per classroom.
Rizal against Region IV-A and the country
The table sets Rizal beside its region and the country, with the same definition in each row. Rizal here is the province of the Philippine Standard Geographic Code (PSGC), so it counts the City of Antipolo and both of its schools divisions, Rizal and Antipolo City.
| Indicator | Rizal | Region IV-A | Philippines |
|---|---|---|---|
| Schools in the 2023 shortage data | 369 | 3,552 | 47,659 |
| Schools with a classroom shortage | 79.7% | 63.2% | 54.2% |
| Classroom shortage (2023) | 8,516 | 31,010 | 165,443 |
| Shortage per 1,000 learners | 13.5 | 10.1 | 7.4 |
| Median shortage of schools with a shortage | 16.5 | 5.0 | 3.0 |
| SBP 2026 classrooms | 314 | 6,470 | 32,419 |
| SBP 2026 classrooms as a share of the shortage | 3.7% | 20.9% | 19.6% |
| SBP 2026 classrooms within the receiving school’s shortage | 84.7% | 62.1% | 53.0% |
| Schools with a shortage that get any SBP 2026 classroom | 10.5% | 17.0% | 13.3% |
| Schools with two or more shifts (SY 2024-25) | 28.8% | 13.7% | 4.3% |
| Median learners per classroom, elementary | 43.7 | 31.4 | 24.9 |
| Schools using makeshift rooms (2023) | 6.5% | 21.6% | 29.0% |
| Last Mile Schools | 5.7% | 8.8% | 18.5% |
Rizal is above its region on every row that measures the shortage, shifts and crowding, and below it on the two rows that measure the 2026 list’s reach: coverage and the share of schools with a shortage that get any classroom. It has fewer makeshift rooms and Last Mile Schools. Its shortage per learner is the 12th highest of the 115 provinces and highly urbanized cities with 20,000 learners or more, and its count is second only to Cavite’s 8,832. Its 2026 classrooms equal 3.7% of its shortage, against 20.9% in Region IV-A and 19.6% in the country, and its share of the national list, 1.0%, is far below its 5.1% share of the national shortage.
The same pattern, a large shortage and a short list, shows at every level of the national rankings. The Rizal provincial division, which covers the province outside Antipolo, is short 5,853 classrooms, the largest shortage of any schools division in the country (Philippine Classroom Shortage 2023: Where the Gap Is), and the Antipolo City division’s 15.1 per 1,000 learners is the ninth highest rate of the 209 divisions with 20,000 learners or more. As DepEd’s 2023 table labels them, Rizal, 2nd District is short 4,522 classrooms and Rizal, 1st District 3,993, the two largest shortages of the country’s congressional districts, with coverage of 3.7% and 3.1%; the two labels cover all of Rizal’s schools, Antipolo’s included, and districts drawn since 2023 may differ (Classroom Shortage by Congressional District, 2023–2026). Among cities and municipalities, the City of Antipolo ranks fifth and Rodriguez 12th by shortage (the 20 cities and municipalities with the largest shortages).
Kindergarten to Grade 10 accounts for 7,983 classrooms of the shortage and senior high school for 532 (6.3%). At the same time, 59 schools report more Kindergarten to Grade 10 classrooms than they need, 189 in all; those rooms stand in other schools and do not reduce anyone’s shortage.
Classroom shortage by city and municipality in Rizal
Rizal’s 14 cities and municipalities run from the City of Antipolo and the towns on the Metro Manila border to the smaller lakeshore and upland towns of the east. The chart sets each one’s 2023 shortage beside its SBP 2026 classrooms.
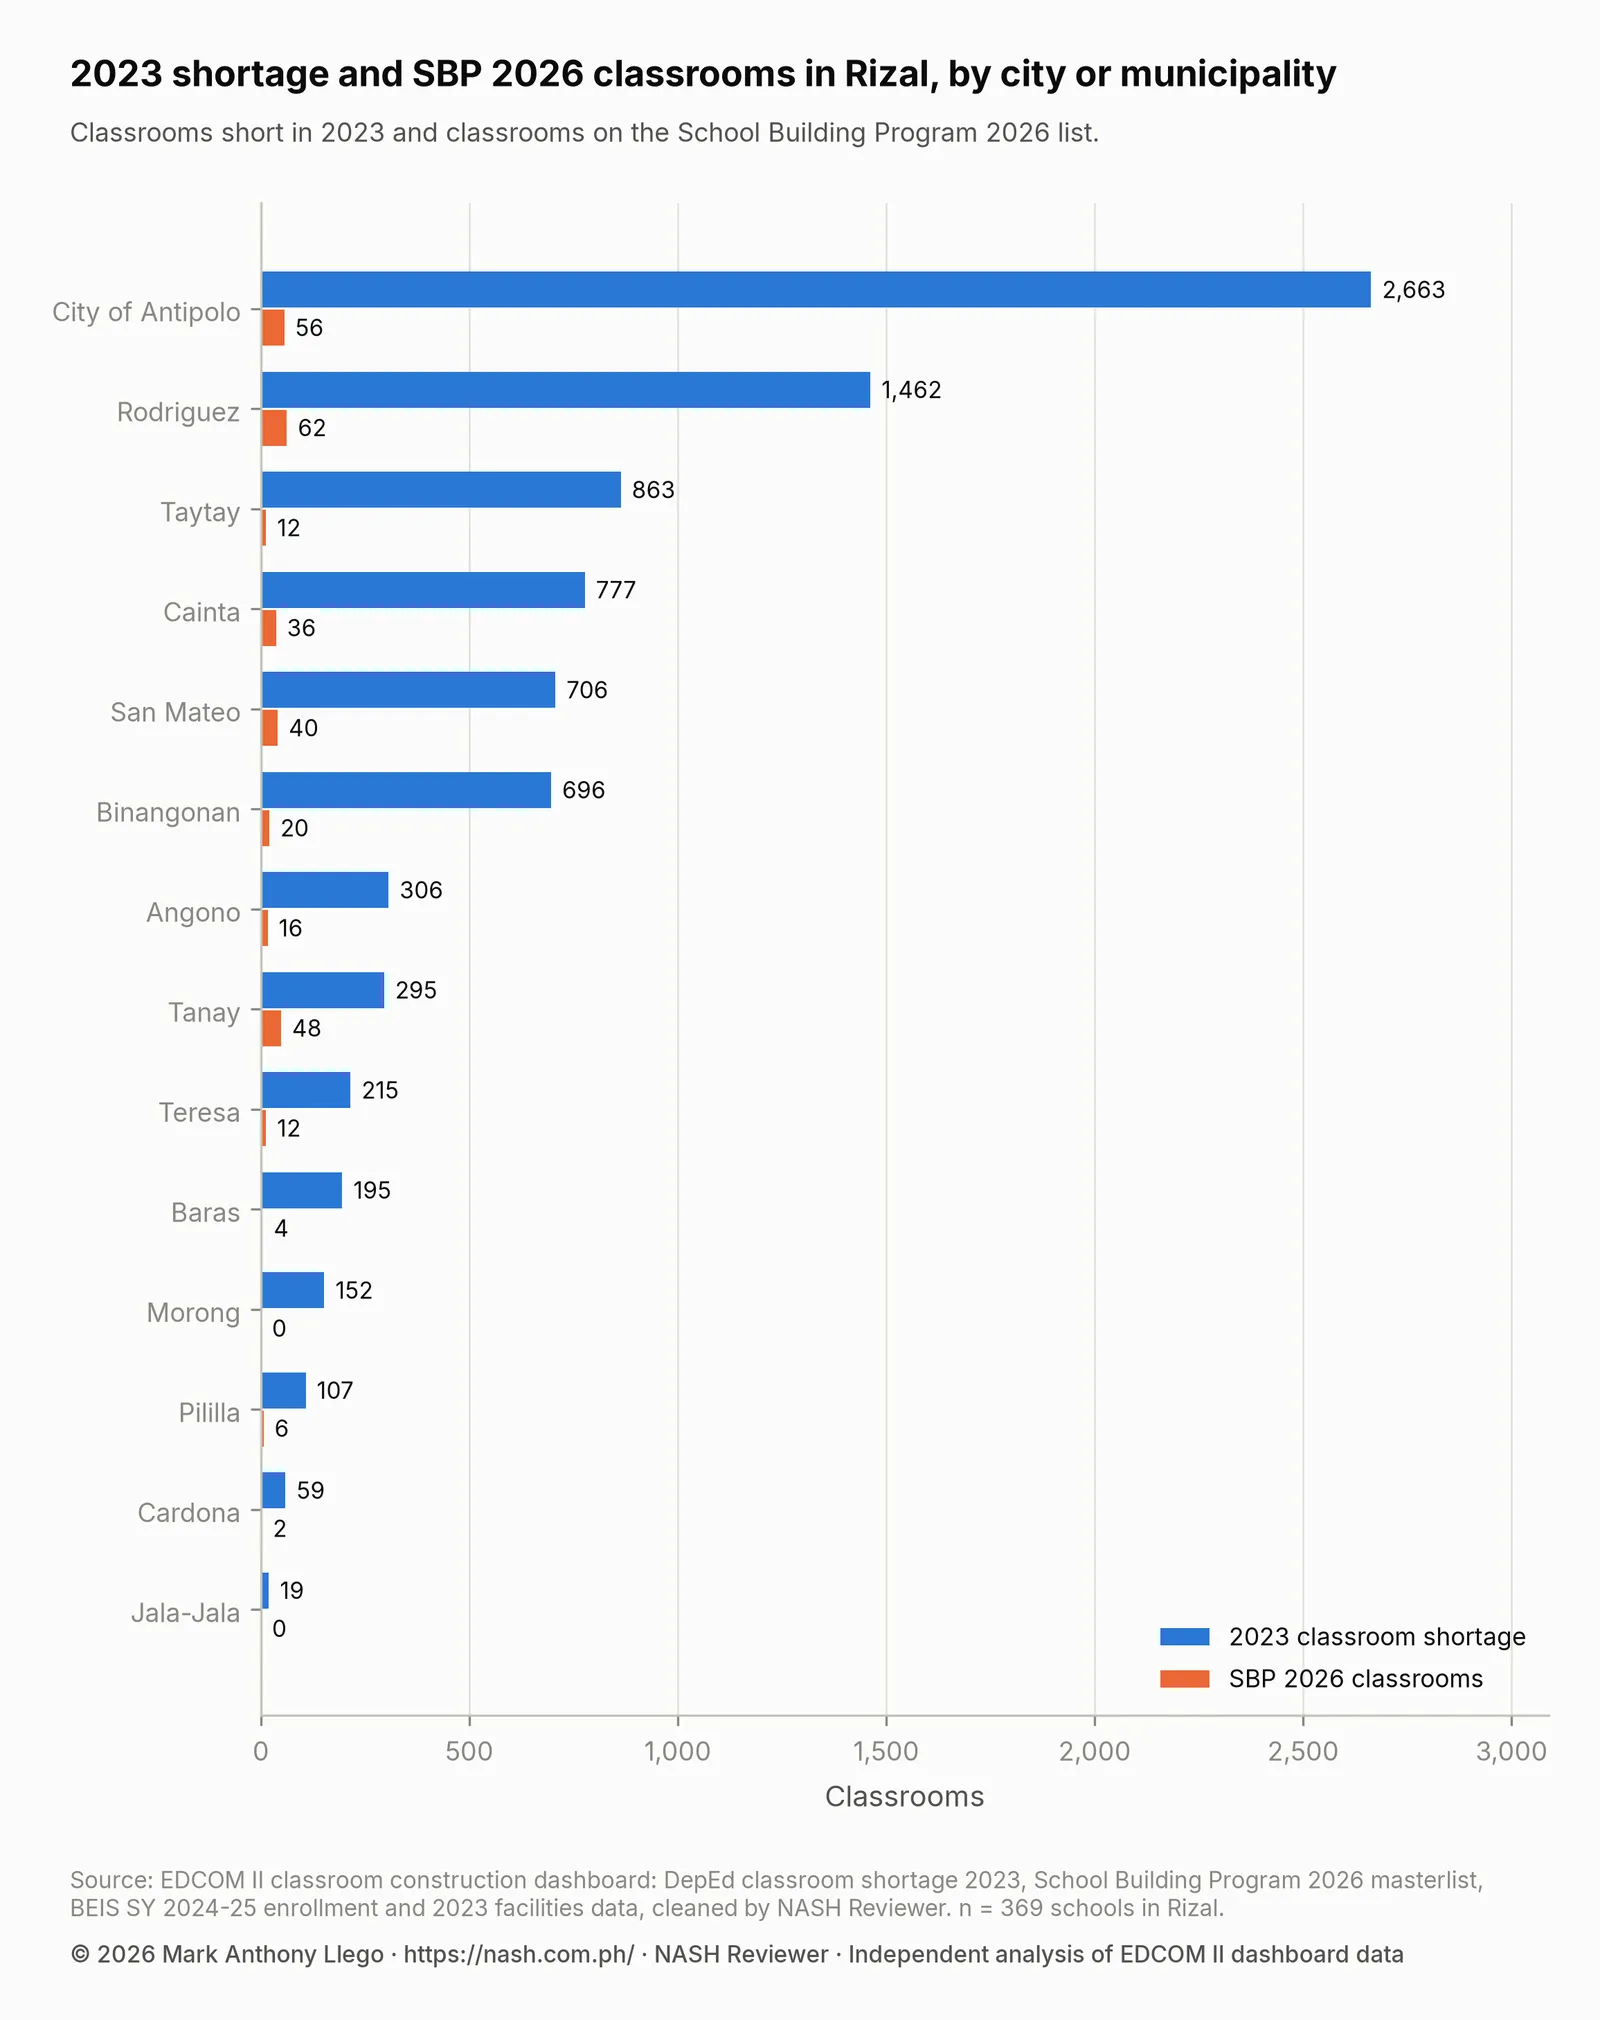
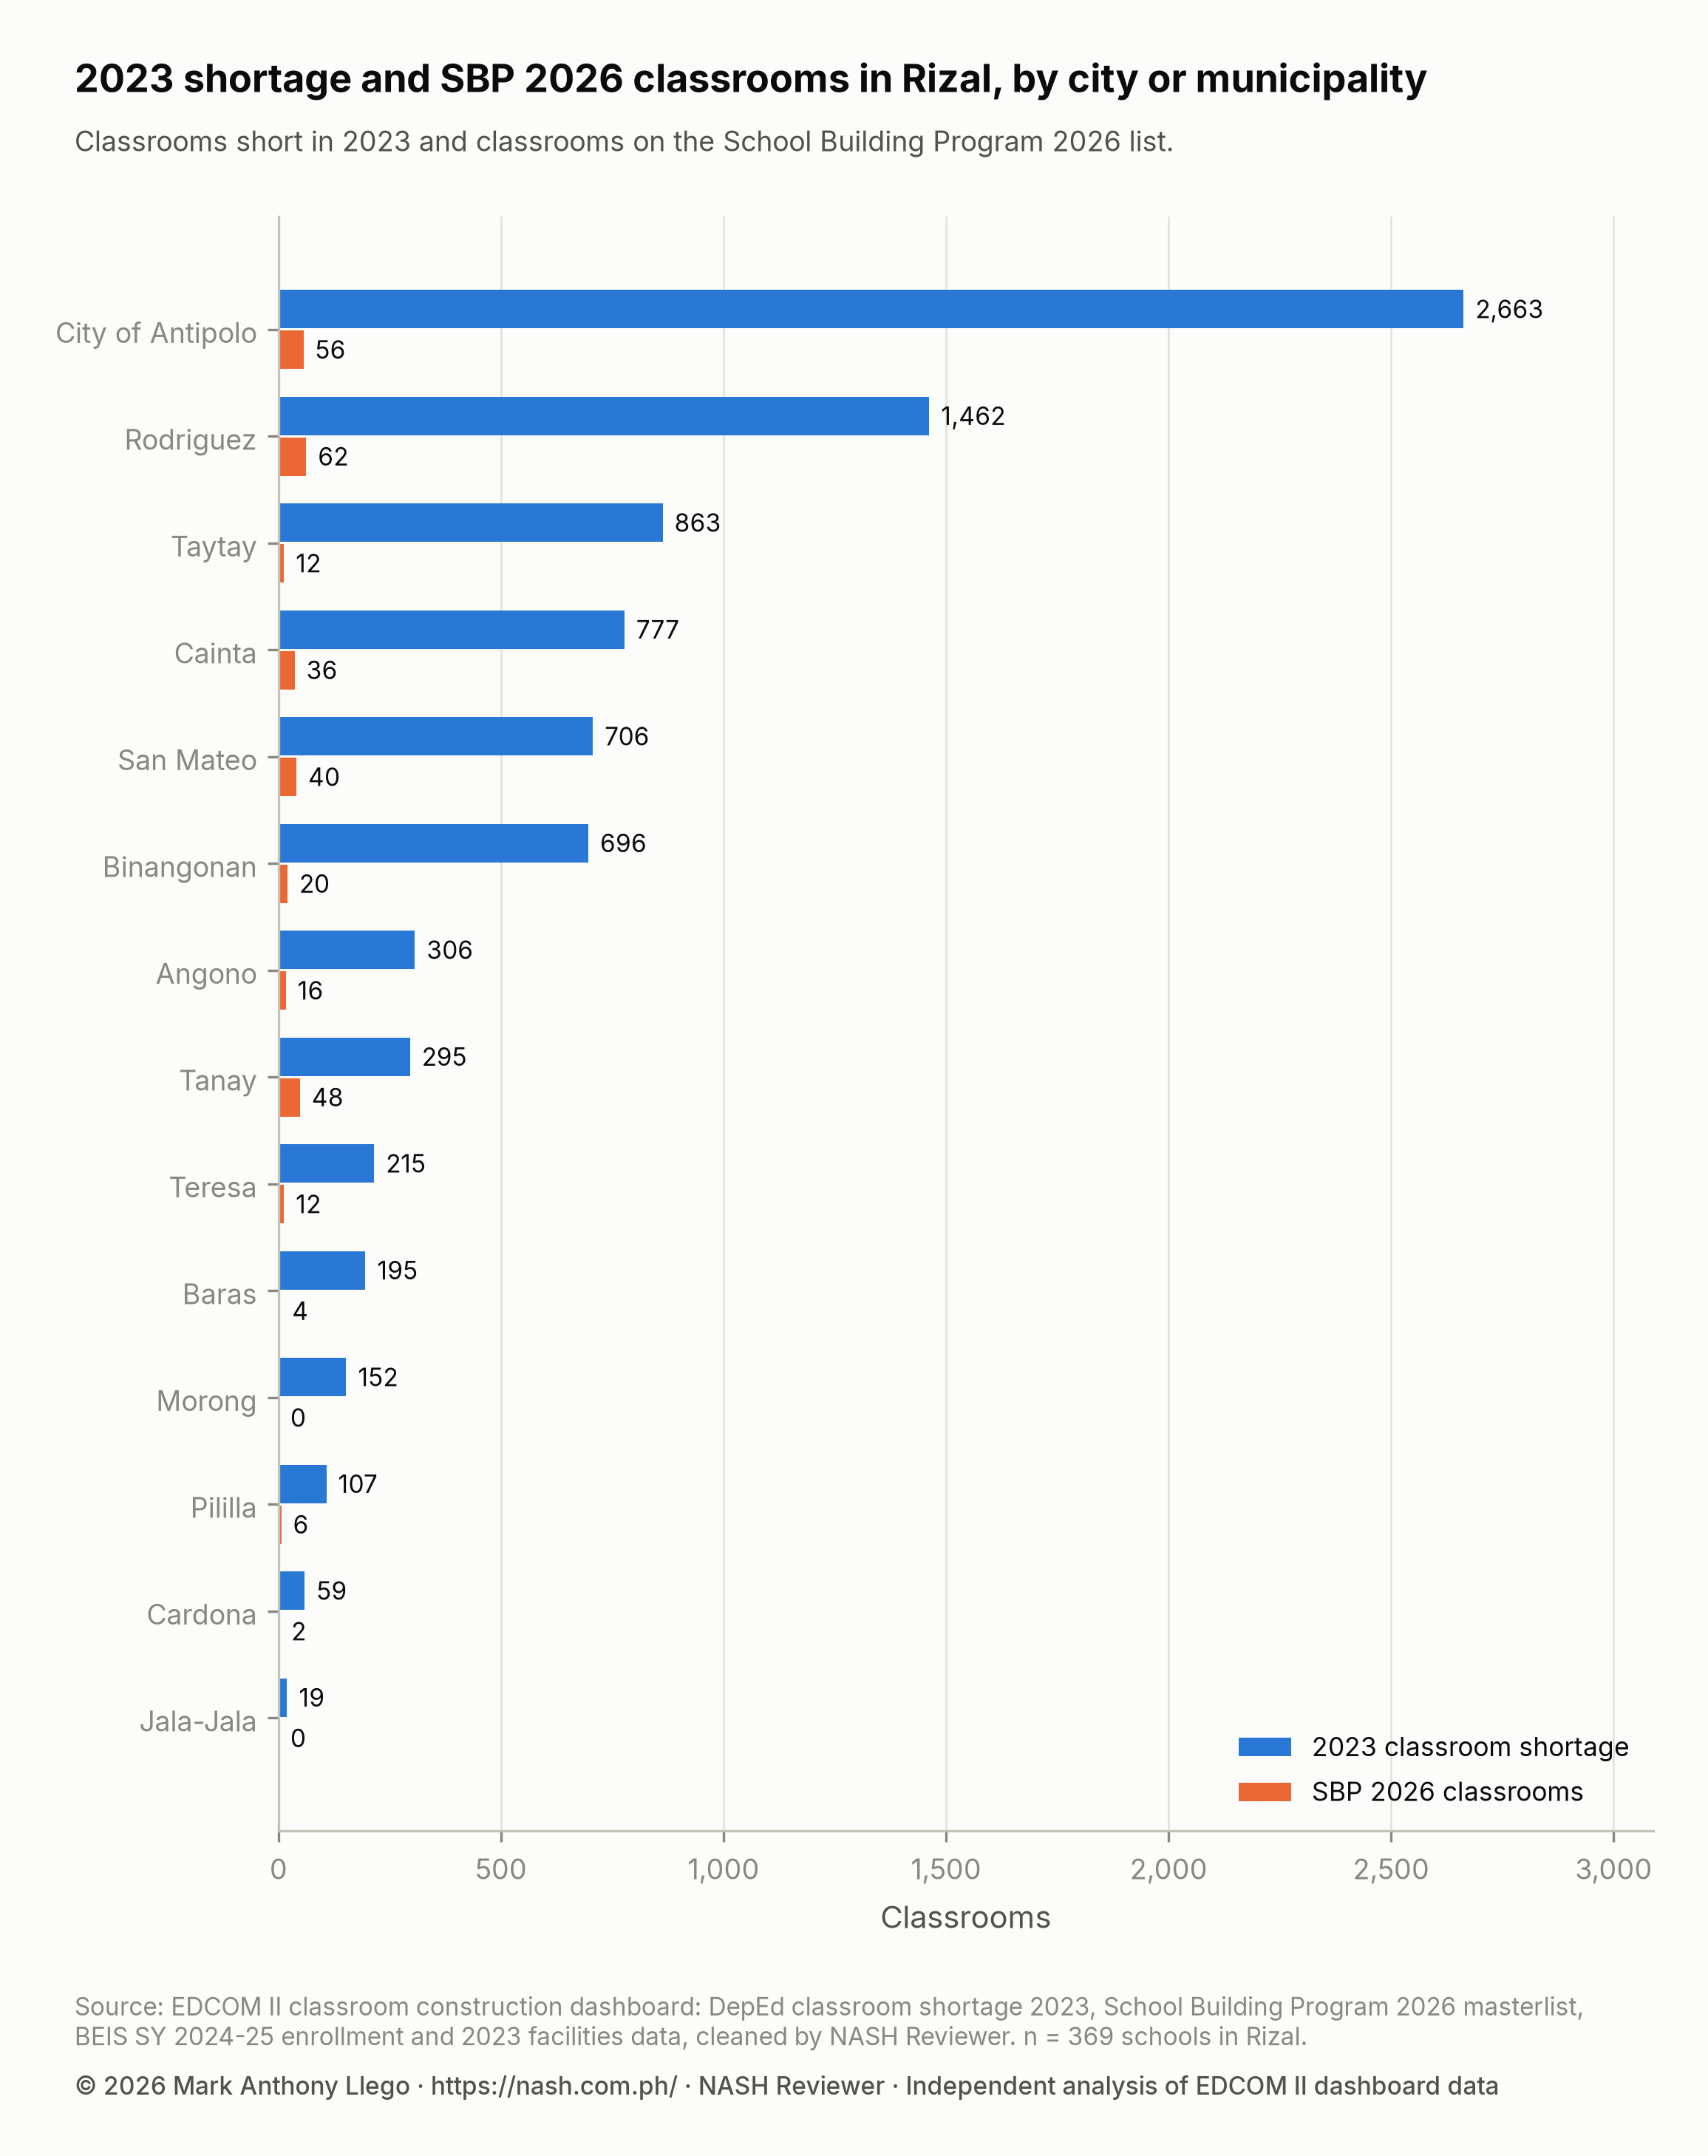
Every orange bar is a sliver beside its blue one. The City of Antipolo alone is short 2,663 classrooms, 31.3% of the province’s shortage, and has 56 on the list; Rodriguez, short 1,462, has 62. No city or municipality in Rizal is listed for more than its shortage. Tanay has the highest coverage, 16.3%, and two towns have no SBP 2026 classroom at all: Morong, short 152, and Jala-Jala, short 19.
| City or municipality | Schools | Learners (SY 2024-25) | Classroom shortage (2023) | Shortage per 1,000 learners | Schools with a shortage | Schools on shifts | SBP 2026 classrooms | Coverage |
|---|---|---|---|---|---|---|---|---|
| City of Antipolo | 67 | 176,473 | 2,663 | 15.1 | 79.1% | 42 | 56 | 2.1% |
| Rodriguez | 47 | 93,873 | 1,462 | 15.6 | 89.4% | 13 | 62 | 4.2% |
| Taytay | 25 | 62,934 | 863 | 13.7 | 92.0% | 9 | 12 | 1.4% |
| Cainta | 25 | 49,652 | 777 | 15.6 | 100.0% | 11 | 36 | 4.6% |
| San Mateo | 21 | 44,422 | 706 | 15.9 | 100.0% | 6 | 40 | 5.7% |
| Binangonan | 45 | 62,362 | 696 | 11.2 | 60.0% | 10 | 20 | 2.9% |
| Angono | 9 | 25,296 | 306 | 12.1 | 100.0% | 5 | 16 | 5.2% |
| Tanay | 48 | 30,115 | 295 | 9.8 | 66.7% | 2 | 48 | 16.3% |
| Teresa | 10 | 18,718 | 215 | 11.5 | 100.0% | 2 | 12 | 5.6% |
| Baras | 12 | 14,785 | 195 | 13.2 | 83.3% | 2 | 4 | 2.1% |
| Morong | 17 | 16,925 | 152 | 9.0 | 76.5% | 1 | 0 | 0.0% |
| Pililla | 14 | 15,565 | 107 | 6.9 | 78.6% | 2 | 6 | 5.6% |
| Cardona | 18 | 12,679 | 59 | 4.7 | 66.7% | 1 | 2 | 3.4% |
| Jala-Jala | 11 | 7,167 | 19 | 2.7 | 54.5% | 1 | 0 | 0.0% |
By rate, San Mateo (15.9), Rodriguez and Cainta (15.6 each) and the City of Antipolo (15.1) lead, and every school in Cainta, San Mateo, Angono and Teresa has a shortage. Only the three smallest shortages, in Pililla, Cardona and Jala-Jala, sit below the national rate of 7.4; Jala-Jala is lowest at 2.7. The City of Antipolo also holds 42 of the province’s 107 schools on shifts.
The city table follows the PSGC, so its figures can differ from the division of the same name. The City of Antipolo has 56 SBP classrooms and the Antipolo City division 40, as the regional report notes, because the other 16 are at Kaila Integrated School, a school with no 2023 shortage record.
Schools with the largest classroom shortages in Rizal
The 15 schools with the largest shortages are short 1,903 classrooms between them, 22.3% of the province’s shortage. Ten of them are in the City of Antipolo, 12 hold classes in two or more shifts, and four are on the SBP 2026 list. The school ID lets a reader find each one in the school table.
| School ID | School | City or municipality | Barangay | Learners (SY 2024-25) | Learners per classroom | Classroom shortage (2023) | SBP 2026 classrooms | Two or more shifts |
|---|---|---|---|---|---|---|---|---|
| 301418 | Antipolo National High School | City of Antipolo | Santa Cruz | 11,435 | 91.5 | 193 | 8 | Yes |
| 109319 | Bagong Nayon I ES | City of Antipolo | Bagong Nayon | 8,909 | 74.9 | 161 | 0 | Yes |
| 109342 | Sta. Cruz ES | City of Antipolo | Santa Cruz | 10,226 | 78.1 | 147 | 12 | Yes |
| 109327 | Juan Sumulong ES | City of Antipolo | San Roque | 8,164 | 75.6 | 138 | 0 | Yes |
| 109469 | Kasiglahan Village Elementary School | Rodriguez | San Jose | 8,287 | 78.2 | 137 | 0 | No |
| 301457 | San Jose National High School | City of Antipolo | San Jose | 8,151 | 81.5 | 131 | 0 | Yes |
| 109337 | Peñafrancia ES | City of Antipolo | Cupang | 4,619 | 355.3 | 126 | 0 | Yes |
| 165512 | Baras Pinugay Elementary School | Baras | Pinugay | 3,092 | 70.3 | 119 | 0 | No |
| 301467 | Teresa National High School | Teresa | Bagumbayan | 4,380 | 89.4 | 117 | 12 | Yes |
| 109320 | Bagong Nayon II ES | City of Antipolo | San Isidro | 6,534 | 78.7 | 116 | 0 | Yes |
| 109323 | Cupang ES | City of Antipolo | Cupang | 4,792 | 116.9 | 115 | 0 | Yes |
| 109477 | San Isidro Elementary School | Rodriguez | San Isidro | 5,455 | 94.1 | 106 | 0 | Yes |
| 301419 | Bagong Nayon II National High School | City of Antipolo | San Isidro | 5,013 | 150.3 | 102 | 0 | Yes |
| 301469 | Vicente Madrigal National High School | Binangonan | Palangoy | 6,223 | 78.8 | 99 | 0 | No |
| 109339 | San Isidro ES | City of Antipolo | San Isidro | 4,937 | 105.0 | 96 | 12 | Yes |
Antipolo National High School, with 11,435 learners, has the largest shortage in the province, 193 classrooms, and eight classrooms on the 2026 list. Sta. Cruz ES and San Isidro ES in Antipolo and Teresa National High School have 12 each, against shortages of 96 to 147. The rest, Bagong Nayon I ES (161) and Juan Sumulong ES (138) among them, have none. Three figures for learners per classroom stand out: 355.3 at Peñafrancia ES, 150.3 at Bagong Nayon II National High School and 116.9 at Cupang ES. They divide SY 2024-25 learners by the instructional classrooms counted in 2023, so they are worth checking against each school’s own room count.
The shortage is less concentrated than in the country because large gaps are common. The 37 schools with the largest shortages, the top 10% of Rizal’s schools, hold 42.3% of it, against 66.0% nationally; half of it is spread over 49 schools (13.3%), against 4.7% of schools nationally; and 190 schools are short by 10 or more classrooms. Among schools with a shortage, the median is 16.5 classrooms, against 3.0 in the country, so a typical Rizal school with a shortage lacks the rooms of a whole building, not one or two rooms.
Where Rizal’s SBP 2026 classrooms go
The map places every Rizal school with usable coordinates, sized by its 2023 shortage and colored by whether it is on the SBP 2026 list.
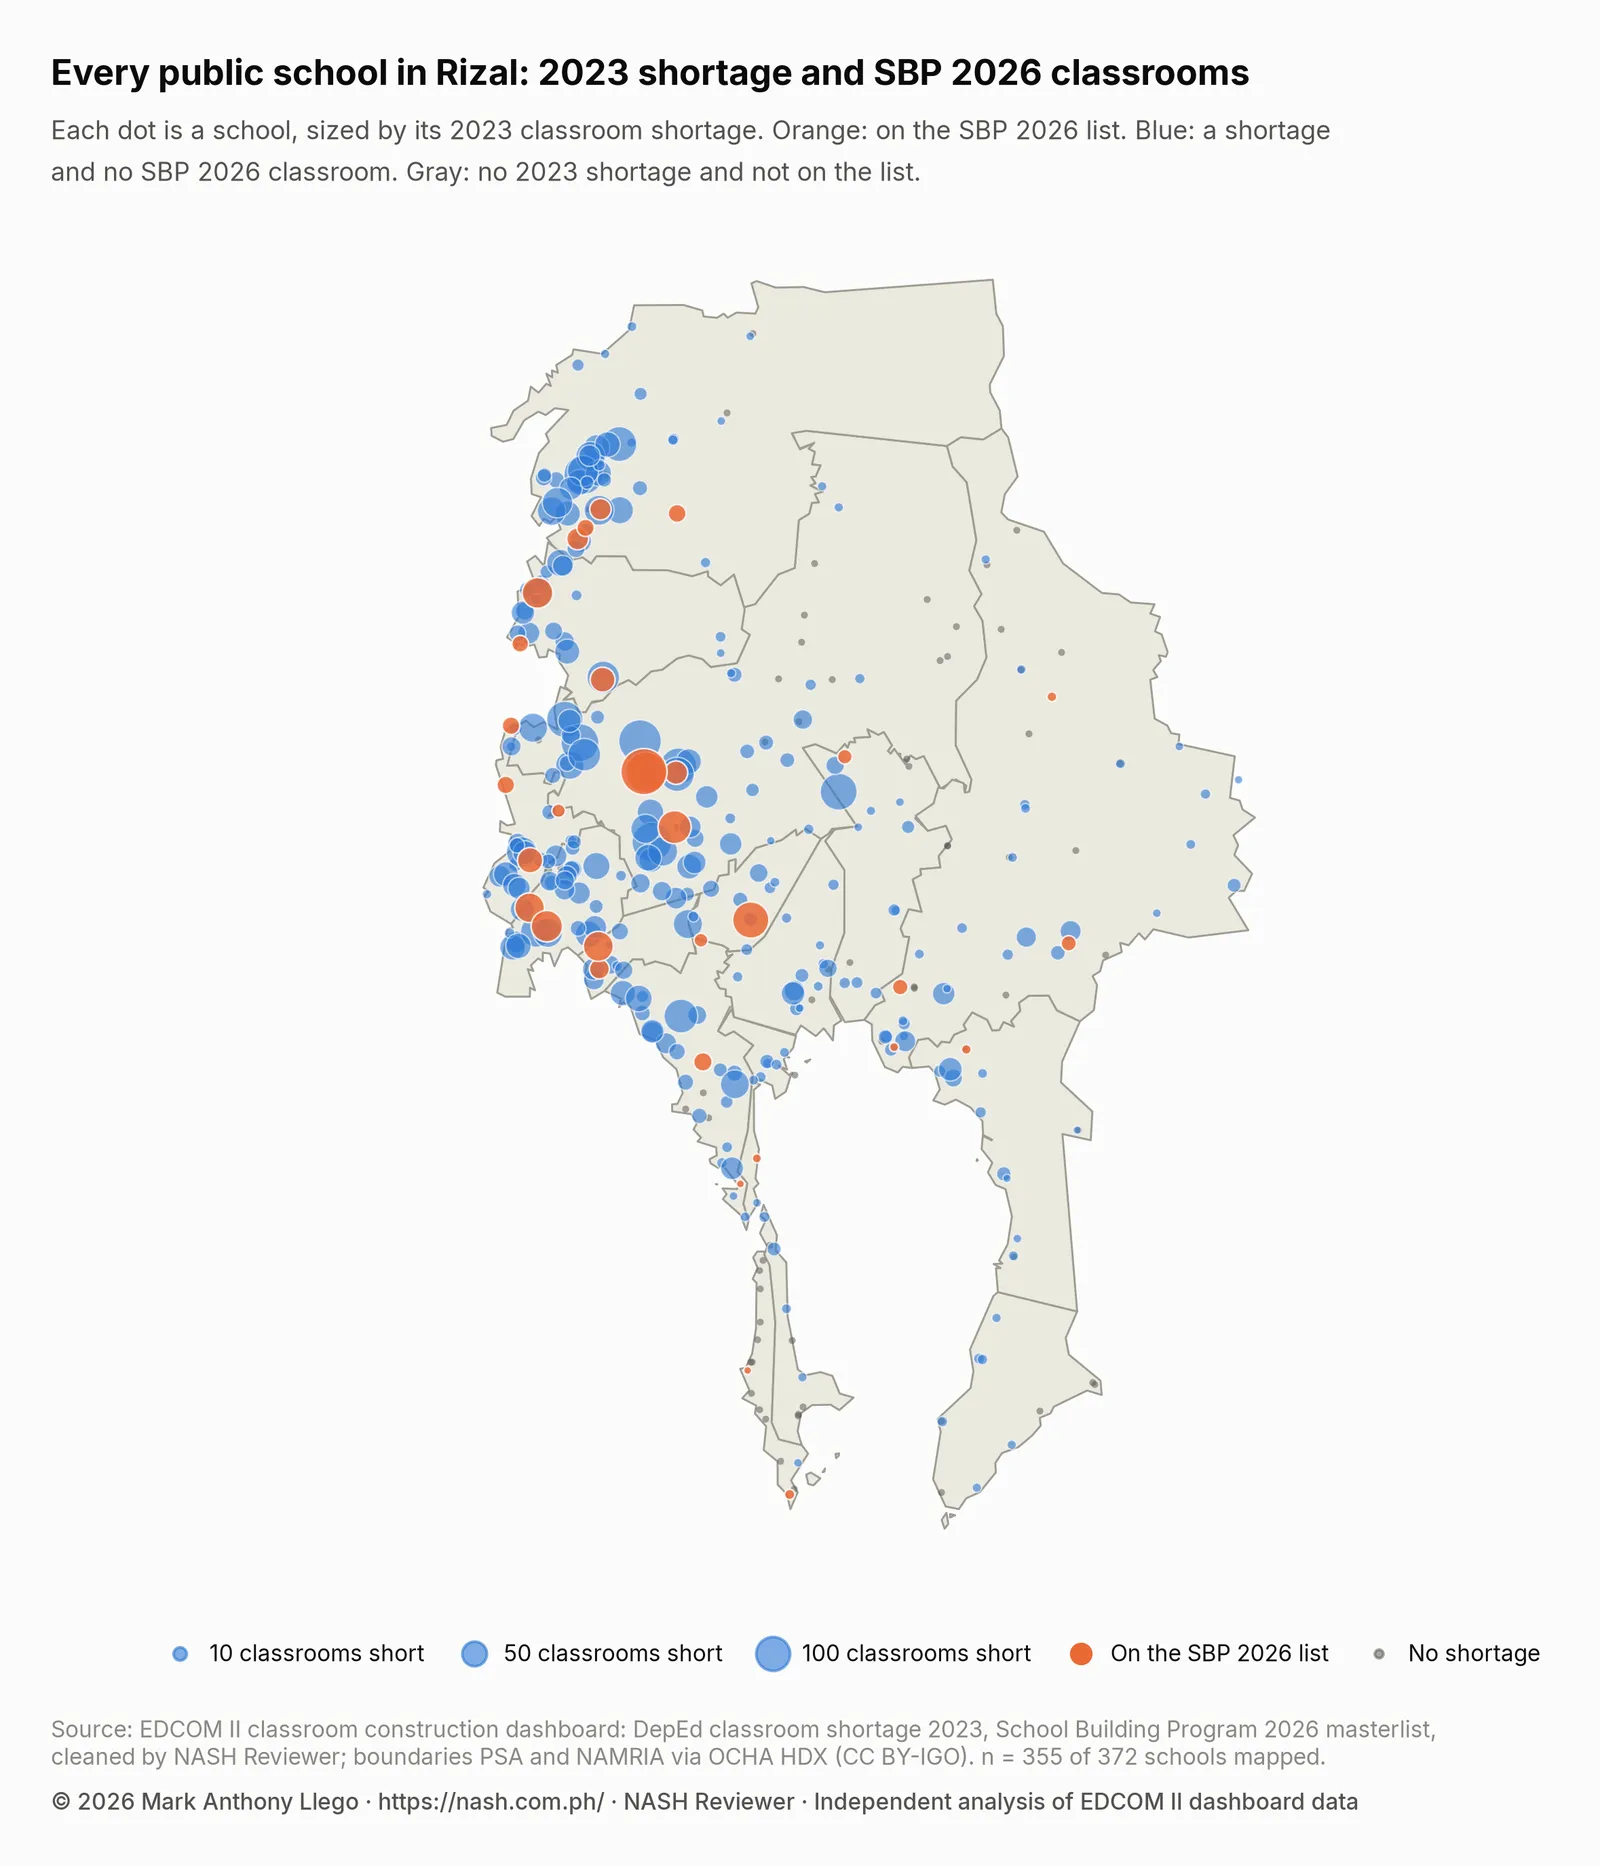
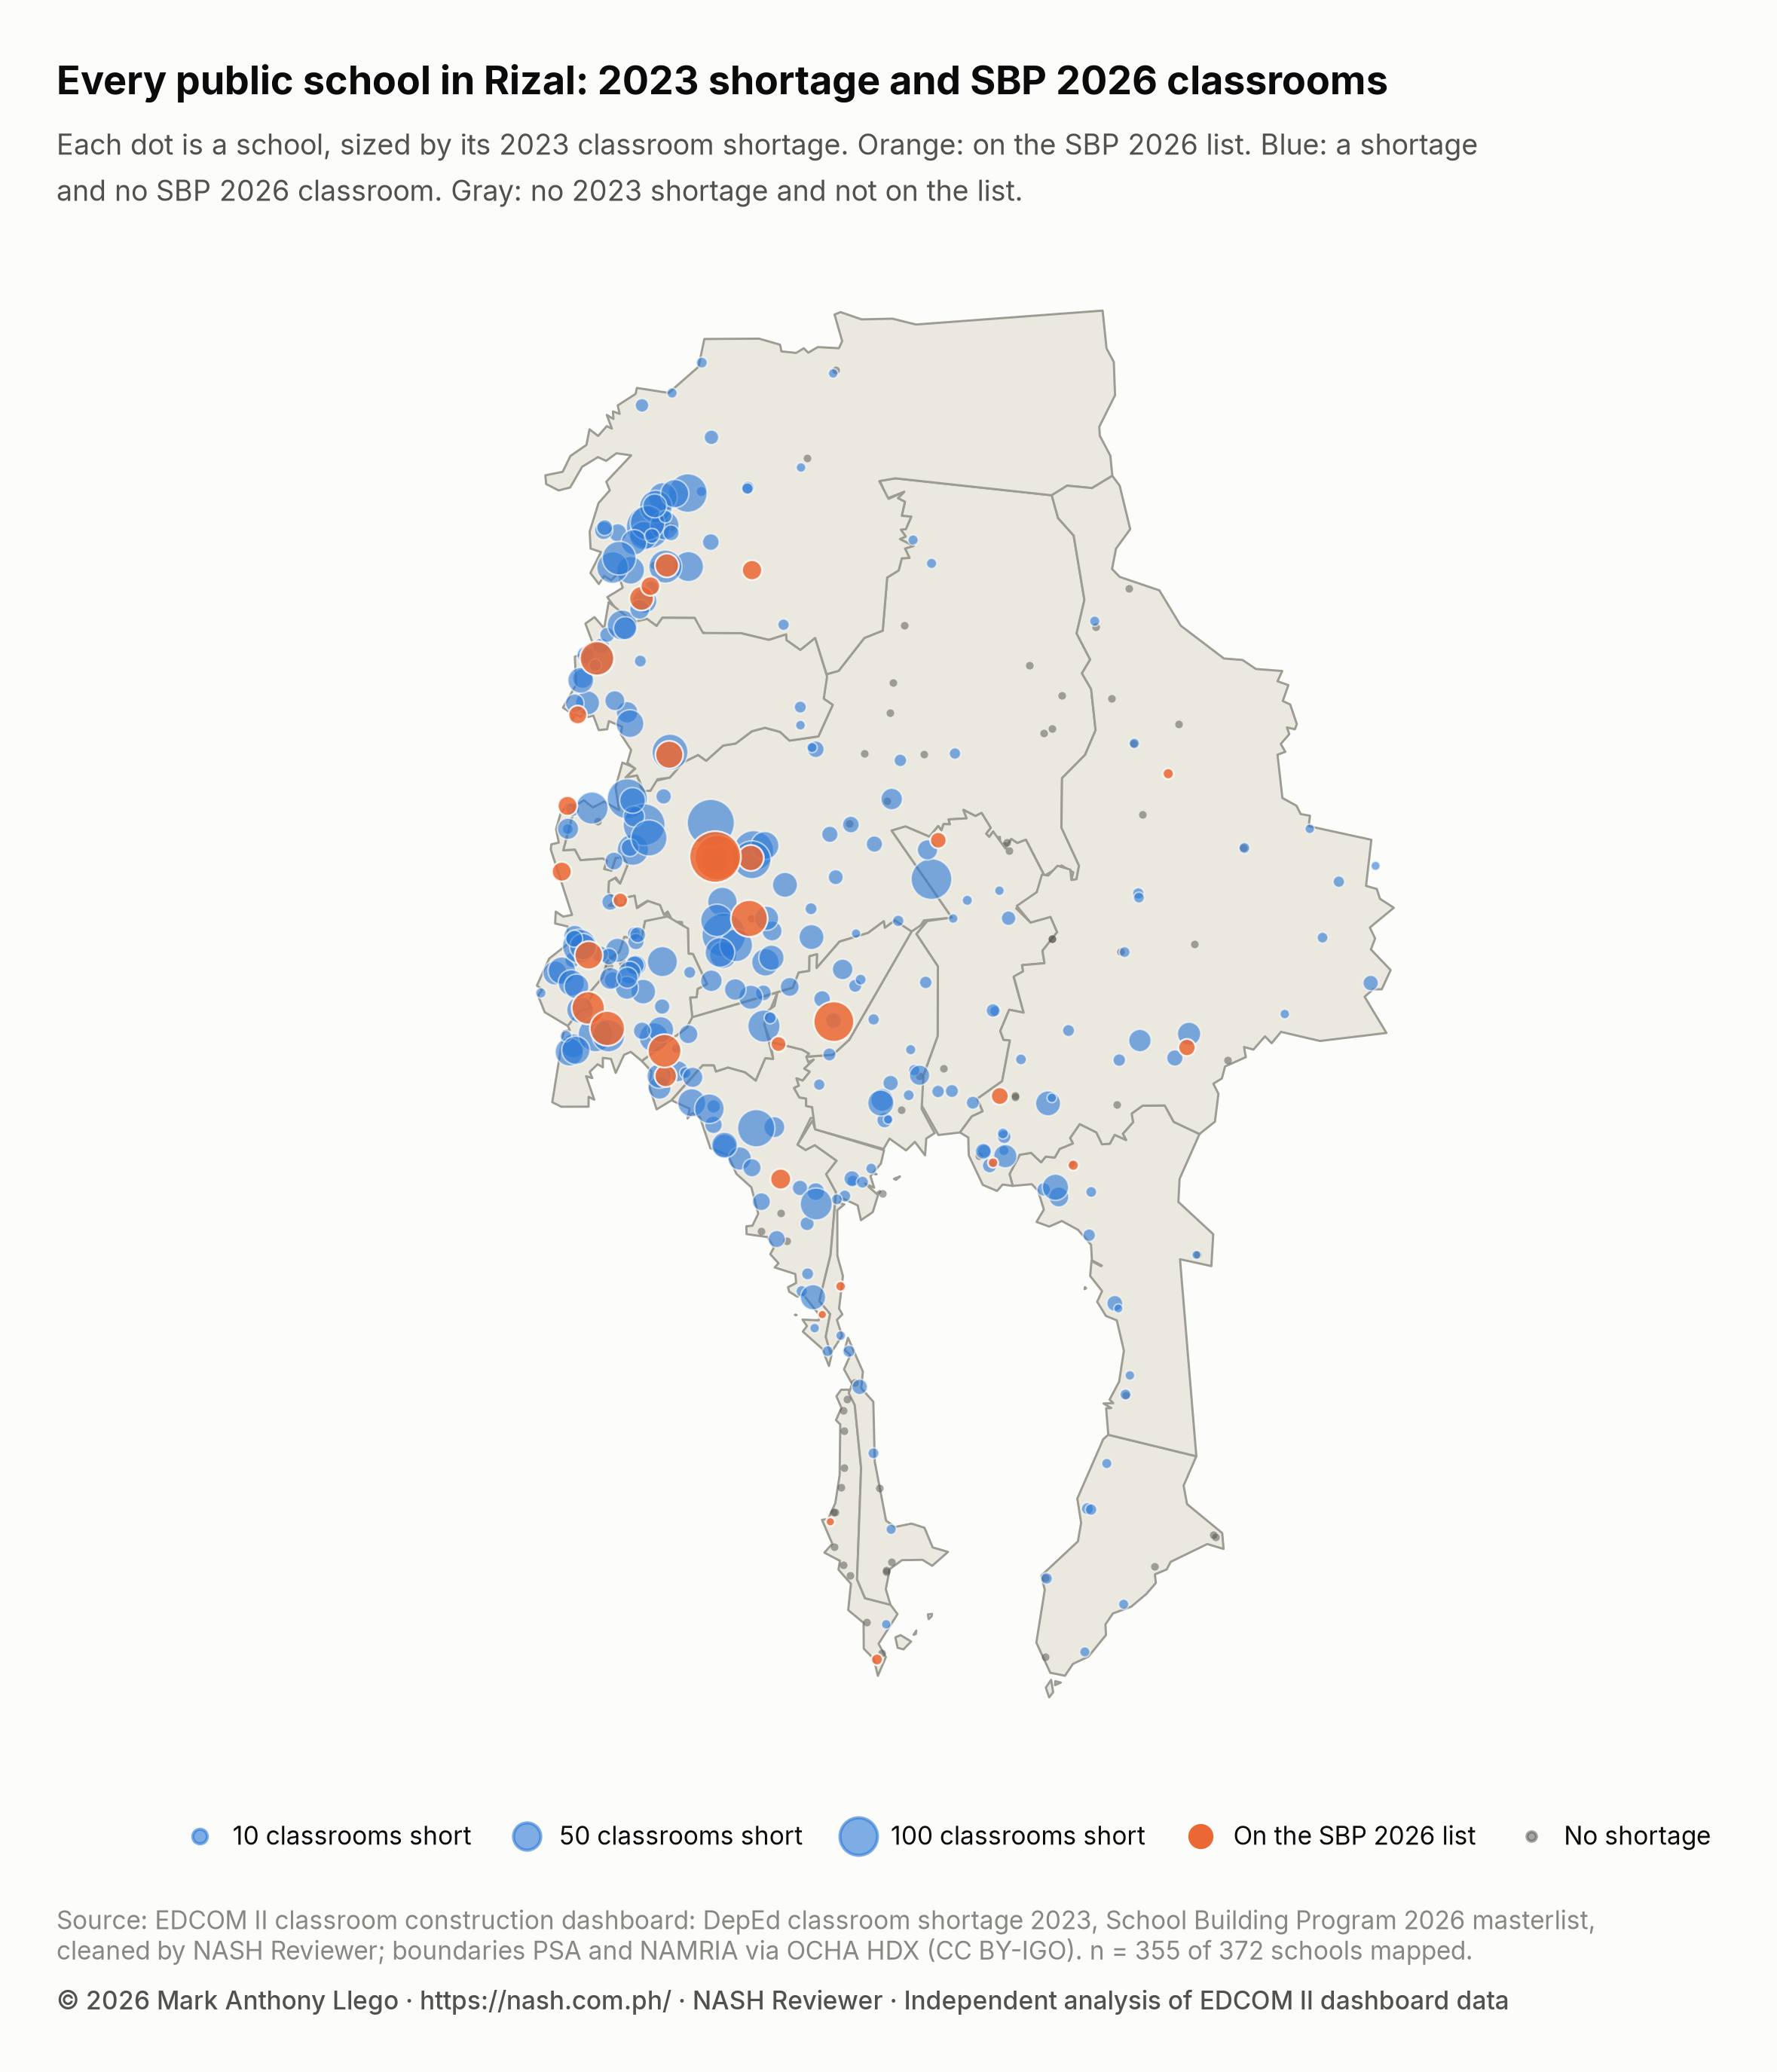
The shortage sits along the western edge, where Rodriguez, San Mateo, Antipolo, Cainta, Taytay, Angono and Binangonan meet Metro Manila and Laguna de Bay, and there the map is mostly blue. Orange dots appear among the large blue ones, but far fewer. The wide eastern uplands of Rodriguez and Tanay hold few schools, most with small shortages or none.
The SBP 2026 masterlist has 37 lines for Rizal, 314 classrooms at 35 schools, 1.0% of the national list. Of these, 102 are funded under the General Appropriations Act (GAA) 2026 with PHP 0.40 billion, and 212 are PSIP III classrooms: the third Public-Private Partnership for School Infrastructure Project, still for bidding, with construction expected from March 2027 to July 2028.
| Implementation modality | Lines | Schools | Classrooms | Share of the place’s SBP classrooms | Budget |
|---|---|---|---|---|---|
| PSIP III | 25 | 24 | 212 | 67.5% | For bidding |
| LGU - PROVINCE | 8 | 8 | 70 | 22.3% | PHP 0.29 billion |
| LGU - CITY | 1 | 1 | 16 | 5.1% | PHP 0.05 billion |
| DPWH | 3 | 3 | 16 | 5.1% | PHP 0.06 billion |
PSIP III carries two of every three classrooms on Rizal’s list, so most of them wait on a procurement not yet awarded. Of the funded lines, the provincial government implements 70 classrooms, more than the Department of Public Works and Highways (DPWH, 16) and the City of Antipolo (16) together. One PSIP III line, with 2 classrooms, exactly repeats an earlier line; the masterlist has 103 such lines, all PSIP III, and the totals here keep them, as the dashboard’s do. DepEd School Building Program 2026 in Numbers explains the modalities.
School by school, 266 of the 314 classrooms (84.7%) fall within the receiving school’s own 2023 shortage, against 53.0% nationally. Another 14 go beyond a listed school’s shortage, 10 (3.2%) go to two schools with no 2023 shortage, and 24 go to schools not in the 2023 shortage table. The list is precise, then, but small: it meets 3.1% of the shortage and leaves 8,249 classrooms unmet. The method is the one in Do 2026 Classrooms Go Where the Shortage Is?.
The 10 schools with the most SBP 2026 classrooms show how thinly the list is spread:
| School | City or municipality | Classroom shortage (2023) | SBP 2026 classrooms | Modality |
|---|---|---|---|---|
| Manggahan Elementary School | Rodriguez | 22 | 20 | PSIP III |
| Wawa Elementary School | Rodriguez | 36 | 18 | LGU - PROVINCE, PSIP III |
| Guitnangbayan ES | San Mateo | 82 | 16 | PSIP III |
| Camp Mateo Capinpin Elementary School | Tanay | 16 | 16 | PSIP III |
| Kaila Integrated School | City of Antipolo | No 2023 record | 16 | LGU - CITY |
| Sta. Cruz ES | City of Antipolo | 147 | 12 | PSIP III |
| Manuel I. Santos Integrated School | Taytay | 86 | 12 | PSIP III |
| Cainta Elementary School | Cainta | 54 | 12 | LGU - PROVINCE |
| San Isidro ES | City of Antipolo | 96 | 12 | PSIP III |
| Teresa National High School | Teresa | 117 | 12 | LGU - PROVINCE |
No Rizal school is listed for more than 20 classrooms. Manggahan Elementary School in Rodriguez, short 22, has the largest allocation, 20; Camp Mateo Capinpin Elementary School in Tanay is listed for exactly its shortage, 16. Most of the others receive a fraction of what they lack: 12 classrooms for Sta. Cruz ES, short 147, and for Teresa National High School, short 117.
Does the 2026 list favor Rizal’s largest shortages?
A list this small cannot cover the shortage, but it can still go first to the schools that lack the most. Two checks ask whether it does.
The first groups Rizal’s schools by the size of their 2023 shortage and gives the share in each group with any SBP 2026 classroom.
| 2023 classroom shortage | Schools | Schools with SBP 2026 classrooms | Share (95% interval) |
|---|---|---|---|
| None | 75 | 2 | 2.7% (0.7% to 9.2%) |
| 1 to 5 | 83 | 5 | 6.0% (2.6% to 13.3%) |
| Over 5 to 20 | 77 | 6 | 7.8% (3.6% to 16.0%) |
| Over 20 | 134 | 20 | 14.9% (9.9% to 21.9%) |
The share rises with the shortage, from 2.7% of schools with none to 14.9% of schools short more than 20, but even in that top band 20 of 134 schools receive anything. Each share comes with a 95% interval, the range of shares that fit the counts. With groups this small a share can move a lot from one or two schools, so the interval matters as much as the share: 2 of 75 is 2.7%, but anything from 0.7% to 9.2% fits. These are Wilson score intervals (Wilson, 1927), which stay accurate for small groups and for shares near zero, where the familiar plus-or-minus formula fails. The intervals for schools with no shortage (0.7% to 9.2%) and schools short more than 20 (9.9% to 21.9%) do not overlap, so that difference is more than the play of small numbers; the middle bands overlap their neighbors and cannot be told apart.
The second check uses every school’s exact shortage. Take the 294 schools with a shortage and split them in two: the 31 on the list and the 263 left off. The listed schools have a median shortage of 26.0 classrooms; the unlisted ones, 15.0. The Mann–Whitney test (Mann & Whitney, 1947) asks whether a gap like this could easily arise if listing had nothing to do with the size of a school’s shortage. It ranks all 294 schools from the smallest shortage to the largest and checks whether the listed schools’ ranks are higher than chance would give; using ranks keeps a few very large shortages from deciding the result. The p-value, 0.015, is the chance of a gap at least this large if listing ignored the shortage; below 0.05, by convention, chance is an unlikely explanation.
The size of the lean is the rank-biserial correlation (Kerby, 2014). Pair every listed school with every unlisted one: r is the share of pairs in which the listed school has the larger shortage minus the share in which it has the smaller. It runs from −1 to 1, and 0 means no lean. Rizal’s r is 0.27, a modest lean: listed schools have the larger shortage more often than not, but many unlisted schools lack more classrooms than listed ones, as Bagong Nayon I ES (161) and Juan Sumulong ES (138) show. Both checks compare Rizal’s schools with each other. They show how the 2026 list lines up with the 2023 shortage, not why each school was or was not listed.
Class shifts, crowding and buildings in Rizal
Shifts are common in Rizal. In SY 2024-25, 107 of the 371 schools in the enrollment data (28.8%) held classes in two or more shifts, against 13.7% in Region IV-A and 4.3% in the country, and those schools enroll 49.8% of Rizal’s learners. They include most of the largest shortages: 12 of the 15 schools with the largest shortages run shifts.
Crowding is just as plain. The median school has 43.7 learners per classroom in elementary, 49.8 in junior high and 37.9 in senior high, against 24.9, 32.1 and 30.6 nationally. In 164 schools there are more than 50 learners per classroom, and they hold 70.2% of the learners counted; bringing each down to 50 would take at least 3,337 classrooms, far more than the 314 on the 2026 list. Class Shifts and Crowded Classrooms in DepEd Schools explains the measure.
Makeshift rooms are uncommon: 24 schools (6.5%) report them in the 2023 facilities data, against 29.0% nationally. Buildings in poor condition are more common: 81 schools report a building for condemnation or demolition, 121 buildings in all. Only 21 schools (5.7%) are flagged as Last Mile Schools, schools in geographically isolated, disadvantaged and conflict-affected areas and hardship posts.
What this means for school heads in Rizal
In Rizal a school with a shortage typically lacks a building’s worth of rooms, and the 2026 list reaches about one such school in ten. The evidence a school brings matters.
- Find your school in the data. Look up your school ID in the school table for your 2023 shortage, learners per classroom, shifts and any SBP 2026 lines; the EDCOM II classroom data page links every file.
- Lead with shifts and crowding. Nearly half of Rizal’s learners are in schools that run two or more shifts, and 164 schools have more than 50 learners per classroom. Put your own shift schedule and learners per classroom beside your shortage in the school improvement plan.
- If your school is on the list, check the modality. Two of every three listed classrooms are PSIP III, still for bidding, so plan the annual implementation plan for the years before the rooms are ready.
- If it is not, keep the record current. 263 of the 294 schools with a shortage have no 2026 classroom. An accurate room count, enrollment and building condition, confirmed during Brigada Eskwela, is the evidence a later list can draw on.
- Talk to the province and the city. The provincial government implements 70 of Rizal’s funded classrooms, and the City of Antipolo 16. Morong and Jala-Jala have no 2026 classroom at all.
- Check figures that look wrong. A ratio such as 355.3 learners per classroom may mean rooms are missing from the 2023 count; raise it with the division before the data are used for planning.
How these numbers were made
The data are the cleaned tables behind the EDCOM II classroom construction dashboard: DepEd’s 2023 classroom shortage by school, the SBP 2026 masterlist, SY 2024-25 enrollment and class shifts from the Basic Education Information System (BEIS), 2023 school facilities, and school coordinates from the National School Building Inventory (NSBI) for SY 2022-23. How the EDCOM Classroom Data Was Cleaned documents every table and cleaning rule. The analysis was done in Python with pandas, SciPy and geopandas.
- The place. Rizal is the PSGC province, with the City of Antipolo. Its 369 schools in the 2023 shortage table give its shortage, rates and bands; its 372 schools in all, including those not in the 2023 shortage table, give its SBP classrooms. Cities and municipalities follow the PSGC.
- Rates, ranks and coverage. A school’s shortage is DepEd’s 2023 figure for Kindergarten to Grade 10 plus senior high school. The shortage per 1,000 learners divides the shortage of schools with SY 2024-25 learners by those learners and multiplies by 1,000. Ranks compare the 118 provinces and highly urbanized cities: by shortage, all of them; by rate, the 115 with 20,000 learners or more. Coverage is SBP 2026 classrooms divided by the 2023 shortage.
- School by school. At each school, classrooms within its shortage are the smaller of its SBP classrooms and its shortage, and classrooms beyond it are any SBP classrooms over the shortage. The unmet shortage is the shortage minus the classrooms within it, summed over schools.
- Mann–Whitney comparison. Among schools with a 2023 shortage, the shortages of the schools on the list and off it are compared with the two-sided Mann–Whitney U test (SciPy). The rank-biserial correlation is r = 2U ÷ (n₁ × n₂) − 1, where U is the test statistic for the listed schools and n₁ and n₂ are the two group sizes.
- Bands and intervals. Schools are grouped by their 2023 shortage (none, 1 to 5, over 5 to 20, over 20 classrooms), and each share has a 95% Wilson score interval.
- Crowding. Learners per classroom divide SY 2024-25 learners by 2023 instructional classrooms. For each school above 50, the classrooms needed are the rooms that would bring it to 50 learners per classroom, minus the rooms it has.
- The map. Schools are placed at their NSBI coordinates. Schools without coordinates, with coordinates more than 10 km from their barangay’s center, or with coordinates outside the province’s frame are left off, which is why 355 of the 372 schools appear.
Limits
The sources span several years: the shortage and facilities are from 2023, enrollment and shifts from SY 2024-25, coordinates from SY 2022-23 and the allocations from 2026, so a school’s figures may have changed since. The SBP list shows planned classrooms, not finished ones, and two of every three of Rizal’s are PSIP III, still for bidding. The shortage is DepEd’s own estimate, and new, merged or renumbered schools may be missing or counted under a new ID; some learners-per-classroom figures rest on room counts worth checking.
The Mann–Whitney test and the Wilson intervals treat Rizal’s schools as if they were drawn by chance, but they are every school in the province, not a sample. Read them as a check on whether the lean toward larger shortages is larger than a list of this length could show by chance, not as sampling error. With 31 schools on the list, the test can find a clear lean but not measure it finely. All of these are associations: they show where the shortage and the 2026 classrooms are, not why a school was or was not listed.
Frequently asked questions
How big is the classroom shortage in Rizal?
DepEd’s 2023 data put the shortage in Rizal province, with the City of Antipolo, at 8,516 classrooms, 5.1% of the national shortage of 165,443 and the second largest of any province or highly urbanized city, after Cavite. That is 13.5 classrooms per 1,000 learners, against 7.4 nationally, and 79.7% of its public schools have a shortage.
Which city or town in Rizal has the biggest classroom shortage?
The City of Antipolo, short 2,663 classrooms, 31.3% of the province’s shortage, followed by Rodriguez with 1,462. By rate, San Mateo is highest at 15.9 classrooms per 1,000 learners, with Rodriguez and Cainta at 15.6.
How many SBP 2026 classrooms will Rizal get?
The SBP 2026 masterlist has 314 classrooms for Rizal on 37 lines at 35 schools: 102 funded under the GAA 2026 with PHP 0.40 billion and 212 PSIP III classrooms still for bidding. They equal 3.7% of the 2023 shortage, against 19.6% nationally. The list is a plan; it does not mean the classrooms are built.
Which school in Rizal has the largest classroom shortage?
Antipolo National High School in the City of Antipolo, short 193 classrooms in 2023 for 11,435 learners in SY 2024-25. It has eight classrooms on the SBP 2026 list. Bagong Nayon I ES, also in Antipolo, is next at 161, with none.
Download the data and cite this post
The cleaned EDCOM II classroom data behind this series are free to download for personal study; to reuse them, email support@nash.com.ph for written permission first. How the EDCOM Classroom Data Was Cleaned explains every table and cleaning rule. The files are at data.nash.com.ph: start with the README, then the school table (Parquet, or CSV), the School Building Program lines (CSV), the city and municipality table (CSV), and every table for Stata and SPSS. Every figure in this post can be computed from the school table, filtered to Rizal by province, with the School Building Program lines matched to it by school_id.
Every file, with its rows, columns and checksum, is listed on the EDCOM II classroom data page. To cite the data: Llego, M. A. (2026). EDCOM II classroom construction dashboard data, cleaned, version 1.1. NASH Reviewer. https://nash.com.ph/edcom-classroom-data
To cite this post: Llego, M. A. (2026, October 28). Classroom shortage in Rizal and Antipolo, 2023–2026. NASH Reviewer Blog. https://nash.com.ph/blog/classroom-shortage-rizal
References
- Kerby, D. S. (2014). The simple difference formula: An approach to teaching nonparametric correlation. Comprehensive Psychology, 3.
- Llego, M. A. (2026). EDCOM II classroom construction dashboard data, cleaned, version 1.1 [Data set]. NASH Reviewer. https://nash.com.ph/edcom-classroom-data
- Mann, H. B., & Whitney, D. R. (1947). On a test of whether one of two random variables is stochastically larger than the other. Annals of Mathematical Statistics, 18(1), 50–60.
- Wilson, E. B. (1927). Probable inference, the law of succession, and statistical inference. Journal of the American Statistical Association, 22(158), 209–212.
More in this series
- How the EDCOM Classroom Data Was Cleaned
- Philippine Classroom Shortage 2023: Where the Gap Is
- DepEd School Building Program 2026 in Numbers
- Do 2026 Classrooms Go Where the Shortage Is?
- Classroom Allocation by LGU Income Class, 2026
- Class Shifts and Crowded Classrooms in DepEd Schools
- Last Mile Schools: Classroom Need and 2026 Allocation
- Regional reports: NCR, CAR, Region I, Region II, Region III, Region IV-A, MIMAROPA, Region V, Region VI, NIR, Region VII, Region VIII, Region IX, Region X, Region XI, Region XII, Caraga, BARMM
- Rankings and deep dives: Congressional districts, Top 20 cities and municipalities, Rizal, Quezon City, City of Manila, Tawi-Tawi, Cavite, Cost of a classroom
- Explainers: PSIP III, Senior high shortage, Junior high shortage, Excess classrooms, Learning Continuity Spaces, How learners reach school
- For teachers and school heads: Action research and thesis topics
- Related: CRLA Results SY 2025-26 in Region IV-A: Counts vs Rates, DepEd Classroom and School Building Data, SY 2023-2024, DepEd School Improvement Plan (SIP): Steps, AIP and SRC, How to Read DepEd Data: A Guide for Aspiring School Heads
Analysis and charts by Mark Anthony Llego for NASH Reviewer. Data: EDCOM II classroom construction dashboard and Department of Education data. NASH Reviewer is not affiliated with EDCOM II or DepEd. Charts may be reused only with written permission from support@nash.com.ph.