MIMAROPA, the island region of Occidental Mindoro, Oriental Mindoro, Marinduque, Romblon and Palawan (formerly Region IV-B, often searched as Region 4B), lacked 4,777 classrooms in 2023, according to DepEd’s classroom shortage data as published in the EDCOM II classroom construction dashboard. That is 2.9% of the national shortage of 165,443 classrooms and the 12th largest of the 18 regions. For every 1,000 learners enrolled in SY 2024-25, the region is short 6.0 classrooms, below the national rate of 7.4 and the 11th highest among the regions.
What sets MIMAROPA apart is its School Building Program (SBP) 2026 list. It holds 1,696 classrooms for the region, equal to 35.5% of the shortage against 19.6% nationally, but 1,061 of them are PSIP III public-private partnership classrooms that are still for bidding. The list is also uneven across the islands. Occidental Mindoro, with the region’s highest shortage rate, 7.7 per 1,000 learners, has classrooms for 12.9% of its shortage, while Calapan City has 76.3%. And about a quarter of the region’s schools (24.7%) are Last Mile Schools, well above the national 18.5%, yet only 5.1% of them get a 2026 classroom.
The figures below come from the cleaned school-level data behind the dashboard. Every file is listed on the EDCOM II classroom data page.
Key findings
- MIMAROPA lacked 4,777 classrooms in 2023, 6.0 for every 1,000 learners against 7.4 nationally, and 1,249 of its 2,377 public schools (52.5%) had a shortage.
- Occidental Mindoro has both the highest shortage rate of the seven divisions, 7.7 classrooms per 1,000 learners, and the lowest SBP 2026 coverage, 12.9%; Marinduque has the lowest rate, 2.7.
- The SBP 2026 list holds 1,696 classrooms for the region, 5.2% of the national list against the region’s 2.9% of the shortage, and 1,061 of them (62.6%) are PSIP III classrooms with no budget yet.
- Eight of the 10 schools with the largest shortages are on the 2026 list, and 34 of the 60 schools short by more than 10 classrooms (56.7%) receive at least one.
- Last Mile Schools make up 24.7% of the region’s schools, against 18.5% nationally, but only 5.1% of them get an SBP 2026 classroom, against 13.2% of the region’s other schools.
- Class shifts are rare: 23 schools (1.0%) held classes in two or more shifts in SY 2024-25, against 4.3% nationally.
MIMAROPA against the country
The table puts the region’s main indicators beside the national figures, each defined the same way in both columns.
| Indicator | MIMAROPA | Philippines |
|---|---|---|
| Schools in the 2023 shortage data | 2,377 | 47,659 |
| Schools with a classroom shortage | 52.5% | 54.2% |
| Classroom shortage (2023) | 4,777 | 165,443 |
| Shortage per 1,000 learners | 6.0 | 7.4 |
| SBP 2026 classrooms | 1,696 | 32,419 |
| SBP 2026 classrooms as a share of the shortage | 35.5% | 19.6% |
| Schools with a shortage that get any SBP 2026 classroom | 16.7% | 13.3% |
| Schools with two or more shifts (SY 2024-25) | 1.0% | 4.3% |
| Median learners per classroom, elementary | 24.6 | 24.9 |
| Last Mile Schools | 24.7% | 18.5% |
| Schools using makeshift rooms (2023) | 34.1% | 29.0% |
| Schools with a building for condemnation or demolition | 21.4% | 28.9% |
MIMAROPA sits near the country on the share of schools with a shortage and on elementary crowding. It differs most on three rows: its 2026 list equals 35.5% of its shortage, nearly twice the national 19.6%; only 1.0% of its schools run shifts, against 4.3%; and 24.7% are Last Mile Schools, against 18.5%. More of its schools use makeshift rooms (34.1% against 29.0%), and fewer report a building for condemnation (21.4% against 28.9%).
Kindergarten to Grade 10 accounts for 4,189 classrooms of the shortage and senior high school for 589, or 12.3%. Unlike the country, where urban schools carry 60.2% of the shortage, most of MIMAROPA’s is rural: its 1,883 rural schools hold 55.9% and its 492 urban schools 44.1%. Per learner, urban schools still lack more, 6.8 classrooms per 1,000 against 5.5 in rural schools. At the same time, 812 schools report 2,378 more Kindergarten to Grade 10 classrooms than they need; a spare room in one school does not reduce another school’s shortage.
Classroom shortage by division in MIMAROPA
MIMAROPA has seven schools divisions: one for each of its five provinces and two city divisions, Puerto Princesa City and Calapan City. The chart ranks them by the shortage per 1,000 learners, so a large provincial division and a small city division can be compared.
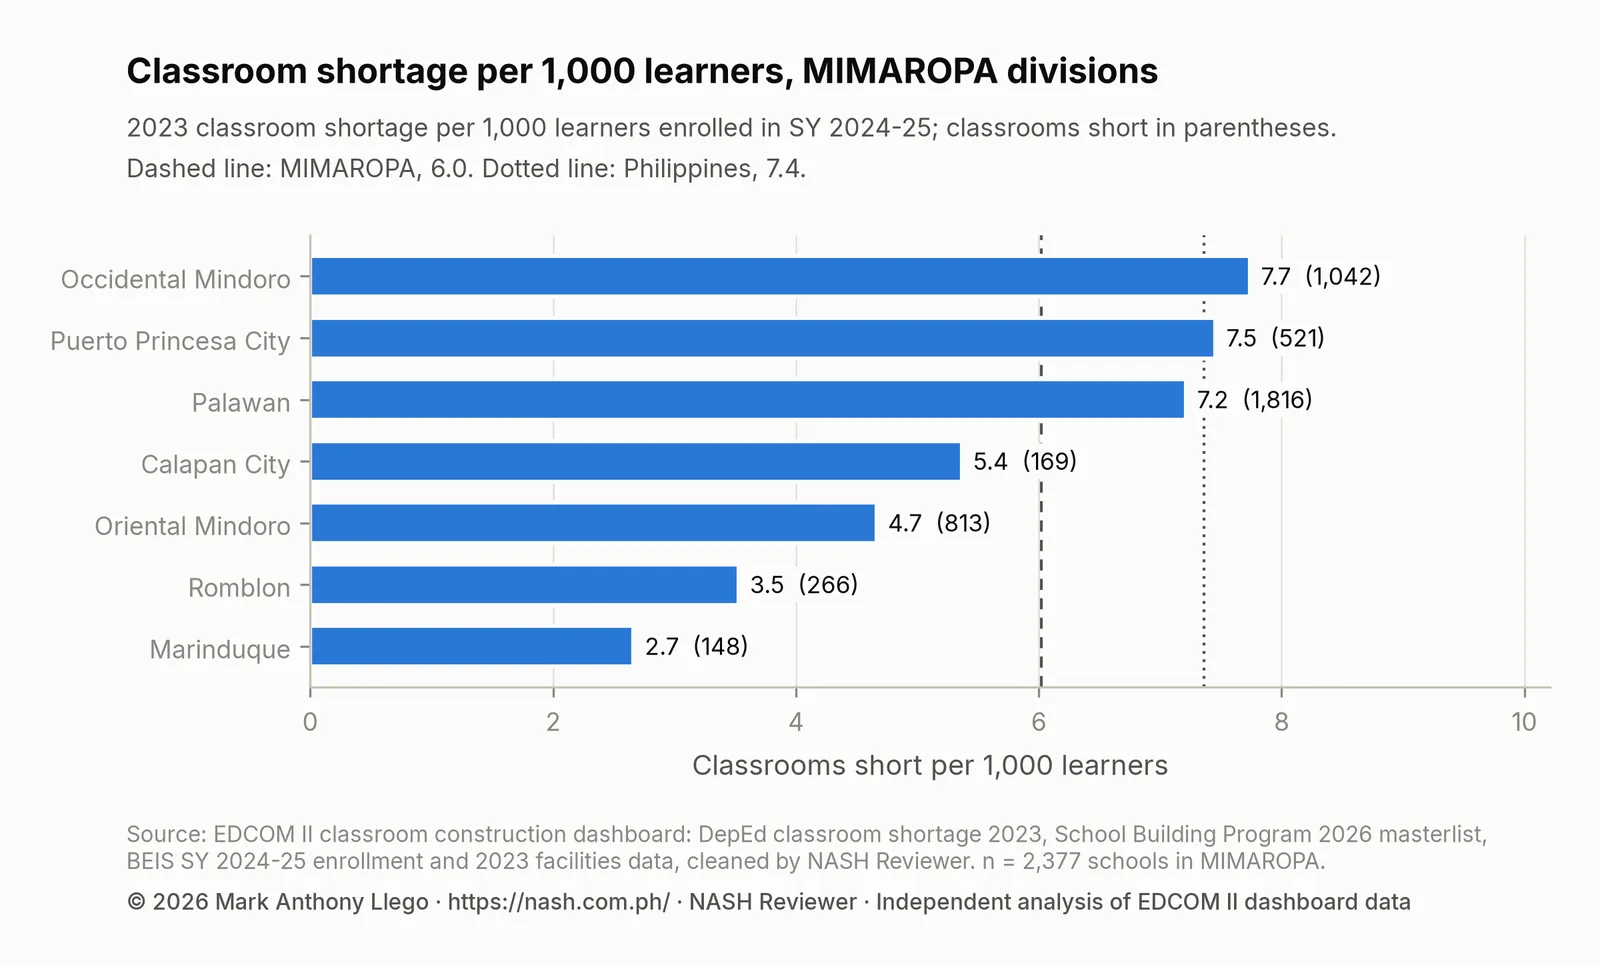
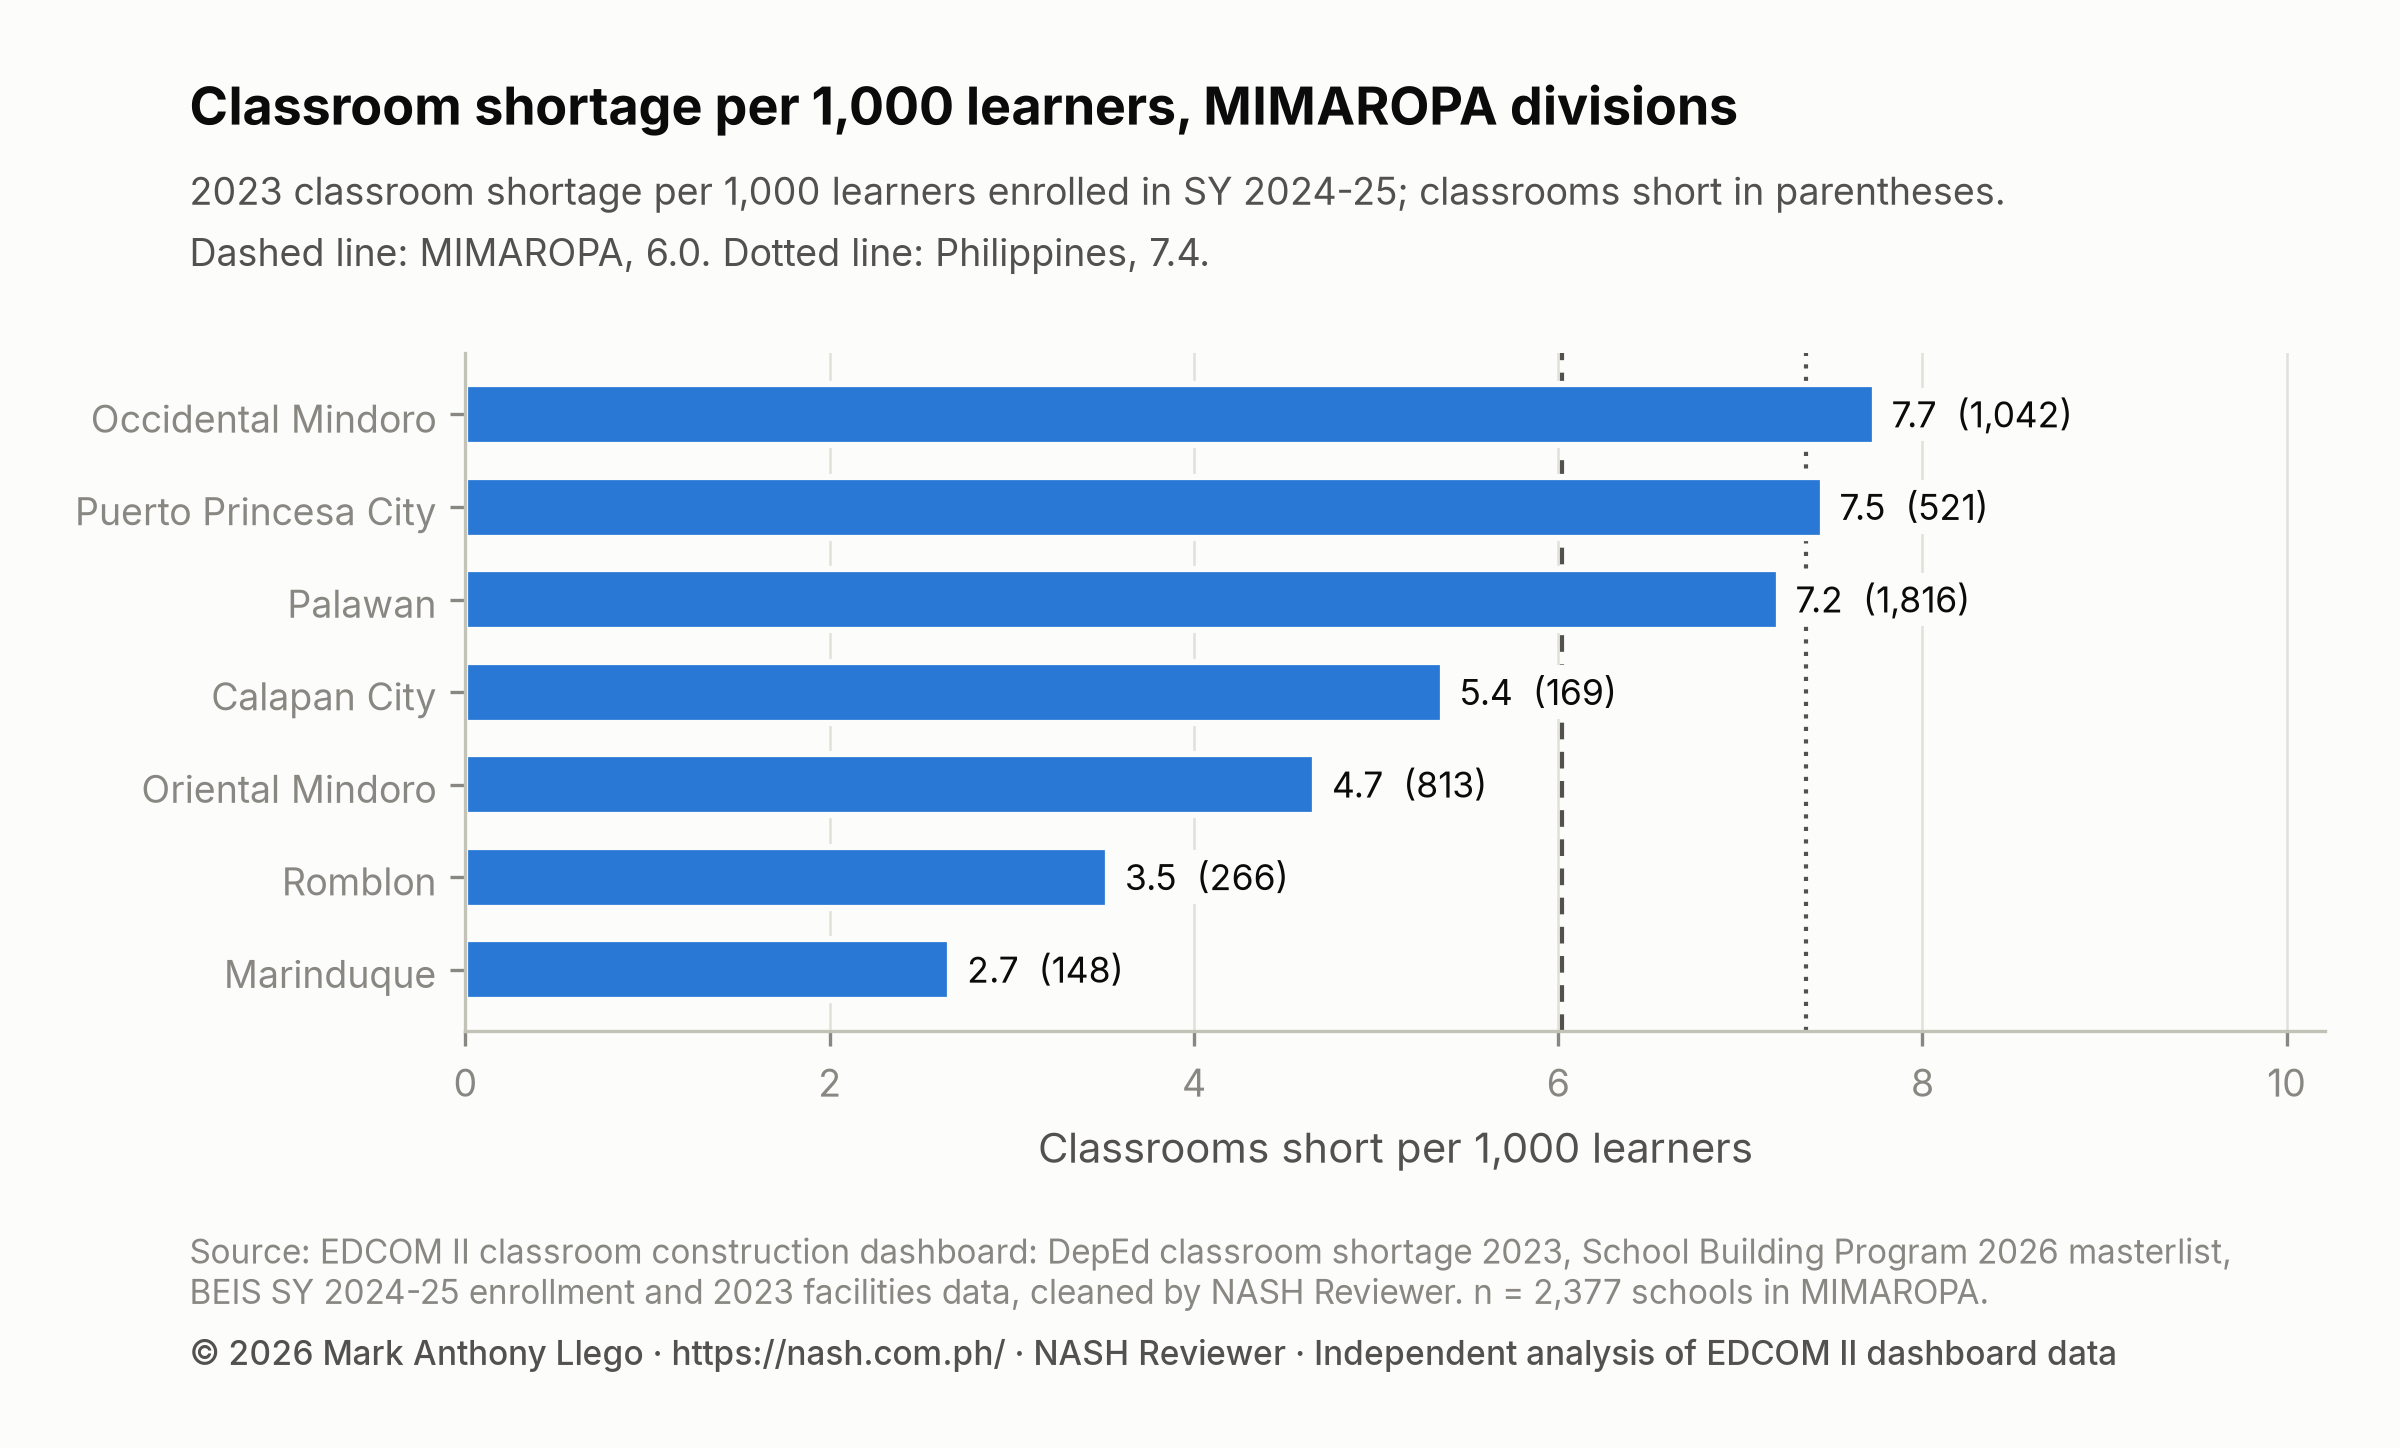
The chart splits the region in two. Occidental Mindoro and the two Palawan divisions are above the regional rate, and Occidental Mindoro (7.7) and Puerto Princesa City (7.5) are the only two divisions above the national rate. Oriental Mindoro, Calapan City, Romblon and Marinduque sit well below it; Marinduque’s 2.7 is about a third of Occidental Mindoro’s rate.
By count, Palawan leads. The provincial division is short 1,816 classrooms, 38.0% of the region’s, and Occidental Mindoro comes second with 1,042, on about half of Palawan’s enrollment.
| Division | Schools | Learners (SY 2024-25) | Classroom shortage (2023) | Shortage per 1,000 learners | Schools with a shortage | SBP 2026 classrooms | Coverage |
|---|---|---|---|---|---|---|---|
| Occidental Mindoro | 363 | 134,718 | 1,042 | 7.7 | 70.2% | 134 | 12.9% |
| Puerto Princesa City | 101 | 69,851 | 521 | 7.5 | 64.4% | 225 | 43.1% |
| Palawan | 819 | 251,911 | 1,816 | 7.2 | 62.0% | 632 | 34.8% |
| Calapan City | 58 | 31,488 | 169 | 5.4 | 60.3% | 129 | 76.3% |
| Oriental Mindoro | 538 | 174,349 | 813 | 4.7 | 47.4% | 299 | 36.8% |
| Romblon | 269 | 75,485 | 266 | 3.5 | 27.9% | 185 | 69.5% |
| Marinduque | 229 | 55,767 | 148 | 2.7 | 24.5% | 78 | 52.5% |
In Occidental Mindoro, 70.2% of schools have a shortage; in Marinduque, 24.5% do. Coverage, the division’s SBP 2026 classrooms as a share of its shortage, runs from 12.9% in Occidental Mindoro to 76.3% in Calapan City, and every other division has classrooms for at least a third of its shortage. The division totals leave out 14 SBP classrooms at three schools that have no division in the data; the regional totals include them.
Provinces and cities: Palawan, Mindoro, Romblon and Marinduque
The Philippine Standard Geographic Code (PSGC) places MIMAROPA’s schools in five provinces and one highly urbanized city, Puerto Princesa, which stands apart from Palawan. Calapan, a component city, is counted inside Oriental Mindoro here, although it has its own schools division.
| Province or city | Cities and municipalities | Schools | Classroom shortage (2023) | Shortage per 1,000 learners | SBP 2026 classrooms | Coverage |
|---|---|---|---|---|---|---|
| Palawan | 23 | 819 | 1,816 | 7.2 | 635 | 35.0% |
| Occidental Mindoro | 11 | 363 | 1,042 | 7.7 | 134 | 12.9% |
| Oriental Mindoro | 15 | 596 | 982 | 4.8 | 428 | 43.6% |
| City of Puerto Princesa | 1 | 101 | 521 | 7.5 | 227 | 43.5% |
| Romblon | 17 | 269 | 266 | 3.5 | 185 | 69.5% |
| Marinduque | 6 | 229 | 148 | 2.7 | 87 | 58.6% |
The two Mindoro provinces are short about the same number of classrooms, 1,042 in Occidental Mindoro and 982 in Oriental Mindoro with Calapan, but Oriental Mindoro has 428 on the 2026 list and Occidental Mindoro 134. Palawan, without Puerto Princesa, holds 1,816 classrooms of shortage and 635 SBP classrooms (35.0%). Province totals include classrooms at schools with no division, so Palawan’s 635 and Marinduque’s 87 are a little above their divisions’ 632 and 78.
Among the region’s 73 cities and municipalities, the City of Puerto Princesa has the largest shortage, 521 classrooms. Five of the 10 largest are Palawan municipalities:
| City or municipality | Province or city | Income class | Schools | Classroom shortage (2023) | SBP 2026 classrooms | Coverage |
|---|---|---|---|---|---|---|
| City of Puerto Princesa | City of Puerto Princesa | 1st | 103 | 521 | 227 | 43.5% |
| San Jose | Occidental Mindoro | 1st | 83 | 256 | 30 | 11.7% |
| Bataraza | Palawan | 1st | 56 | 231 | 57 | 24.6% |
| Sablayan | Occidental Mindoro | 1st | 57 | 228 | 40 | 17.6% |
| City of Calapan | Oriental Mindoro | 2nd | 59 | 169 | 129 | 76.3% |
| Brooke’s Point | Palawan | 1st | 50 | 158 | 34 | 21.5% |
| Narra | Palawan | 1st | 48 | 157 | 25 | 15.9% |
| Coron | Palawan | 1st | 48 | 153 | 93 | 60.7% |
| Bulalacao | Oriental Mindoro | 1st | 53 | 148 | 30 | 20.2% |
| Balabac | Palawan | 1st | 45 | 144 | 3 | 2.1% |
Within Palawan the spread is wide: Coron, short 153, has 93 classrooms on the list (60.7%), while Balabac, short 144, has three (2.1%). San Jose and Sablayan, Occidental Mindoro’s two largest municipalities by shortage, are both below 20% coverage. Seven cities and municipalities with a shortage, 87 classrooms between them, have no SBP 2026 classroom; the largest of these is Paluan, Occidental Mindoro, short 50. Four receive more classrooms than their shortage, 52 beyond it in all. The city table follows the PSGC and the masterlist’s own municipality, so the City of Puerto Princesa shows 227 SBP classrooms and the Puerto Princesa City division 225; the city’s figure includes a school with no division in the data.
Schools with the largest classroom shortages in MIMAROPA
The 10 schools with the largest shortages are mostly large high schools, five of them in Puerto Princesa City. Together they are short 555 classrooms, 11.6% of the region’s shortage. The school ID identifies each one in the school table.
| School ID | School | Division | City or municipality | Learners (SY 2024-25) | Learners per classroom | Classroom shortage (2023) | SBP 2026 classrooms | Two or more shifts |
|---|---|---|---|---|---|---|---|---|
| 330506 | Santa Monica National High School | Puerto Princesa City | City of Puerto Princesa | 4,056 | 104.0 | 74 | 20 | Yes |
| 301800 | Oriental Mindoro National High School | Calapan City | City of Calapan | 7,434 | 51.3 | 72 | 16 | Yes |
| 309301 | PALAWAN NATIONAL SCHOOL | Puerto Princesa City | City of Puerto Princesa | 9,701 | 45.1 | 66 | 40 | Yes |
| 301596 | Sablayan National Comprehensive High School | Occidental Mindoro | Sablayan | 4,454 | 85.7 | 64 | 4 | Yes |
| 301593 | Occidental Mindoro NHS | Occidental Mindoro | Mamburao | 5,744 | 53.2 | 62 | 0 | Yes |
| 301793 | San Jose NHS | Puerto Princesa City | City of Puerto Princesa | 4,431 | 79.1 | 61 | 0 | Yes |
| 301599 | San Jose NHS | Occidental Mindoro | San Jose | 3,722 | 186.1 | 46 | 15 | Yes |
| 111492 | Sicsican Elementary School | Puerto Princesa City | City of Puerto Princesa | 2,405 | 72.9 | 43 | 20 | Yes |
| 502210 | Narra Integrated School | Palawan | Narra | 4,569 | 48.6 | 34 | 11 | No |
| 111495 | Sta. Monica ES | Puerto Princesa City | City of Puerto Princesa | 2,928 | 61.0 | 33 | 20 | Yes |
Santa Monica National High School in Puerto Princesa City has the largest shortage in the region, 74 classrooms, at 104.0 learners per classroom. The most crowded school in the table is San Jose NHS in San Jose, Occidental Mindoro, at 186.1 learners per classroom; another school with the same name, in Puerto Princesa City, is also in the table, and the school ID tells them apart. All but Narra Integrated School hold classes in shifts.
Eight of the 10 are on the SBP 2026 list, from four classrooms at Sablayan National Comprehensive High School to 40 at PALAWAN NATIONAL SCHOOL. The two left out are Occidental Mindoro NHS in Mamburao, short 62, and San Jose NHS in Puerto Princesa City, short 61.
Across all schools, the shortage is less concentrated than the country’s. The 238 schools with the largest shortages, the top 10% of the region’s schools, hold 54.8% of it, against 66.0% nationally; 195 schools (8.2%) hold half, and the 70 schools short by 10 or more classrooms hold 31.4%. Among schools with a shortage, the median is 2.0 classrooms. Philippine Classroom Shortage 2023: Where the Gap Is explains these concentration measures.
SBP 2026 classrooms in MIMAROPA
The SBP 2026 list has 305 lines for MIMAROPA, 1,696 classrooms at 270 schools. Only 635 of them are funded under the General Appropriations Act (GAA) 2026, with PHP 2.01 billion. The other 1,061 belong to PSIP III, the third Public-Private Partnership for School Infrastructure Project, which is still for bidding, with construction expected from March 2027 to July 2028; its lines carry no budget yet.
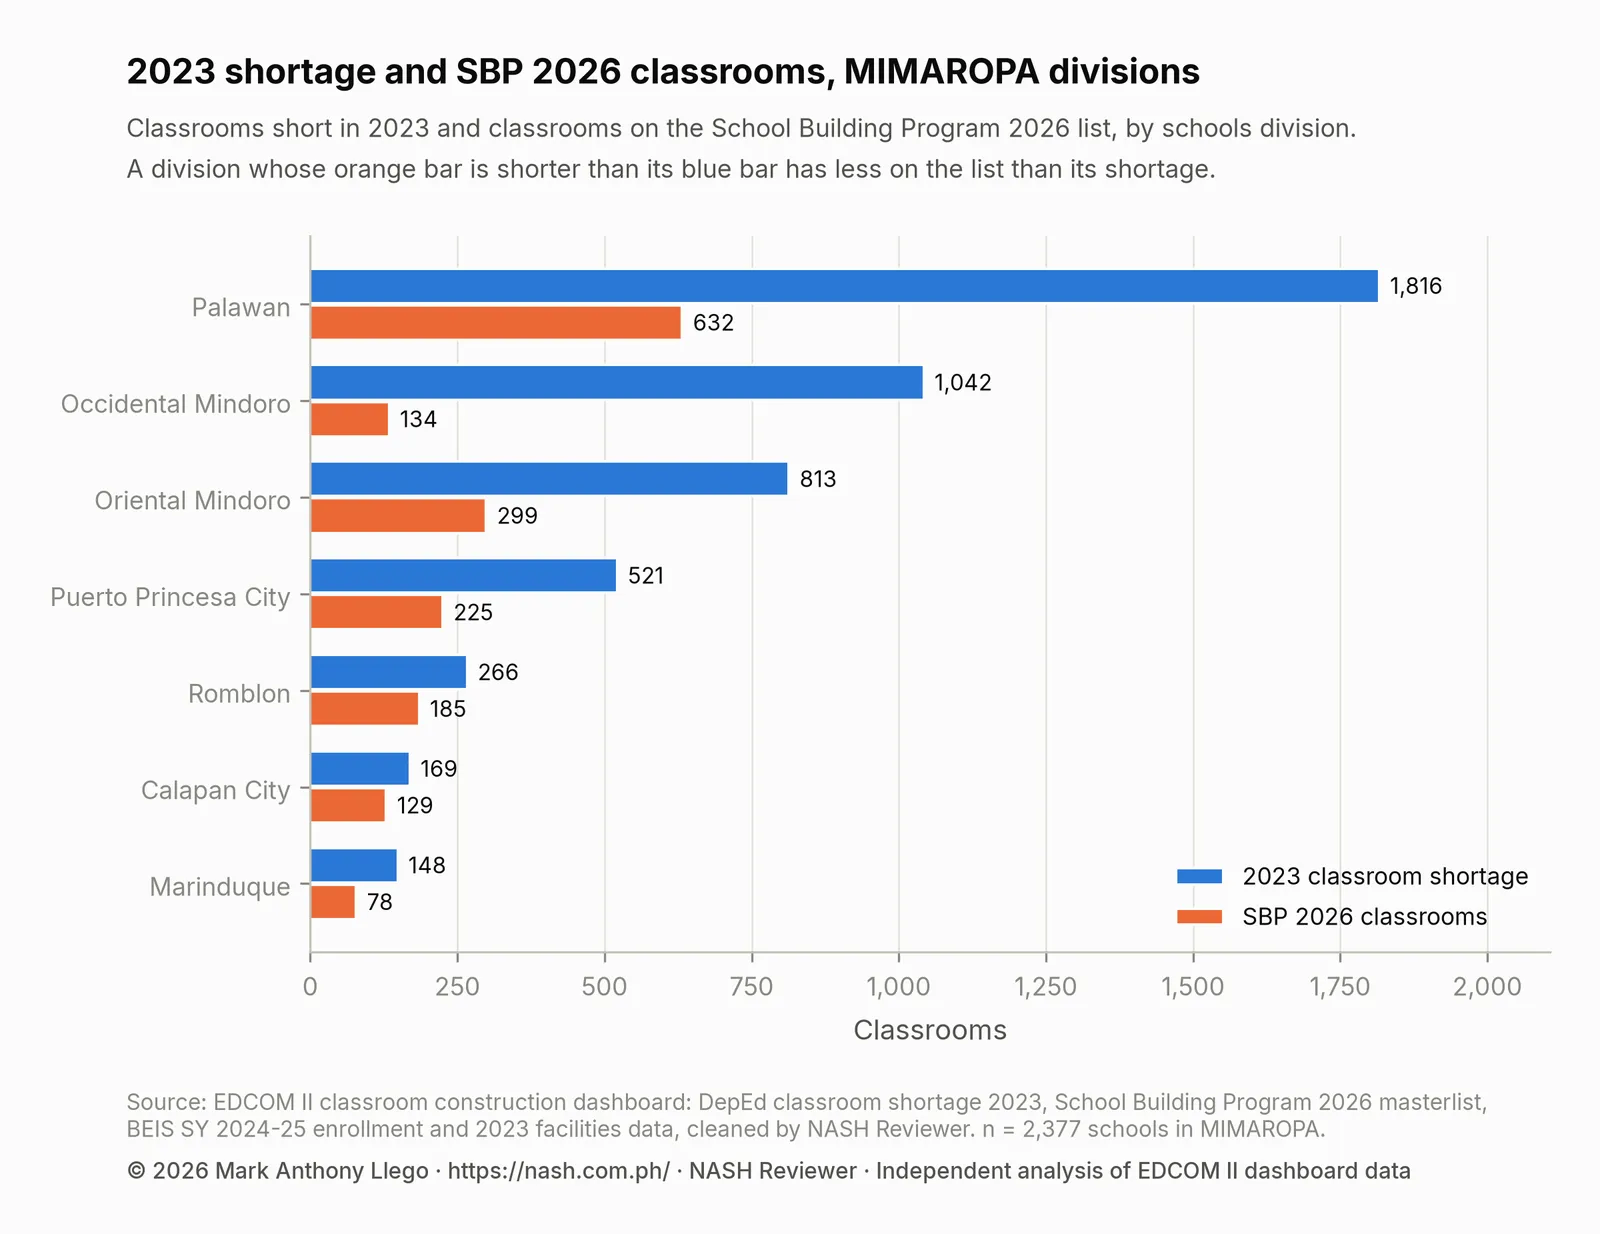
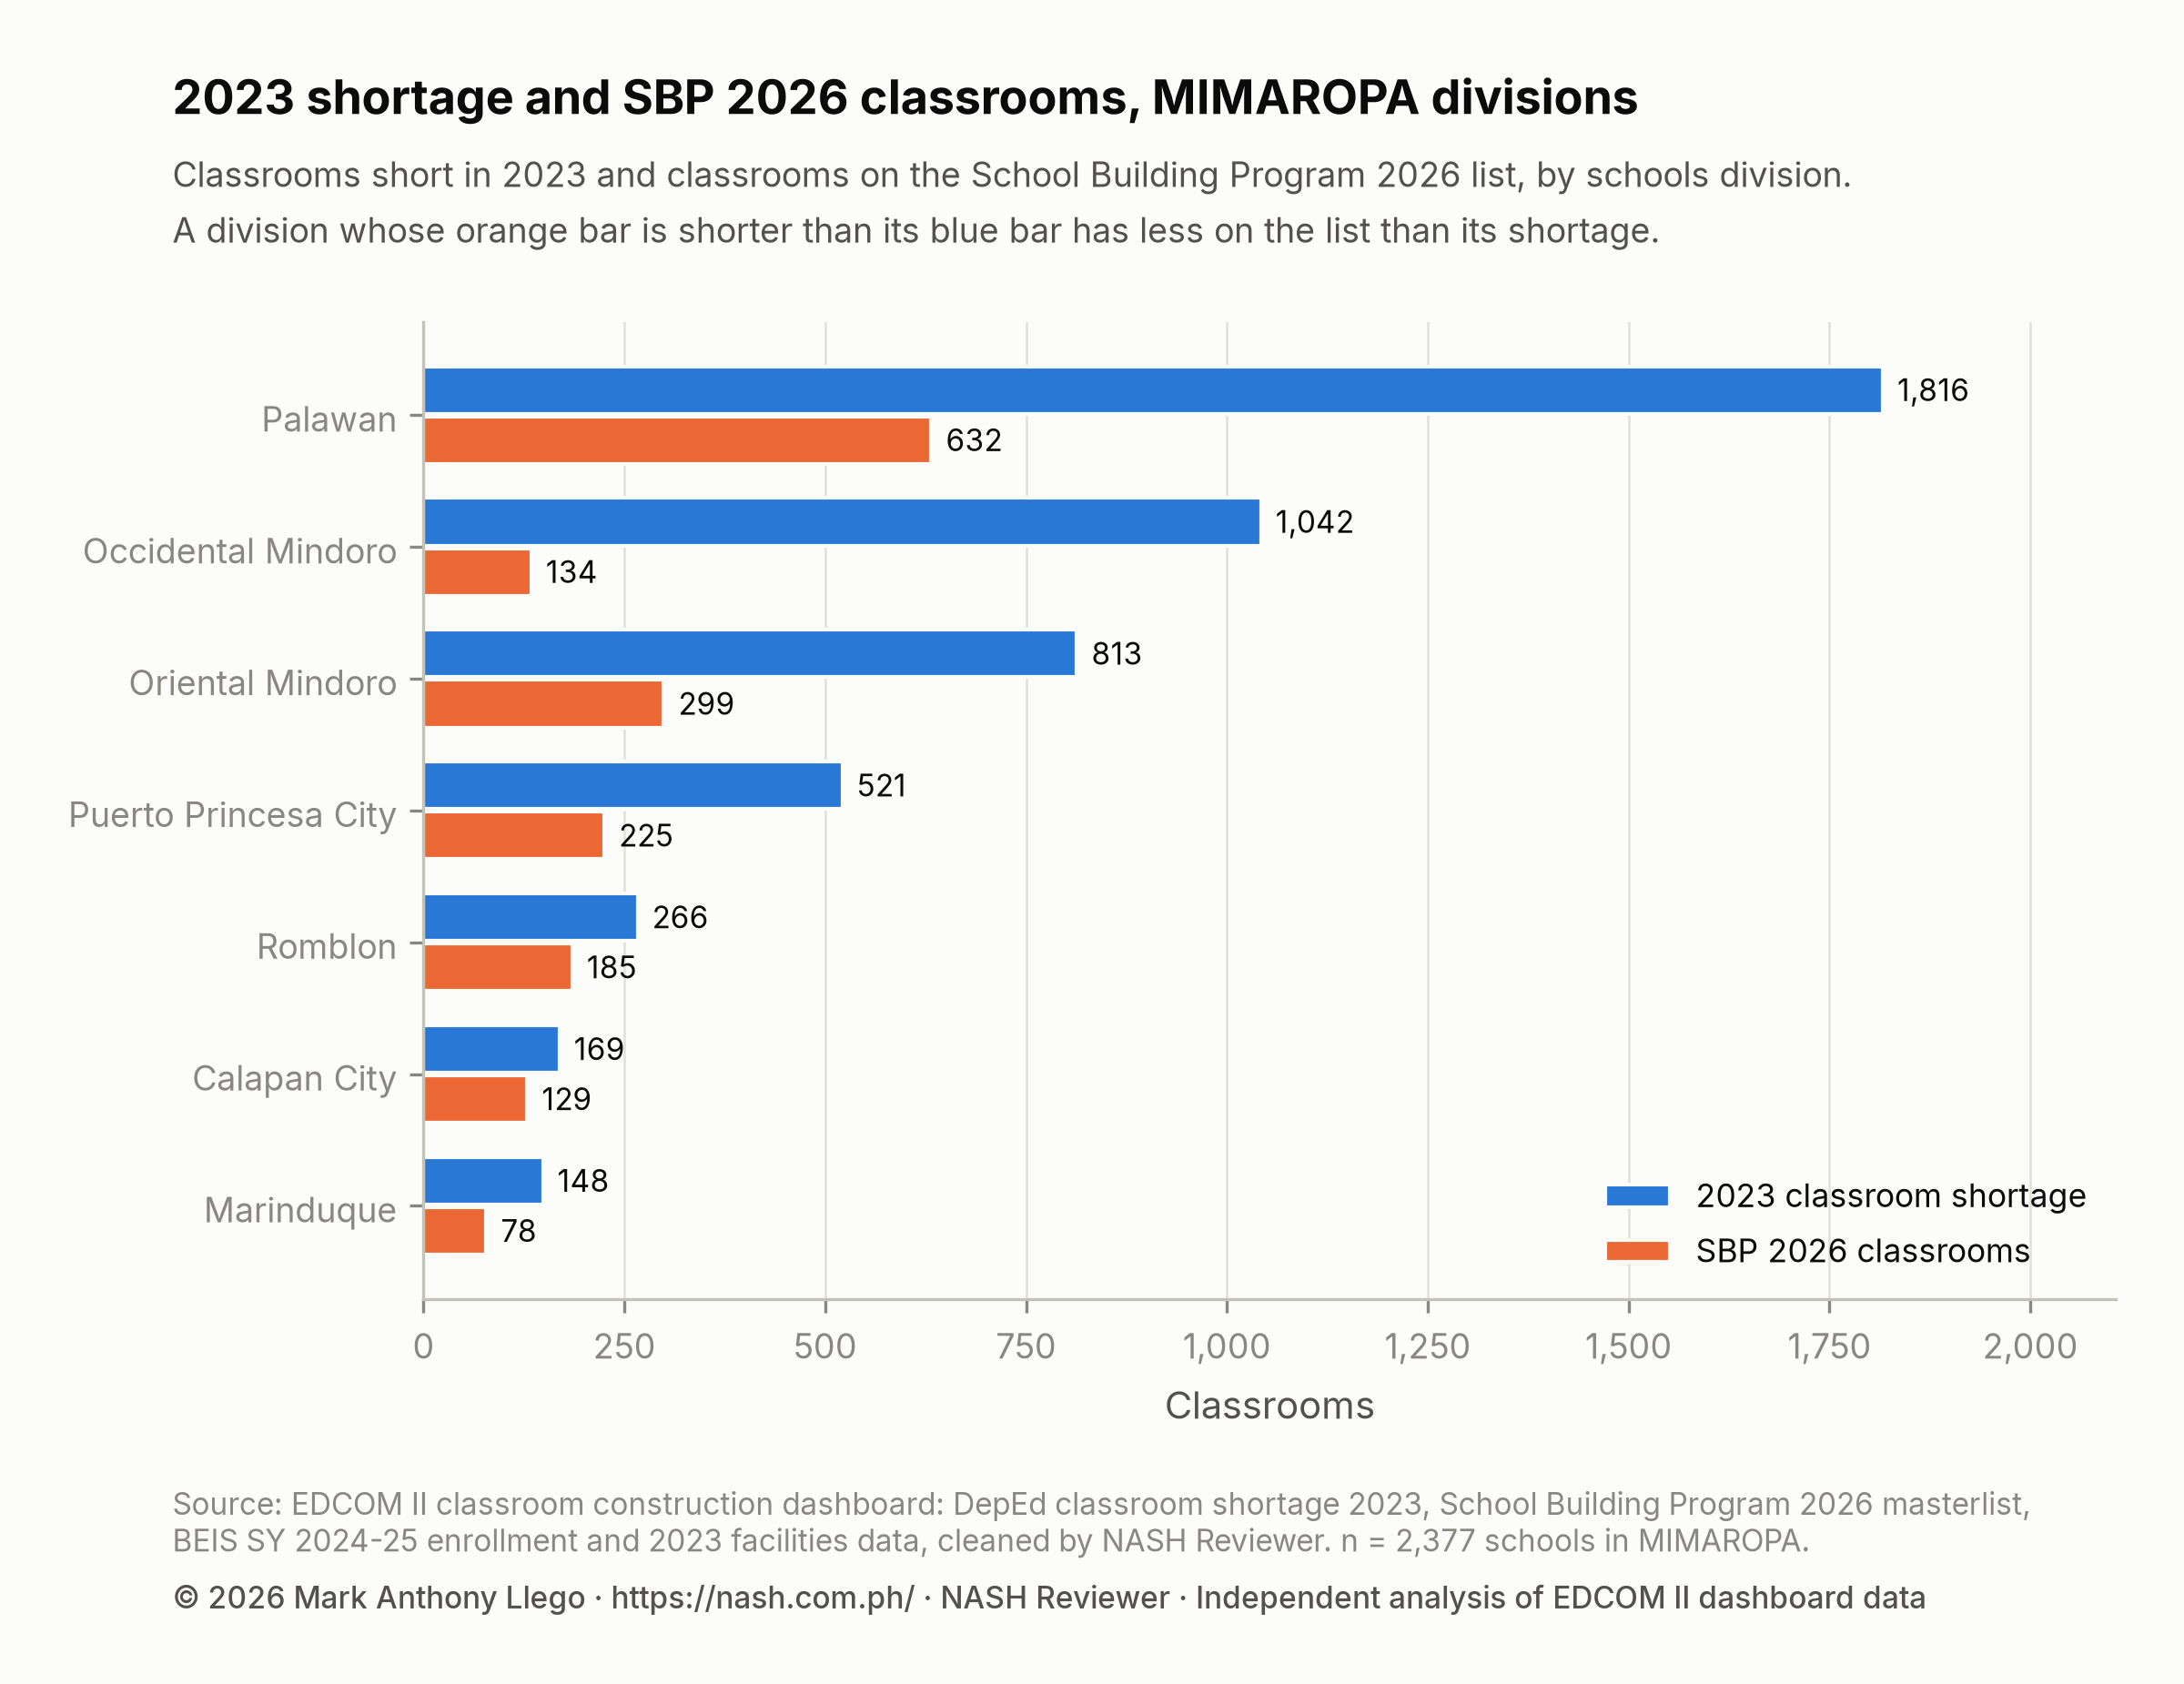
No division gets as many classrooms as it is short, but the gaps differ. In Romblon and Calapan City the orange bar comes close to the blue one. In Occidental Mindoro it is a small fraction: 134 classrooms against a shortage of 1,042, fewer than Romblon receives for a shortage about a quarter as large.
| Modality group | Lines | Schools | Classrooms | Share of the region’s SBP classrooms |
|---|---|---|---|---|
| DPWH | 73 | 73 | 193 | 11.4% |
| LGU | 109 | 109 | 402 | 23.7% |
| DepEd | 22 | 22 | 40 | 2.4% |
| PSIP III (PPP) | 101 | 83 | 1,061 | 62.6% |
PSIP III holds 62.6% of the region’s 2026 classrooms, against 50.3% of the national list, on 101 lines at 83 schools. Local governments implement 402 classrooms (23.7%), the Department of Public Works and Highways (DPWH) 193 and DepEd 40. The region’s high coverage therefore rests mostly on classrooms that are not yet bid out: fewer than half of its 2026 classrooms have a GAA budget. DepEd School Building Program 2026 in Numbers explains the modalities and their budgets.
School by school, the list lands closer to the need than it does nationally. Of the region’s 2026 classrooms, 1,005 (59.2%) fall within the receiving school’s own 2023 shortage, against 53.0% nationally, and 246 (14.5%) go to schools with no 2023 shortage. 209 of the 1,249 schools with a shortage, 16.7%, receive any classroom, and so do 34 of the 60 schools short by more than 10. Counted this way, the 2026 list meets 21.0% of the region’s shortage and leaves 3,772 classrooms unmet. Do 2026 Classrooms Go Where the Shortage Is? explains why a classroom beyond a school’s own shortage meets no other school’s need.
Class shifts and crowded classrooms in MIMAROPA
Shifts are uncommon in MIMAROPA. In SY 2024-25, 23 of the region’s 2,393 schools in the enrollment data (1.0%) held classes in two or more shifts, none in three. They are large schools, enrolling 64,884 learners, 8.2% of the region’s total. Of the 23, 78.3% had a shortage, and 13 (56.5%) receive SBP 2026 classrooms.
Classrooms are a little less crowded than the country’s at every level: the median school has 24.6 learners per classroom in elementary, 29.5 in junior high and 29.4 in senior high, against 24.9, 32.1 and 30.6 nationally. Still, 207 schools have more than 50 learners per classroom, with 15.7% of the learners counted, and bringing each down to 50 would take at least 686 classrooms. Class Shifts and Crowded Classrooms in DepEd Schools explains the measure.
The 2023 facilities data show more makeshift space than the country but fewer condemned buildings: 811 schools (34.1%) use makeshift rooms, against 29.0% nationally, while 509 schools (21.4%) report a building for condemnation or demolition, 840 buildings in all, against 28.9%.
Last Mile Schools in MIMAROPA
588 of the region’s schools (24.7%) are flagged as Last Mile Schools, schools in geographically isolated, disadvantaged and conflict-affected areas and hardship posts. Only a few regions have a larger share. They hold 932 classrooms of shortage, 19.5% of the region’s, and more of them have a shortage than other schools in the region, 60.4% against 50.0%.
The 2026 list reaches them less often. Only 5.1% of Last Mile Schools in MIMAROPA receive an SBP 2026 classroom, against 13.2% of the region’s other schools, less than half the rate; nationally the two shares are close, 9.9% and 11.0%. The region’s Last Mile Schools get 105 classrooms between them, and 334 with a shortage, 850 classrooms in all, receive none. DepEd’s own Last Mile School modality has seven lines with 25 classrooms in the region. Last Mile Schools: Classroom Need and 2026 Allocation compares them nationally.
What this means for school heads in MIMAROPA
The regional figures mix two different places: the western divisions, where shortages are high and, in Occidental Mindoro, little is on the list, and the eastern divisions, where shortages are lower and coverage is higher. Start from your own division.
- Check which kind of classroom your school is getting. If your school is on the 2026 list, look at the modality. Most of the region’s classrooms are PSIP III, expected from March 2027 to July 2028, so plan for crowded rooms in the meantime; GAA lines are funded for 2026.
- In Occidental Mindoro, make the case with the rate. The division is short 7.7 classrooms per 1,000 learners and has classrooms for 12.9% of its shortage. Those two figures, with your own school’s shortage and enrollment, are a strong basis for a request to the division.
- For Last Mile Schools, name the gap. Only 5.1% of the region’s Last Mile Schools are on the list. Record your school’s shortage, its makeshift rooms and its distance in the school improvement plan, and ask the division about DepEd’s Last Mile School modality.
- Bring the LGU in. Local governments implement 402 of the region’s 2026 classrooms, and four cities and municipalities receive more than their shortage while seven with a shortage receive none.
- Check the record before you cite it. If your school’s figures look wrong, a new school ID, a merged annex, a missing building, raise it with the division before the data are used for planning. How to Read DepEd Data: A Guide for Aspiring School Heads shows how to check a school’s records.
How these numbers were made
The data are the cleaned tables behind the EDCOM II classroom construction dashboard: DepEd’s 2023 classroom shortage by school, the SBP 2026 masterlist, SY 2024-25 enrollment and class shifts from the Basic Education Information System (BEIS), 2023 school facilities, and school coordinates from the National School Building Inventory (NSBI) for SY 2022-23. How the EDCOM Classroom Data Was Cleaned documents every table and cleaning rule.
A school’s shortage is DepEd’s 2023 figure for Kindergarten to Grade 10 plus senior high school, counted only where the school lacks classrooms. The shortage per 1,000 learners divides the shortage of schools with SY 2024-25 learners by those learners and multiplies by 1,000. Learners per classroom divide SY 2024-25 learners by 2023 instructional classrooms. A division’s coverage is its SBP 2026 classrooms, GAA and PSIP III together, divided by its 2023 shortage. Classrooms within a school’s shortage are counted up to the size of that shortage, and any beyond it are counted as beyond. Regions follow the PSGC; the City of Puerto Princesa, a highly urbanized city, appears apart from Palawan in the province table, while divisions are DepEd’s schools divisions.
The analysis was done in Python with pandas, and the charts drawn with Matplotlib.
Limits
The sources span several years: the shortage and facilities are from 2023, enrollment and shifts from SY 2024-25, and the allocations from 2026, so a school’s figures may have changed since. The SBP list shows planned classrooms, not finished ones, and in MIMAROPA most of them are PSIP III classrooms not yet bid out. Nationally, 103 PSIP III lines repeat an earlier line exactly; they are kept here, as in the dashboard. The shortage is DepEd’s own estimate, and new, merged or renumbered schools may be missing or counted under a new ID. Division totals of SBP classrooms leave out the three schools with no division in the data. These are descriptive figures: they show where the shortage and the 2026 classrooms are, not why.
Frequently asked questions
How big is the classroom shortage in MIMAROPA?
DepEd’s 2023 data put MIMAROPA’s classroom shortage at 4,777 classrooms, 2.9% of the national shortage of 165,443. That is 6.0 classrooms per 1,000 learners, against 7.4 nationally, and 52.5% of the region’s public schools have a shortage.
Which province in MIMAROPA has the biggest classroom shortage?
By count, Palawan, short 1,816 classrooms, 38.0% of the region’s shortage, not counting the City of Puerto Princesa’s 521. By rate, Occidental Mindoro, short 7.7 classrooms per 1,000 learners, which also has the region’s lowest SBP 2026 coverage, 12.9%.
How many classrooms will MIMAROPA get under the SBP 2026?
The SBP 2026 masterlist has 1,696 classrooms for MIMAROPA on 305 lines at 270 schools, equal to 35.5% of the region’s 2023 shortage, against 19.6% nationally. Of these, 635 are funded under the GAA 2026 with PHP 2.01 billion, and 1,061 are PSIP III classrooms still for bidding. The list is a plan; it does not mean the classrooms are built.
Are Last Mile Schools in MIMAROPA getting new classrooms?
Few are. The region has 588 Last Mile Schools, 24.7% of its schools, and 60.4% of them have a shortage, but only 5.1% receive an SBP 2026 classroom, against 13.2% of other schools. 334 Last Mile Schools with a shortage, 850 classrooms in all, get none.
Download the data and cite this post
The cleaned EDCOM II classroom data behind this series are free to download for personal study; to reuse them, email support@nash.com.ph for written permission first. How the EDCOM Classroom Data Was Cleaned explains every table and cleaning rule. The files are at data.nash.com.ph: start with the README, then the school table (Parquet, or CSV), the School Building Program lines (CSV), the city and municipality table (CSV), and every table for Stata and SPSS. Every regional figure in this report can be computed from the school table, filtered to MIMAROPA by deped_region.
Every file, with its rows, columns and checksum, is listed on the EDCOM II classroom data page. To cite the data: Llego, M. A. (2026). EDCOM II classroom construction dashboard data, cleaned, version 1.1. NASH Reviewer. https://nash.com.ph/edcom-classroom-data
To cite this post: Llego, M. A. (2026, October 28). Classroom shortage in MIMAROPA, 2023–2026: Palawan, Mindoro. NASH Reviewer Blog. https://nash.com.ph/blog/classroom-shortage-mimaropa
References
- Llego, M. A. (2026). EDCOM II classroom construction dashboard data, cleaned, version 1.1 [Data set]. NASH Reviewer. https://nash.com.ph/edcom-classroom-data
More in this series
- How the EDCOM Classroom Data Was Cleaned
- Philippine Classroom Shortage 2023: Where the Gap Is
- DepEd School Building Program 2026 in Numbers
- Do 2026 Classrooms Go Where the Shortage Is?
- Classroom Allocation by LGU Income Class, 2026
- Class Shifts and Crowded Classrooms in DepEd Schools
- Last Mile Schools: Classroom Need and 2026 Allocation
- Regional reports: NCR, CAR, Region I, Region II, Region III, Region IV-A, MIMAROPA, Region V, Region VI, NIR, Region VII, Region VIII, Region IX, Region X, Region XI, Region XII, Caraga, BARMM
- Rankings and deep dives: Congressional districts, Top 20 cities and municipalities, Rizal, Quezon City, City of Manila, Tawi-Tawi, Cavite, Cost of a classroom
- Explainers: PSIP III, Senior high shortage, Junior high shortage, Excess classrooms, Learning Continuity Spaces, How learners reach school
- For teachers and school heads: Action research and thesis topics
- Related: CRLA Results SY 2025-26 in MIMAROPA: From Palawan to Romblon, DepEd School Improvement Plan (SIP): Steps, AIP and SRC, How to Read DepEd Data: A Guide for Aspiring School Heads
Analysis and charts by Mark Anthony Llego for NASH Reviewer. Data: EDCOM II classroom construction dashboard and Department of Education data. NASH Reviewer is not affiliated with EDCOM II or DepEd. Charts may be reused only with written permission from support@nash.com.ph.