Twenty cities and municipalities hold nearly a quarter of the classroom shortage in Philippine public schools. By DepEd’s 2023 count, as published in the EDCOM II classroom construction dashboard, they lack 40,127 classrooms, 24.3% of the national shortage of 165,443, while enrolling 14.3% of the country’s SY 2024-25 learners. Quezon City heads the list, short 5,507 classrooms, followed by the City of Davao (4,052), the City of Caloocan (3,807), the City of Manila (2,771) and the City of Antipolo in Rizal (2,663). Eight of the 20 are in NCR and seven in Region IV-A; all are first-income-class LGUs, and all but Rodriguez, Rizal, are cities.
The School Building Program (SBP) 2026 lists 4,905 classrooms for these 20 places. That is 15.1% of the national list and 12.2% of their combined shortage, against 19.6% for the country as a whole. Coverage runs from 1.0% in the City of Davao to 68.2% in the City of Manila, and 14 of the 20 receive classrooms equal to less than a tenth of their shortage.
The post is written for teachers, school heads and aspiring school heads who want to place their city or town in the national picture, or cite these figures in a school improvement plan, an action research paper or a thesis. Every file behind it is listed on the EDCOM II classroom data page. Read every figure as a 2026 plan set against a 2023 count: the data show where the shortage and the planned classrooms are, not why a place received what it did.
Key findings
- The 20 cities and municipalities with the largest 2023 classroom shortages lack 40,127 classrooms, 24.3% of the national shortage, while enrolling 14.3% of SY 2024-25 learners.
- The SBP 2026 list gives them 4,905 classrooms, 15.1% of its total, equal to 12.2% of their shortage against 19.6% nationally; 14 of the 20 have coverage below 10%.
- Quezon City has the largest shortage, 5,507 classrooms, with 398 on the list (7.2%); the City of Manila, with 1,890 classrooms against 2,771 (68.2%), has by far the highest coverage of the 20.
- The shortage is concentrated: the 16 places with the largest shortages, the top 1%, hold 21.7% of it, half of it lies in 114 places (6.9% of all), and the Gini coefficient across places is 0.67.
- Among the 242 places with 20,000 learners or more, Bongao, Tawi-Tawi, has the highest shortage rate, 20.7 classrooms per 1,000 learners against 7.4 nationally; 10 of the 20 highest rates are in places also in the top 20 by count.
- Places with larger shortages tend to receive more SBP 2026 classrooms (Spearman’s rho 0.34), but among places with 20,000 learners or more, those with higher shortage rates tend to have a smaller share of their shortage covered (rho -0.54).
- 266 places with a shortage, 13,613 classrooms between them, receive no SBP 2026 classroom, while 183 receive more than their shortage, 3,101 classrooms beyond it in all; Maragondon, Cavite, has the most beyond its shortage, with 272 classrooms against 64.
The 20 cities and municipalities with the largest classroom shortages
The chart sets each place’s 2023 shortage beside its SBP 2026 classrooms. Places are ranked by shortage, with ties broken by enrollment; the 20th, the City of Cebu, is short 1,026 classrooms.
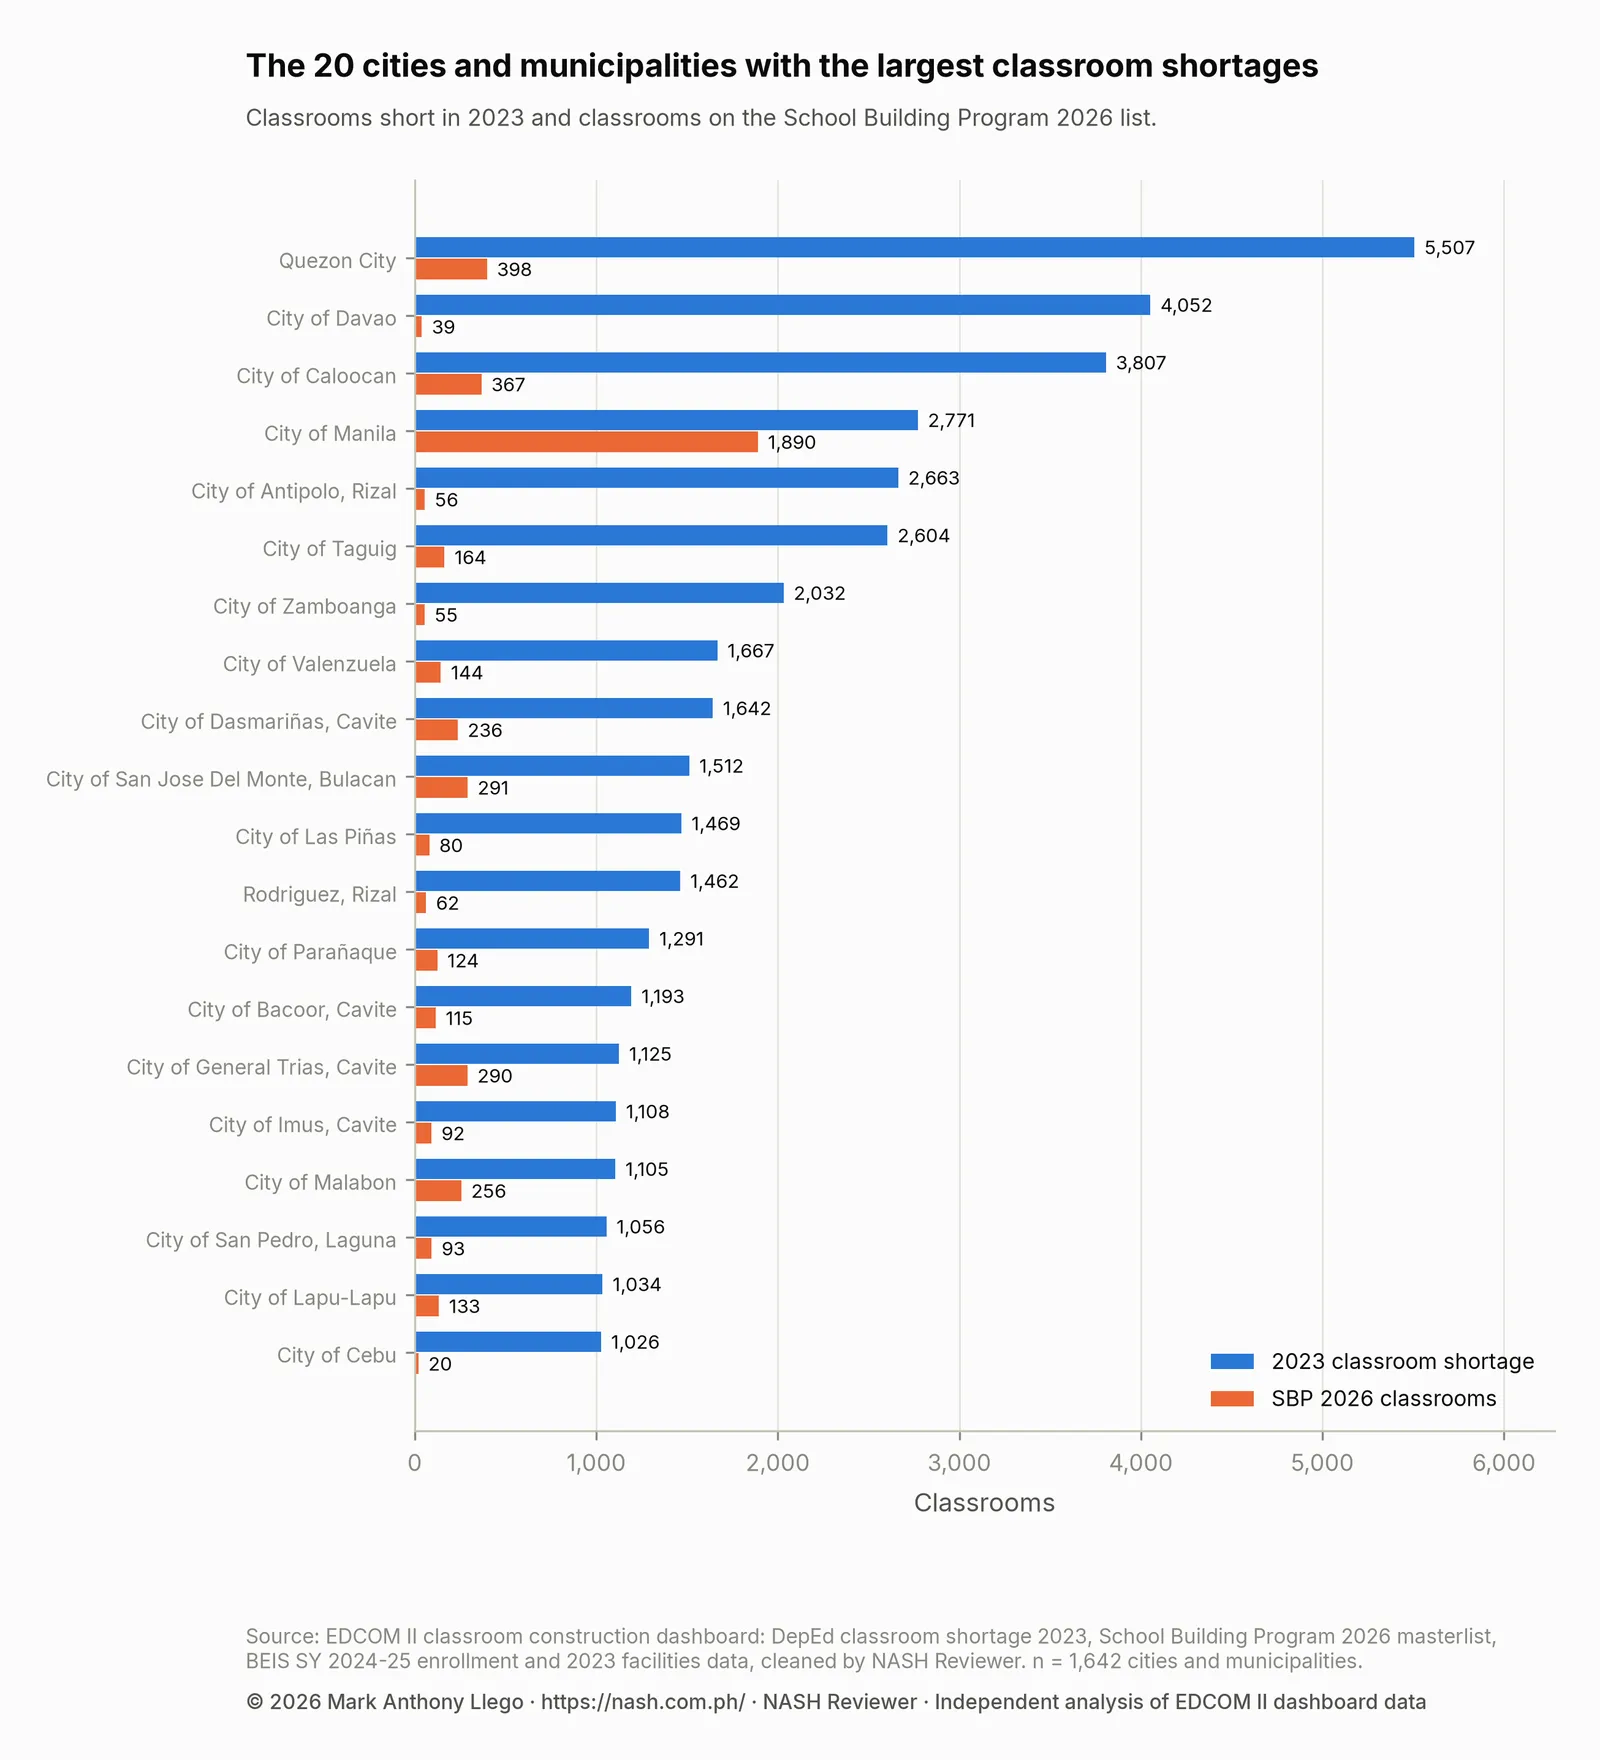
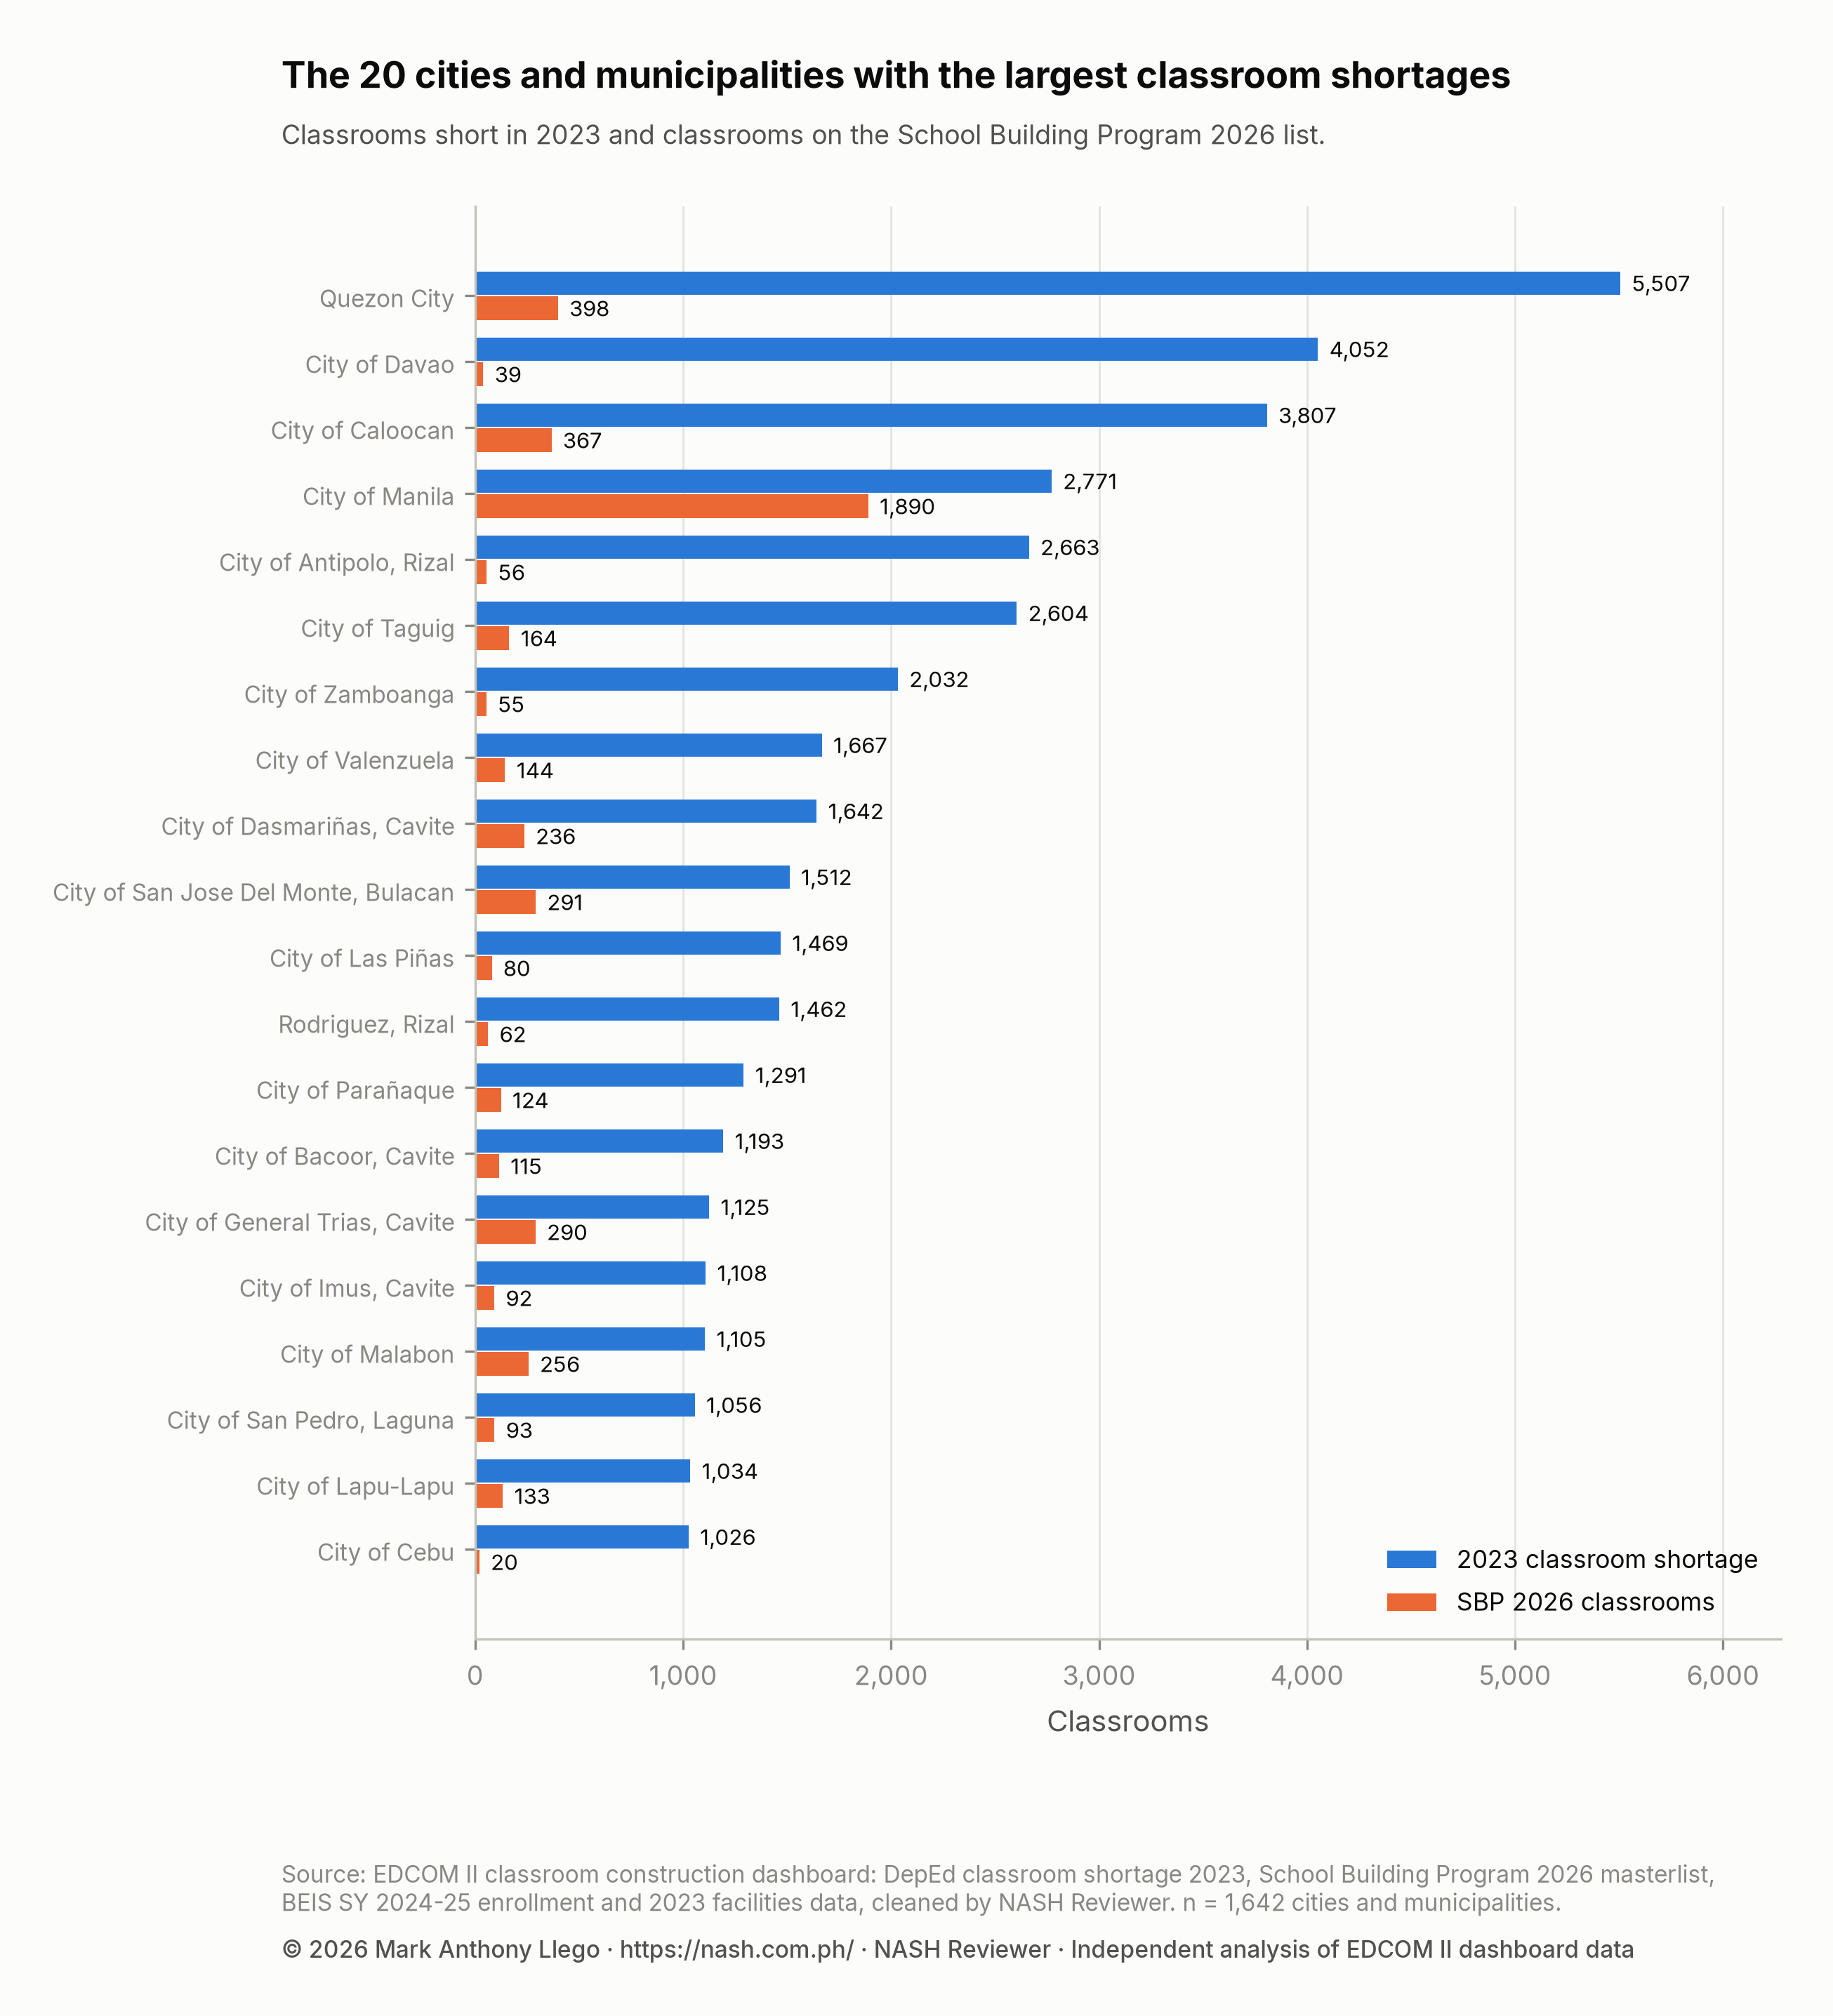
In every one of the 20 places, the orange bar is shorter than the blue one. Quezon City’s 398 classrooms equal 7.2% of its shortage. The City of Davao, second with 4,052 classrooms short, has 39 on the list (1.0%), the lowest coverage of the 20; the City of Antipolo has 56 against 2,663 (2.1%) and the City of Zamboanga 55 against 2,032 (2.7%). The City of Manila stands apart, with 1,890 classrooms against 2,771 (68.2%). Next come the City of General Trias, Cavite (25.8%), and the City of Malabon (23.2%).
| Rank | City or municipality | Province or city | Region | Schools | Learners (SY 2024-25) | Classroom shortage (2023) | Shortage per 1,000 learners | Schools on shifts | SBP 2026 classrooms | Coverage |
|---|---|---|---|---|---|---|---|---|---|---|
| 1 | Quezon City | Quezon City | NCR | 158 | 420,619 | 5,507 | 13.1 | 81 | 398 | 7.2% |
| 2 | City of Davao | City of Davao | Region XI | 431 | 371,392 | 4,052 | 10.9 | 79 | 39 | 1.0% |
| 3 | City of Caloocan | City of Caloocan | NCR | 89 | 264,993 | 3,807 | 14.4 | 34 | 367 | 9.6% |
| 4 | City of Manila | City of Manila | NCR | 104 | 251,500 | 2,771 | 11.0 | 72 | 1,890 | 68.2% |
| 5 | City of Antipolo | Rizal | Region IV-A | 67 | 176,473 | 2,663 | 15.1 | 42 | 56 | 2.1% |
| 6 | City of Taguig | City of Taguig | NCR | 52 | 186,781 | 2,604 | 13.9 | 43 | 164 | 6.3% |
| 7 | City of Zamboanga | City of Zamboanga | Region IX | 216 | 237,875 | 2,032 | 8.5 | 16 | 55 | 2.7% |
| 8 | City of Valenzuela | City of Valenzuela | NCR | 71 | 130,349 | 1,667 | 12.8 | 47 | 144 | 8.6% |
| 9 | City of Dasmariñas | Cavite | Region IV-A | 44 | 118,113 | 1,642 | 13.9 | 20 | 236 | 14.4% |
| 10 | City of San Jose Del Monte | Bulacan | Region III | 57 | 126,952 | 1,512 | 11.9 | 51 | 291 | 19.2% |
| 11 | City of Las Piñas | City of Las Piñas | NCR | 39 | 90,254 | 1,469 | 16.3 | 35 | 80 | 5.4% |
| 12 | Rodriguez | Rizal | Region IV-A | 47 | 93,873 | 1,462 | 15.6 | 13 | 62 | 4.2% |
| 13 | City of Parañaque | City of Parañaque | NCR | 43 | 100,923 | 1,291 | 12.8 | 36 | 124 | 9.6% |
| 14 | City of Bacoor | Cavite | Region IV-A | 43 | 82,645 | 1,193 | 14.4 | 27 | 115 | 9.6% |
| 15 | City of General Trias | Cavite | Region IV-A | 36 | 81,794 | 1,125 | 13.8 | 22 | 290 | 25.8% |
| 16 | City of Imus | Cavite | Region IV-A | 35 | 73,799 | 1,108 | 15.0 | 14 | 92 | 8.3% |
| 17 | City of Malabon | City of Malabon | NCR | 42 | 68,507 | 1,105 | 16.1 | 33 | 256 | 23.2% |
| 18 | City of San Pedro | Laguna | Region IV-A | 28 | 51,675 | 1,056 | 20.4 | 12 | 93 | 8.8% |
| 19 | City of Lapu-Lapu | City of Lapu-Lapu | Region VII | 71 | 100,852 | 1,034 | 10.3 | 16 | 133 | 12.9% |
| 20 | City of Cebu | City of Cebu | Region VII | 107 | 176,881 | 1,026 | 5.8 | 27 | 20 | 1.9% |
All 20 are first-income-class LGUs, and they lie in six regions. Measured against learners, they differ widely. The City of San Pedro, Laguna, is short 20.4 classrooms per 1,000 learners, far above the national 7.4, while the City of Cebu, 20th by count, is at 5.8, below it. Together the 20 places have 720 schools that held classes in two or more shifts in SY 2024-25, 35.6% of all such schools in the country. Counted school by school, the 2026 list leaves 36,845 of their 40,127 classrooms of shortage unmet, because some of their classrooms go to schools beyond their own shortage or to schools with none.
Five posts in this series read some of these places school by school:
- Quezon City. 50.9% of its schools run shifts, and Batasan Hills National HS, short 319 classrooms, has the largest school shortage in the country, with 20 classrooms on the list.
- The City of Manila. 1,813 of its 1,890 SBP classrooms are PSIP III classrooms, from the third Public-Private Partnership for School Infrastructure Project, still for bidding, with construction expected from March 2027 to July 2028. The deep dive uses the Manila division’s figures, which differ slightly from the city’s here.
- Rizal. The City of Antipolo and Rodriguez are both in the top 20, and the province, with Antipolo, is short 8,516 classrooms, second among the 118 provinces and highly urbanized cities.
- Cavite. Four of its cities, Dasmariñas, Bacoor, General Trias and Imus, are in the top 20, and the province is short 8,832 classrooms, the most of any province or highly urbanized city.
- Tawi-Tawi. None of its towns is in the top 20 by count, but Bongao leads the ranking by rate, below.
For the other places, the regional reports give the division view: NCR, Region III for San Jose Del Monte, Region VII for Lapu-Lapu and Cebu, Region IX for Zamboanga and Region XI for Davao.
How concentrated the classroom shortage is across cities and municipalities
Line up all 1,642 cities and municipalities from the smallest shortage to the largest, and follow the running share of the national shortage as each place is added. If every place had the same shortage, that running share would rise in a straight line, the diagonal. The more the shortage is held by a few places, the further the curve sags below the diagonal before it climbs at the end.
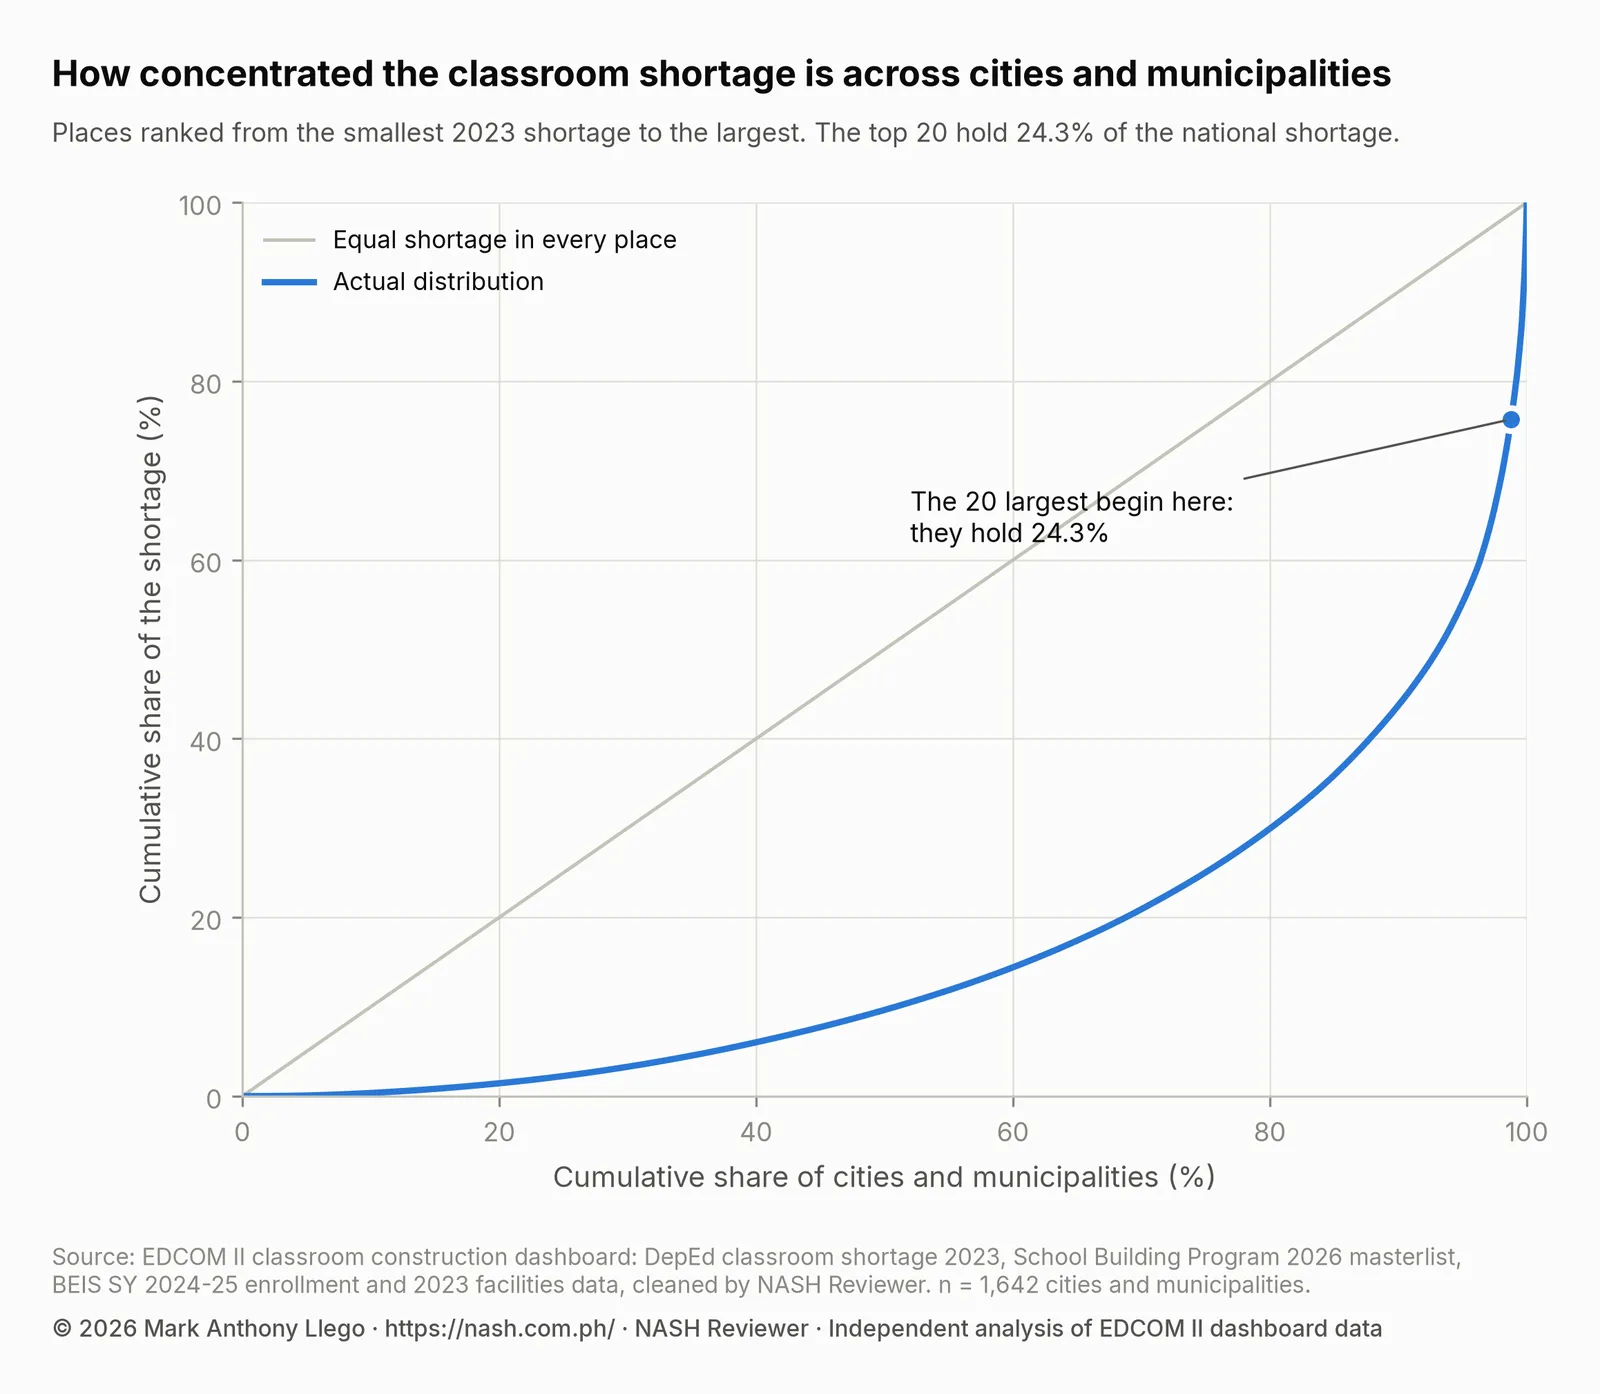
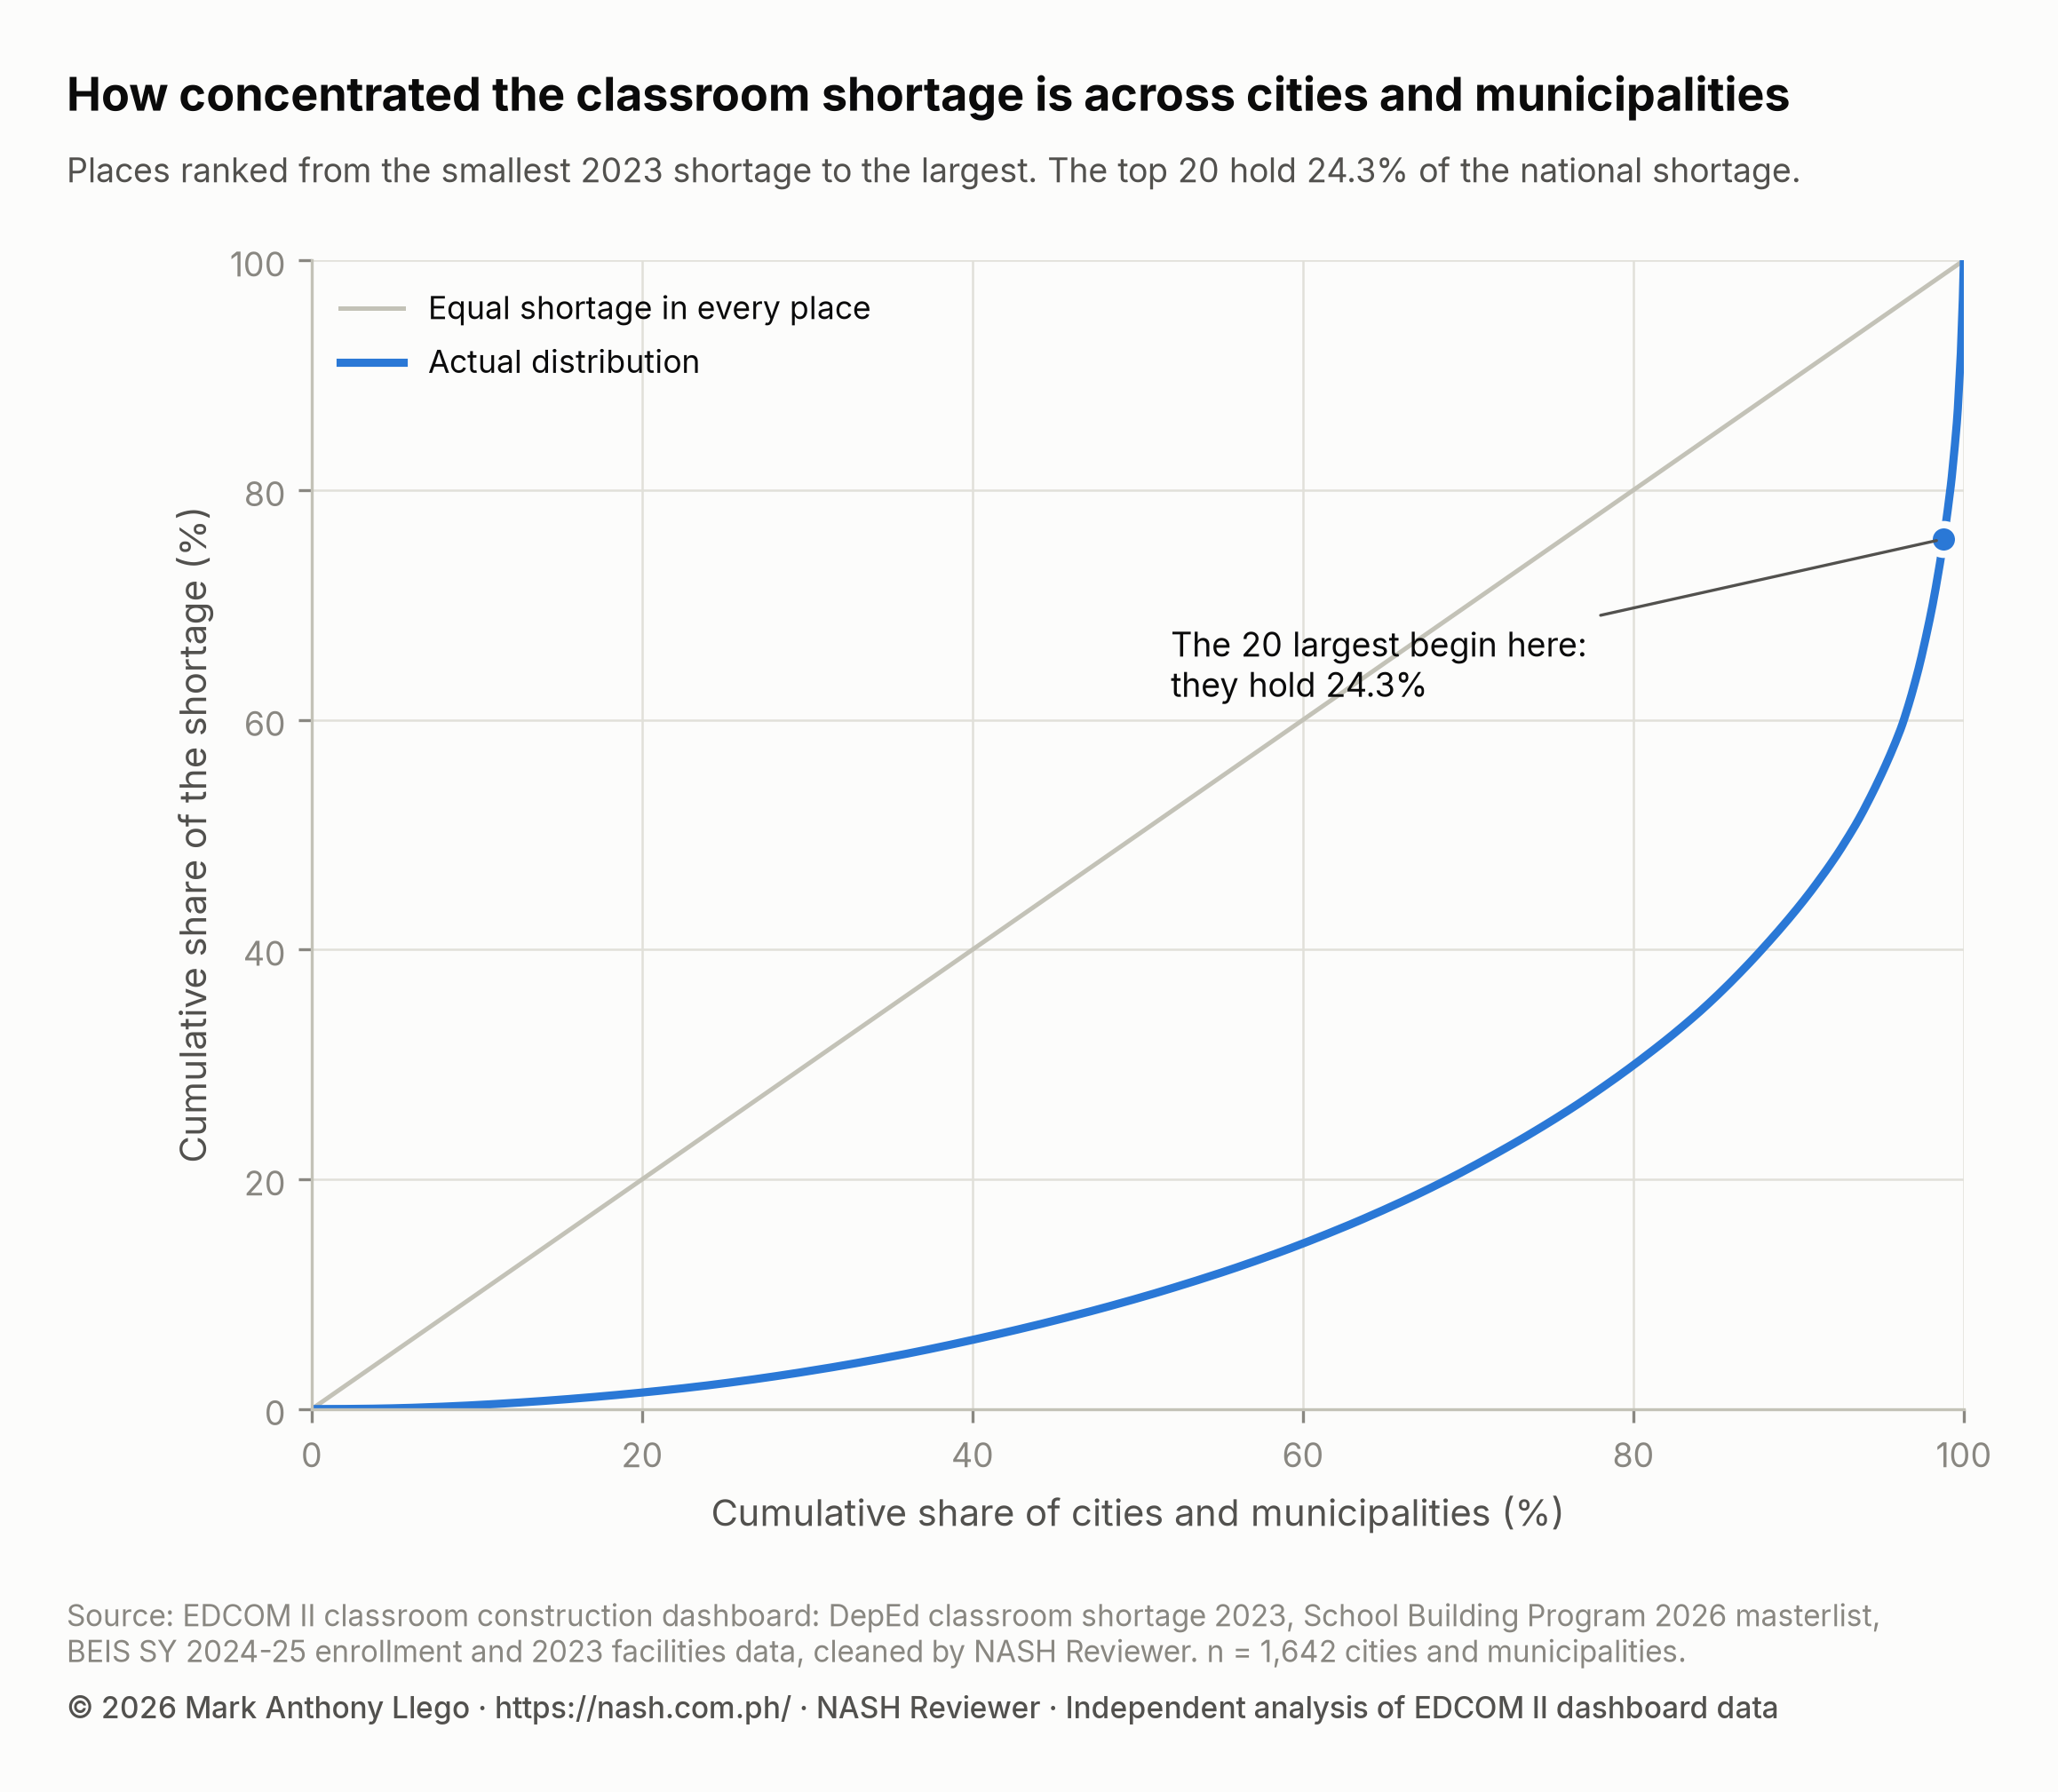
The curve hugs the bottom for most of its length and turns upward only near the end. The 16 places with the largest shortages, the top 1% of places, hold 21.7% of the shortage; the top 5%, 82 places, hold 44.8%; and the top 10%, 164 places, hold 56.3%. Half of the national shortage lies in 114 places, 6.9% of all cities and municipalities. The 20 largest, marked on the curve, hold 24.3%.
This is a Lorenz curve (Lorenz, 1905), and the Gini coefficient (Gini, 1912) sums it up in one number: twice the area between the curve and the diagonal. It is 0 when every place has the same shortage and approaches 1 when one place has all of it. Across cities and municipalities, the Gini coefficient of the shortage is 0.67. Across schools it is 0.80, as reported in Philippine Classroom Shortage 2023: Where the Gap Is; adding schools together into places evens out some of the differences between schools, so the place-level figure is lower.
Size explains part of this concentration, since large cities have more schools and more learners. It does not explain all of it: the top 20 enroll 14.3% of the country’s learners but hold 24.3% of its shortage.
Highest classroom shortage per learner: the top 20 by rate
A count favors large places. A rate, the classrooms short for every 1,000 learners enrolled in SY 2024-25, allows for size. Rates for very small places can swing widely with one or two schools, so this ranking covers the 242 cities and municipalities with 20,000 learners or more.
| Rank | City or municipality | Province or city | Region | Schools | Learners (SY 2024-25) | Classroom shortage (2023) | Shortage per 1,000 learners | Schools on shifts | SBP 2026 classrooms | Coverage |
|---|---|---|---|---|---|---|---|---|---|---|
| 1 | Bongao | Tawi-Tawi | BARMM | 62 | 26,276 | 544 | 20.7 | 1 | 8 | 1.5% |
| 2 | City of San Pedro | Laguna | Region IV-A | 28 | 51,675 | 1,056 | 20.4 | 12 | 93 | 8.8% |
| 3 | Carmen | Cotabato | Region XII | 50 | 21,071 | 361 | 16.3 | 0 | 14 | 3.9% |
| 4 | City of Las Piñas | City of Las Piñas | NCR | 39 | 90,254 | 1,469 | 16.3 | 35 | 80 | 5.4% |
| 5 | City of Malabon | City of Malabon | NCR | 42 | 68,507 | 1,105 | 16.1 | 33 | 256 | 23.2% |
| 6 | San Mateo | Rizal | Region IV-A | 21 | 44,422 | 706 | 15.9 | 6 | 40 | 5.7% |
| 7 | Cainta | Rizal | Region IV-A | 25 | 49,652 | 777 | 15.6 | 11 | 36 | 4.6% |
| 8 | Rodriguez | Rizal | Region IV-A | 47 | 93,873 | 1,462 | 15.6 | 13 | 62 | 4.2% |
| 9 | City of Tayabas | Quezon | Region IV-A | 36 | 21,776 | 346 | 15.3 | 3 | 89 | 25.7% |
| 10 | City of Antipolo | Rizal | Region IV-A | 67 | 176,473 | 2,663 | 15.1 | 42 | 56 | 2.1% |
| 11 | City of Imus | Cavite | Region IV-A | 35 | 73,799 | 1,108 | 15.0 | 14 | 92 | 8.3% |
| 12 | City of Santa Rosa | Laguna | Region IV-A | 28 | 64,029 | 951 | 14.9 | 18 | 65 | 6.8% |
| 13 | City of Talisay | Cebu | Region VII | 44 | 53,713 | 794 | 14.8 | 25 | 46 | 5.8% |
| 14 | City of Toledo | Cebu | Region VII | 62 | 50,806 | 741 | 14.6 | 6 | 21 | 2.8% |
| 15 | City of Bacoor | Cavite | Region IV-A | 43 | 82,645 | 1,193 | 14.4 | 27 | 115 | 9.6% |
| 16 | City of Caloocan | City of Caloocan | NCR | 89 | 264,993 | 3,807 | 14.4 | 34 | 367 | 9.6% |
| 17 | City of Navotas | City of Navotas | NCR | 25 | 46,219 | 662 | 14.3 | 25 | 224 | 33.8% |
| 18 | Naic | Cavite | Region IV-A | 29 | 44,541 | 631 | 14.2 | 10 | 356 | 56.4% |
| 19 | City of Taguig | City of Taguig | NCR | 52 | 186,781 | 2,604 | 13.9 | 43 | 164 | 6.3% |
| 20 | City of Dasmariñas | Cavite | Region IV-A | 44 | 118,113 | 1,642 | 13.9 | 20 | 236 | 14.4% |
Bongao, Tawi-Tawi, ranks first: 544 classrooms short for 26,276 learners, 20.7 per 1,000, with 8 classrooms on the SBP 2026 list (1.5%). The City of San Pedro, Laguna, is second at 20.4. Most of the rest are in Region IV-A or NCR, among them the four Rizal places of San Mateo, Cainta, Rodriguez and the City of Antipolo, and four places in Cavite. Half of the 20, 10 places, are also in the top 20 by count; the others are smaller places with high rates, such as Carmen, Cotabato (16.3), and the City of Tayabas, Quezon (15.3).
Tawi-Tawi as a whole has the highest rate of any province or highly urbanized city, 24.2 classrooms short per 1,000 learners, and two of its smaller municipalities, Panglima Sugala and Sitangkai, appear below among the largest shortages with no SBP classroom. The Tawi-Tawi deep dive reads its island municipalities school by school, and BARMM’s report gives the regional context.
Shortage rate and 2026 coverage
Do places with more need get more classrooms? One way to ask is to compare ranks rather than raw counts: line the places up once by shortage and once by SBP 2026 classrooms, and see how far the two orders agree. Spearman’s rank correlation (Spearman, 1904) measures this agreement, from -1 (opposite orders) through 0 (no link) to 1 (the same order). Ranks keep a few very large places from dominating the result.
Across all 1,642 places, the rank correlation between the 2023 shortage and SBP 2026 classrooms is 0.34 (95% interval 0.29 to 0.38). Places with larger shortages tend to receive more classrooms, but loosely, as Do 2026 Classrooms Go Where the Shortage Is? also found when it repeated EDCOM II’s comparison of cities and municipalities.
A second question is whether the places where the shortage weighs most on each learner have more of it covered. The chart plots, for the 242 places with 20,000 learners or more, the shortage per 1,000 learners against coverage, the place’s SBP 2026 classrooms as a share of its shortage.
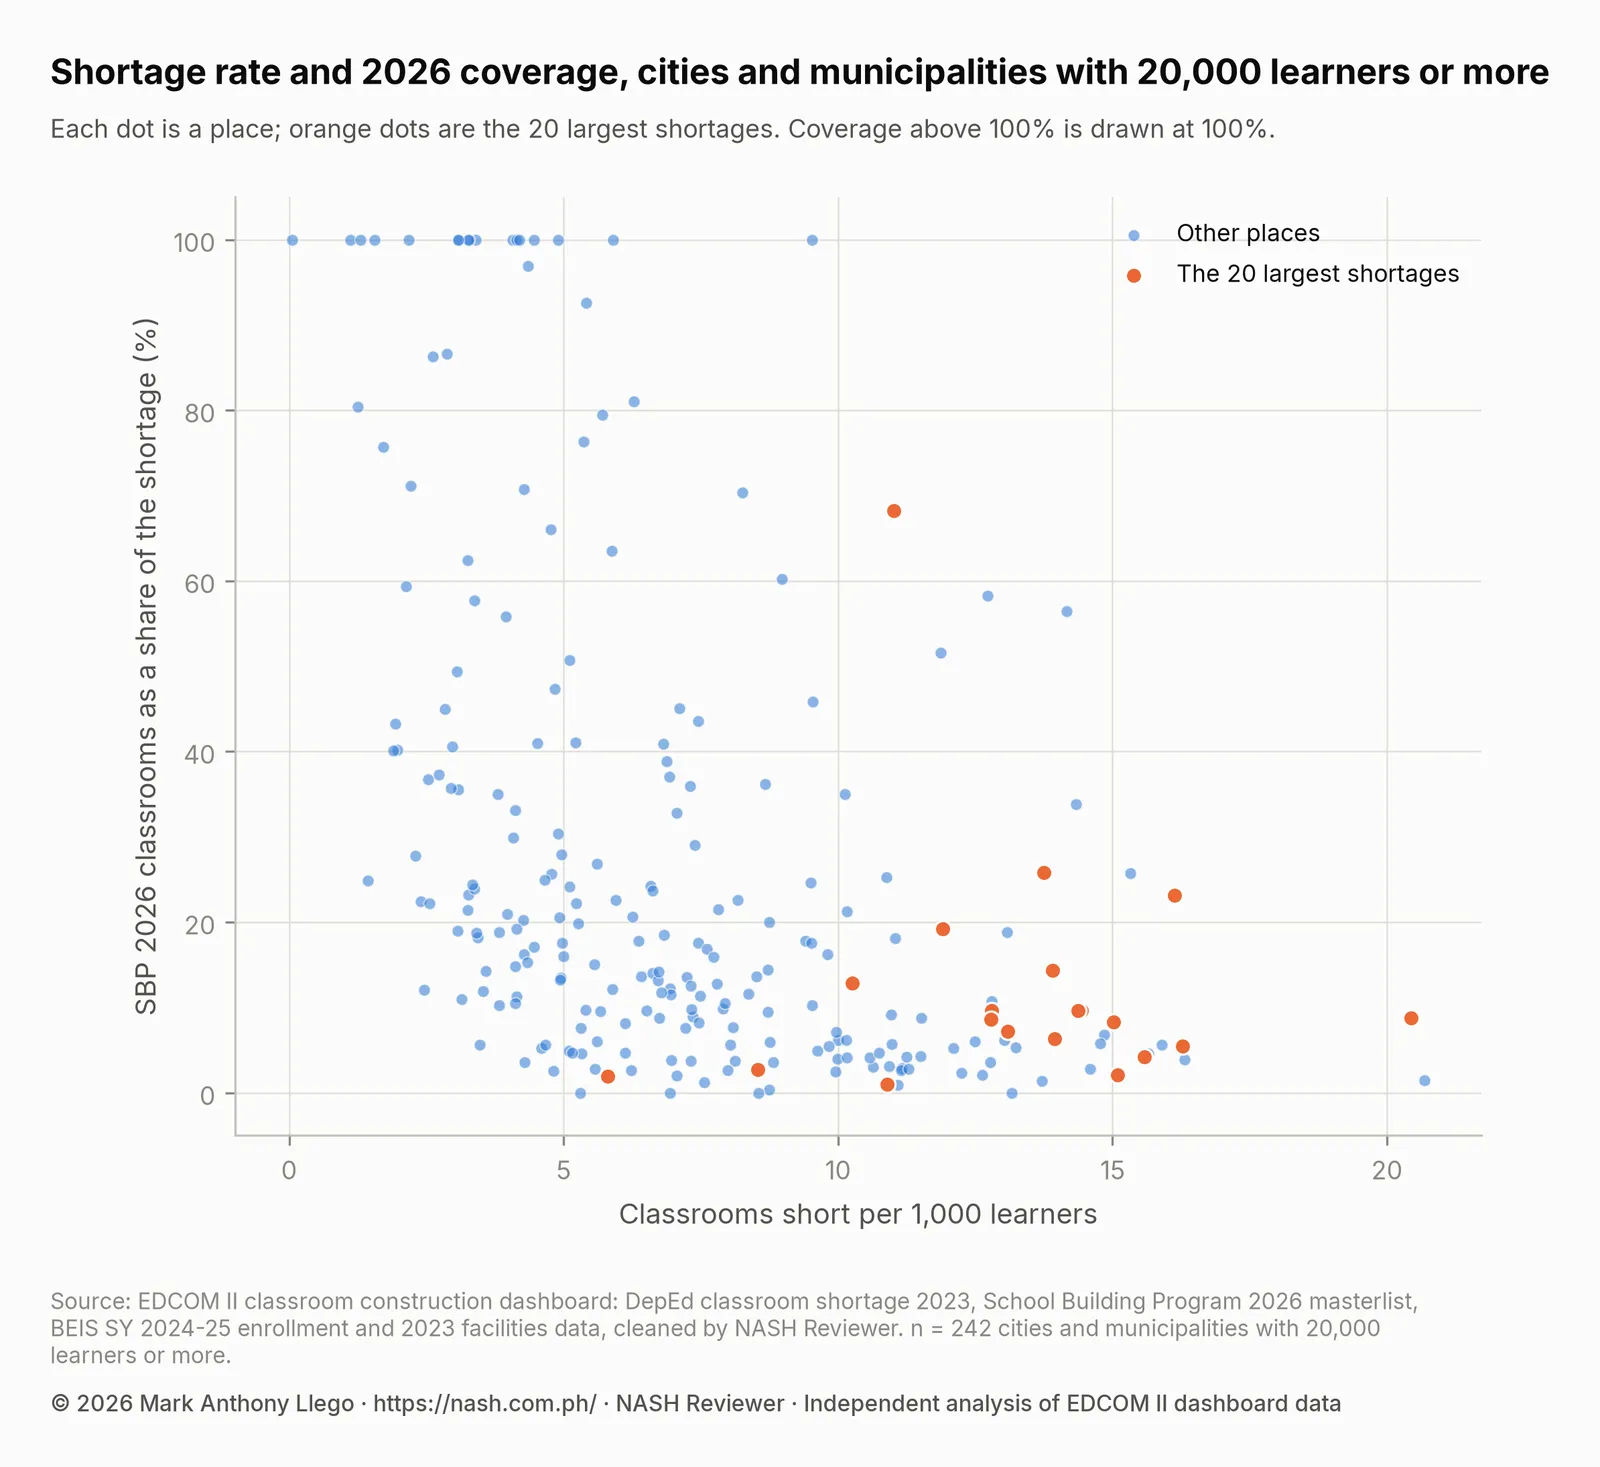
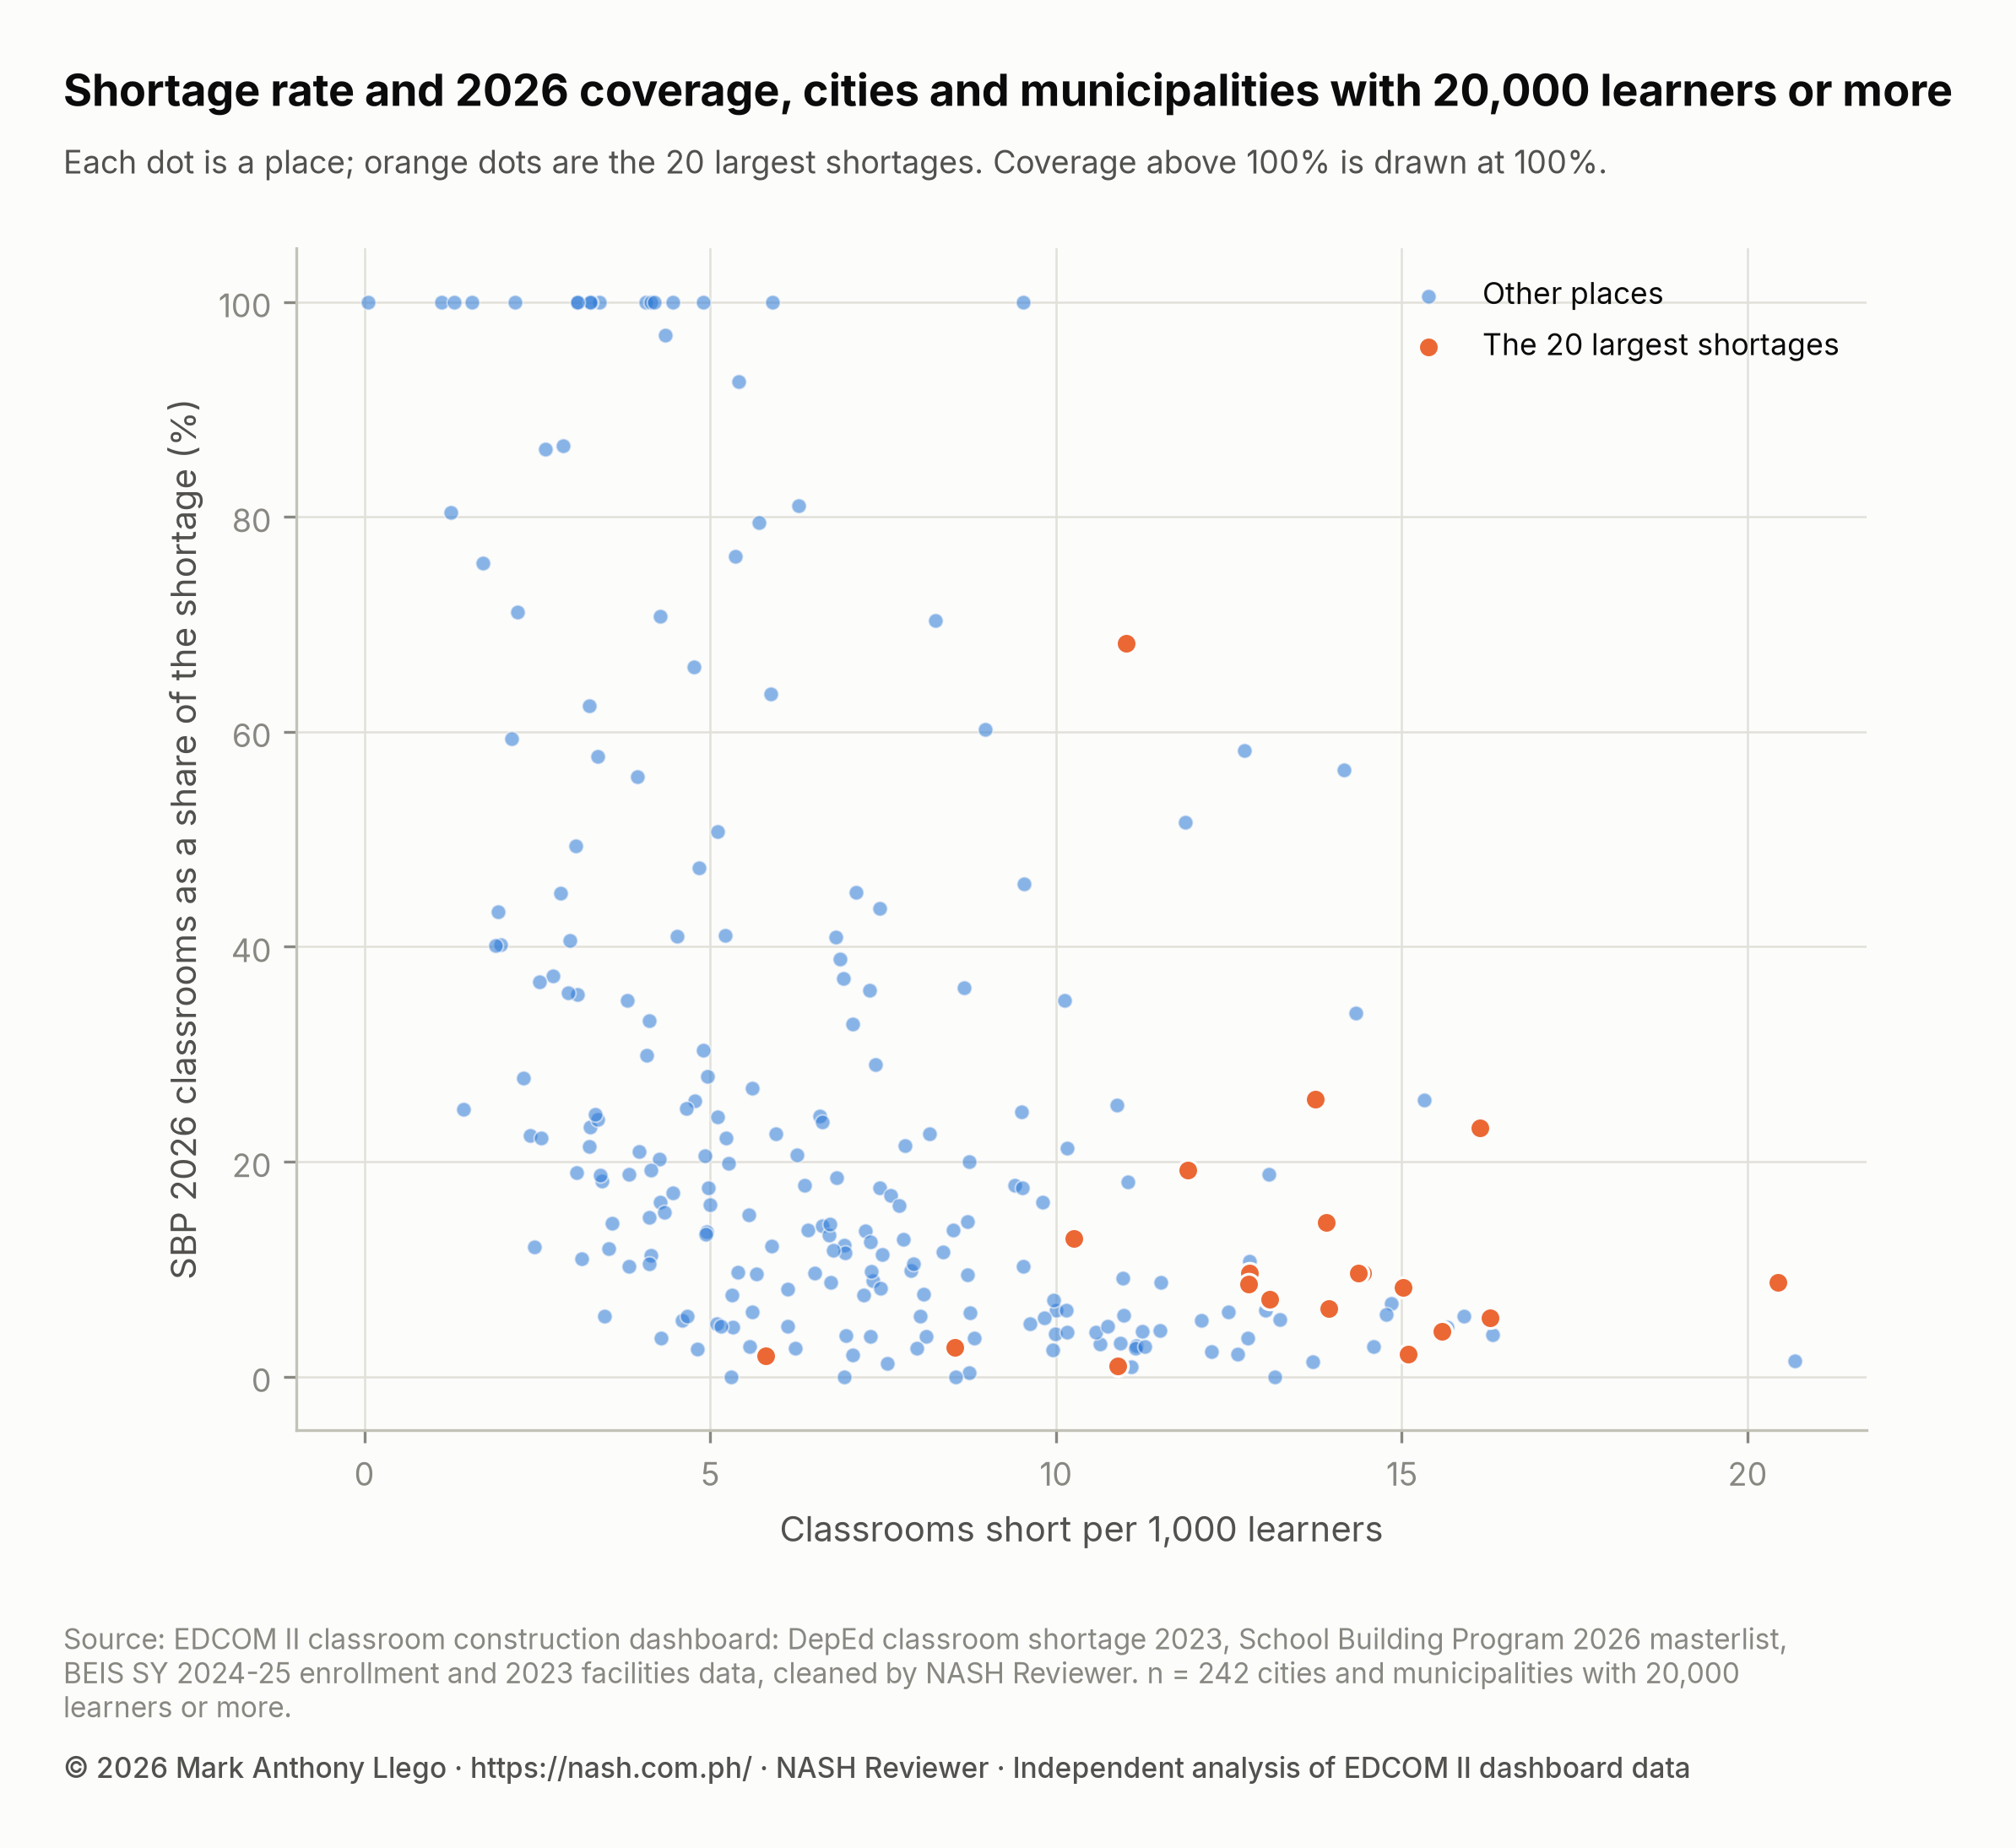
The cloud slopes downward. Places with low rates are spread across the full range of coverage, and several receive as many classrooms as their shortage or more. Places with high rates sit low. Most of the 20 largest shortages, in orange, are in the lower right, with high rates and low coverage; the City of Manila is the exception.
The rank correlation between rate and coverage is -0.54 (95% interval -0.63 to -0.44): the higher a place’s shortage per learner, the smaller the share of it the 2026 list tends to cover. Part of this is arithmetic. The shortage is the top of the rate and the bottom of coverage, so a place short of many classrooms for its size shows a high rate and, unless it receives many more classrooms than other places, a low coverage. The correlation describes how the list lines up with need on paper; it does not show how or why allocations were decided.
Cities and municipalities with a shortage and no SBP 2026 classroom
266 cities and municipalities with a 2023 shortage receive no SBP 2026 classroom. Between them, they are short 13,613 classrooms. The ten with the largest shortages:
| City or municipality | Province or city | Region | Income class | Schools | Learners (SY 2024-25) | Classroom shortage (2023) | Shortage per 1,000 learners | Schools on shifts |
|---|---|---|---|---|---|---|---|---|
| Datu Odin Sinsuat | Maguindanao del Norte | BARMM | 1st | 49 | 27,559 | 363 | 13.2 | 1 |
| South Upi | Maguindanao del Sur | BARMM | 2nd | 43 | 14,822 | 290 | 19.6 | 0 |
| Panglima Sugala | Tawi-Tawi | BARMM | 1st | 34 | 9,325 | 287 | 30.8 | 0 |
| City of Makati | City of Makati | NCR | 1st | 23 | 30,632 | 269 | 8.6 | 18 |
| Upi | Maguindanao del Norte | BARMM | 1st | 42 | 17,375 | 260 | 15.0 | 0 |
| Siasi | Sulu | Region IX | 1st | 53 | 12,535 | 216 | 16.6 | 0 |
| Maluso | Basilan | BARMM | 2nd | 18 | 11,824 | 209 | 17.7 | 1 |
| Sitangkai | Tawi-Tawi | BARMM | 1st | 14 | 7,683 | 200 | 26.0 | 1 |
| Masiu | Lanao del Sur | BARMM | 3rd | 47 | 13,961 | 198 | 14.2 | 0 |
| Sumisip | Basilan | BARMM | 1st | 36 | 11,144 | 188 | 16.9 | 0 |
Eight of the ten are in BARMM. A ninth, Siasi, is in Sulu, which these data count in Region IX, since the Sulu schools division moved to DepEd Region IX on 20 October 2026. Most of these towns have fewer than 20,000 learners, so they are left out of the rate ranking above, but their rates are high: Panglima Sugala, Tawi-Tawi, is short 30.8 classrooms per 1,000 learners and Sitangkai 26.0. The City of Makati, short 269 classrooms, is the only NCR city among them.
These data cannot say why a place received no classroom. A city such as Makati may build classrooms with its own funds, which the masterlist would not show. For BARMM, EDCOM II has noted that the Bangsamoro Organic Law (RA 11054), Article VI, Section 13, says national programs and projects such as the School Building Program “shall continue to be funded by the National Government”, and has reported that some national programs pulled back from BARMM after the law because of unclear interpretation (EDCOM II, 2025, November 13). Classroom Allocation by LGU Income Class, 2026 asks whether poorer municipalities receive less.
Places that receive more classrooms than their shortage
At the other end, 183 cities and municipalities receive more SBP 2026 classrooms than their 2023 shortage, 3,101 classrooms beyond it in all. The ten with the most classrooms beyond their shortage:
| City or municipality | Province or city | Region | Schools | Learners (SY 2024-25) | Classroom shortage (2023) | Shortage per 1,000 learners | SBP 2026 classrooms | Coverage | Classrooms beyond the shortage |
|---|---|---|---|---|---|---|---|---|---|
| Maragondon | Cavite | Region IV-A | 20 | 11,275 | 64 | 5.7 | 272 | 425.0% | 208 |
| City of Ilagan | Isabela | Region II | 99 | 33,645 | 104 | 3.1 | 281 | 271.1% | 177 |
| City of Urdaneta | Pangasinan | Region I | 64 | 31,360 | 35 | 1.1 | 142 | 408.0% | 107 |
| Gen. Mariano Alvarez | Cavite | Region IV-A | 11 | 34,429 | 328 | 9.5 | 408 | 124.4% | 80 |
| Echague | Isabela | Region II | 65 | 17,883 | 58 | 3.3 | 137 | 234.7% | 79 |
| Indang | Cavite | Region IV-A | 29 | 11,338 | 74 | 6.5 | 150 | 202.7% | 76 |
| Vintar | Ilocos Norte | Region I | 41 | 5,308 | 9 | 1.6 | 82 | 945.9% | 73 |
| San Fabian | Pangasinan | Region I | 34 | 17,998 | 48 | 2.7 | 107 | 222.9% | 59 |
| Ternate | Cavite | Region IV-A | 7 | 5,059 | 22 | 4.3 | 80 | 364.8% | 58 |
| Claveria | Cagayan | Region II | 31 | 5,381 | 5 | 0.9 | 60 | 1,200.0% | 55 |
Maragondon, Cavite, leads: 272 classrooms against a shortage of 64, or 208 beyond it. It is one of the three Cavite towns EDCOM II cited in its 20 October 2026 news release, with Maragondon at 272 classrooms against a shortage of 64, Tanza at 448 against 869 and Naic at 356 against 631 (EDCOM II, 2026, October 20); the cleaned data reproduce those figures. The Cavite deep dive reads them school by school. All 272 of Maragondon’s classrooms are PSIP III classrooms, still for bidding; 104 of them are at schools with no 2023 shortage; and 80 are on four lines that exactly repeat an earlier line of the masterlist. With no project ID in the masterlist, a second identical building at a school cannot be told apart from a double entry, so such lines are kept in the totals, as they are in the dashboard.
Four of the ten are in Cavite (Maragondon, Gen. Mariano Alvarez, Indang and Ternate), and the rest are in Regions I and II. The City of Ilagan, Isabela, receives 281 classrooms against a shortage of 104, and Claveria, Cagayan, 60 against 5. Gen. Mariano Alvarez is the only one of the ten with a rate above the national 7.4, at 9.5, and a sizable shortage of its own, 328 classrooms.
Classrooms beyond a 2023 count are not necessarily misplaced. Enrollment may have grown, rooms may have been damaged or condemned since 2023, and planners may weigh buildable land, site readiness and other needs that these data do not hold. The figures show where classrooms are planned, not why.
What this means for school heads
- Find your city or municipality. Filter the school table by
psgc_municipality_codeto see each school’s 2023 shortage (shortage_total), SBP 2026 classrooms (sbp_classrooms) and unmet shortage (shortage_unmet), and add them up for your place. How to Read DepEd Data: A Guide for Aspiring School Heads explains how to read such tables. - Quote both the count and the rate. The City of San Pedro is short 1,056 classrooms for 51,675 learners (20.4 per 1,000); the City of Davao is short 4,052 for 371,392 (10.9). The count shows how many rooms are needed, the rate how heavily the shortage weighs on each learner.
- Bring the figures to the local school board. All 20 places are first-income-class LGUs, and LGU-implemented lines carry 8,665 of the country’s SBP 2026 classrooms (DepEd School Building Program 2026 in Numbers). Set your school’s shortage and allocation beside your city’s totals.
- Write the need the 2023 count misses into the SIP and AIP. The 20 places have 720 schools running shifts. Record shifts, makeshift rooms and condemned rooms, with dates, in the school improvement plan and AIP; Class Shifts and Crowded Classrooms in DepEd Schools shows how shifting is measured.
- If your town receives more than its shortage, show what each room is for. Write in the SIP which shift, makeshift room or condemned building each new room replaces, and ask the division to confirm that repeated lines are separate buildings.
- Read PSIP III lines as future rooms. In the City of Manila, 1,813 of the 1,890 classrooms are PSIP III, with construction expected from March 2027 to July 2028, so plan for crowded rooms and shifts in the years before.
How these numbers were made
The data are the cleaned tables behind the EDCOM II classroom construction dashboard: DepEd’s 2023 classroom shortage by school, the SBP 2026 masterlist, and SY 2024-25 enrollment and class shifts from the Basic Education Information System (BEIS). How the EDCOM Classroom Data Was Cleaned documents every table and cleaning rule. Every figure here is computed from the school table, grouped by each school’s Philippine Standard Geographic Code (PSGC) city or municipality, so the shortage, learners, shifts and SBP classrooms share one base; names, provinces and income classes come from the city and municipality table. The analysis was done in Python with pandas and SciPy, and the charts drawn with Matplotlib.
- Places. The 1,642 cities and municipalities that have at least one school in the 2023 shortage table. The City of Manila counts as one place. A city’s figures follow the PSGC and can differ slightly from the schools division with the same name.
- Shortage and rate. A place’s shortage is the sum of its schools’ 2023 shortage, Kindergarten to Grade 10 plus senior high school. Its rate divides the shortage of its schools with SY 2024-25 learners by those learners and multiplies by 1,000. Rates are ranked only among the 242 places with 20,000 learners or more.
- SBP classrooms and coverage. A place’s SBP 2026 classrooms count every line at its schools, including schools with no 2023 shortage record and PSIP III lines still for bidding. Coverage is SBP classrooms divided by the shortage. Classrooms beyond the shortage are SBP classrooms minus the shortage, where positive. The unmet shortage subtracts, school by school, the SBP classrooms up to each school’s own shortage, and adds up the rest.
- Ranking. Places are ranked by shortage, with ties broken by learners.
- Concentration. The Lorenz curve sorts places from the smallest shortage to the largest and plots the cumulative share of places against the cumulative share of the shortage. The Gini coefficient is twice the area between that curve and the diagonal. The top 1%, 5% and 10% are the 16, 82 and 164 places with the largest shortages.
- Rank correlations. Spearman’s rho is the ordinary correlation of the two sets of ranks. Its 95% interval is the middle 95% of 1,000 bootstrap estimates, each computed on a sample of places drawn with replacement (Efron & Tibshirani, 1993). The rate-coverage correlation covers the 242 places with 20,000 learners or more.
Limits
The years differ: the shortage is from 2023, enrollment and shifts from SY 2024-25, and allocations from 2026, so a place’s need may have changed. The list shows plans, not buildings; half of the national list is PSIP III, still for bidding. At EDCOM II’s 16 October 2026 hearing, of the PHP 21.45 billion for 6,000 DPWH-led classrooms under the FY 2026 program, only PHP 1.87 billion, covering 533 classrooms, had reached the award or near-award stage (EDCOM II, 2026, October 20).
The shortage is DepEd’s own estimate, and not the whole need: the National Education Plan 2026-2035 puts the classrooms needed from current and projected deficits at 219,000 by 2028 (EDCOM II, 2026). Classrooms that cities and municipalities build with their own funds may not appear in the masterlist.
Schools are placed in cities and municipalities by their PSGC code, which may differ from EDCOM II’s matching and from division boundaries. The totals keep lines that exactly repeat an earlier line, as the dashboard does; nationally there are 103 such PSIP III lines, carrying 1,554 classrooms. The negative link between rate and coverage is partly built into the two measures, as explained above. All results are associations: they show how allocations line up with the 2023 shortage on paper, not why a place received what it did.
Frequently asked questions
Which city has the largest classroom shortage in the Philippines?
Quezon City, short 5,507 classrooms in DepEd’s 2023 data, or 13.1 per 1,000 learners. It has 398 classrooms on the SBP 2026 list, 7.2% of its shortage. The City of Davao (4,052) and the City of Caloocan (3,807) follow.
Which municipality has the largest classroom shortage?
Rodriguez, Rizal, the only municipality among the 20 places with the largest shortages. It is short 1,462 classrooms, 15.6 per 1,000 learners, and has 62 classrooms on the SBP 2026 list (4.2% of its shortage).
Which place has the highest classroom shortage per learner?
Among the 242 cities and municipalities with 20,000 learners or more, Bongao, Tawi-Tawi, with 20.7 classrooms short per 1,000 learners, against 7.4 nationally. Smaller places can be higher still: Panglima Sugala, also in Tawi-Tawi, is short 30.8 per 1,000 learners and receives no SBP 2026 classroom.
Why do some towns receive more classrooms than their shortage?
The masterlist does not say. 183 cities and municipalities receive more SBP 2026 classrooms than their 2023 shortage, 3,101 beyond it in all. Need may have grown since 2023, and planners may weigh things the shortage count does not hold. In Maragondon, which leads with 272 classrooms against 64, 80 of the classrooms are on lines that exactly repeat an earlier line of the masterlist.
Download the data and cite this post
The cleaned EDCOM II classroom data behind this series are free to download for personal study; to reuse them, email support@nash.com.ph for written permission first. How the EDCOM Classroom Data Was Cleaned explains every table and cleaning rule. The files are at data.nash.com.ph: start with the README, then the school table (Parquet, or CSV), the School Building Program lines (CSV), the city and municipality table (CSV), and every table for Stata and SPSS. Every figure in this post can be computed from the school table, grouped by psgc_municipality_code, with names, provinces and income classes from the city and municipality table.
Every file, with its rows, columns and checksum, is listed on the EDCOM II classroom data page. To cite the data: Llego, M. A. (2026). EDCOM II classroom construction dashboard data, cleaned, version 1.1. NASH Reviewer. https://nash.com.ph/edcom-classroom-data
To cite this post: Llego, M. A. (2026, October 28). Top 20 cities and municipalities by classroom shortage. NASH Reviewer Blog. https://nash.com.ph/blog/cities-municipalities-largest-classroom-shortage
References
- Efron, B., & Tibshirani, R. J. (1993). An introduction to the bootstrap. Chapman & Hall.
- Gini, C. (1912). Variabilità e mutabilità. Tipografia di Paolo Cuppini.
- Llego, M. A. (2026). EDCOM II classroom construction dashboard data, cleaned, version 1.1 [Data set]. NASH Reviewer. https://nash.com.ph/edcom-classroom-data
- Lorenz, M. O. (1905). Methods of measuring the concentration of wealth. Publications of the American Statistical Association, 9(70), 209–219.
- Second Congressional Commission on Education (EDCOM II). (2025, November 13). Clarity needed on the implementation of 23 national education laws in BARMM [News release].
- Second Congressional Commission on Education (EDCOM II). (2026). National Education Plan 2026–2035 (Year Three report).
- Second Congressional Commission on Education (EDCOM II). (2026, October 20). Put classrooms where they’re needed most, EDCOM 2 tells DepEd [News release]. https://edcom2.gov.ph/put-classrooms-where-theyre-needed-most-edcom-2-tells-deped/
- Spearman, C. (1904). The proof and measurement of association between two things. American Journal of Psychology, 15(1), 72–101.
More in this series
- How the EDCOM Classroom Data Was Cleaned
- Philippine Classroom Shortage 2023: Where the Gap Is
- DepEd School Building Program 2026 in Numbers
- Do 2026 Classrooms Go Where the Shortage Is?
- Classroom Allocation by LGU Income Class, 2026
- Class Shifts and Crowded Classrooms in DepEd Schools
- Last Mile Schools: Classroom Need and 2026 Allocation
- Regional reports: NCR, CAR, Region I, Region II, Region III, Region IV-A, MIMAROPA, Region V, Region VI, NIR, Region VII, Region VIII, Region IX, Region X, Region XI, Region XII, Caraga, BARMM
- Rankings and deep dives: Congressional districts, Top 20 cities and municipalities, Rizal, Quezon City, City of Manila, Tawi-Tawi, Cavite, Cost of a classroom
- Explainers: PSIP III, Senior high shortage, Junior high shortage, Excess classrooms, Learning Continuity Spaces, How learners reach school
- For teachers and school heads: Action research and thesis topics
- Related: DepEd Classroom and School Building Data, SY 2023-2024, EDCOM II Final Report: Guide for Aspiring School Heads, National Education Plan 2026-2035: Guide for School Heads, DepEd School Improvement Plan (SIP): Steps, AIP and SRC, How to Read DepEd Data: A Guide for Aspiring School Heads
Analysis and charts by Mark Anthony Llego for NASH Reviewer. Data: EDCOM II classroom construction dashboard and Department of Education data. NASH Reviewer is not affiliated with EDCOM II or DepEd. Charts may be reused only with written permission from support@nash.com.ph.