Rizal, 2nd District has the largest classroom shortage of any congressional district in the Philippines: 4,522 classrooms in 2023, according to DepEd’s classroom shortage data as published in the EDCOM II classroom construction dashboard. Rizal, 1st District follows with 3,993 and City of Caloocan, 1st District with 3,324. Measured against learners, Tawi-Tawi, Lone District is short the most: 24.2 classrooms for every 1,000 learners enrolled in SY 2024-25, against 7.4 nationally.
The classrooms planned under the School Building Program (SBP) 2026 line up only loosely with these shortages. Across the 247 ranked districts, the rank correlation between a district’s 2023 shortage and its SBP classrooms is 0.08 (95% interval -0.06 to 0.21), close to none. The 10 districts with the largest shortages hold 16.9% of the national shortage and 7.3% of the 31,907 SBP classrooms that can be placed in a district, and districts short more classrooms per learner tend to have a smaller share of their shortage on the list.
Districts are ranked below by DepEd’s 2023 shortage, by the shortage per learner and by their SBP 2026 classrooms, from the cleaned school-level data described in How the EDCOM Classroom Data Was Cleaned; every file is listed on the EDCOM II classroom data page. District names are DepEd’s 2023 labels, and the full table of all 259 districts is in the last section before the questions. The figures show where the shortage and the 2026 classrooms are, not why, and a district’s figures say nothing about the work of any official.
Key findings
- Rizal, 2nd District has the largest 2023 classroom shortage of the 247 ranked districts, 4,522 classrooms, followed by Rizal, 1st District (3,993) and City of Caloocan, 1st District (3,324); the median district is short 513.
- Among the 237 districts with 20,000 learners or more, Tawi-Tawi, Lone District has the highest shortage per learner, 24.2 classrooms per 1,000 learners, and 92 districts are above the national rate of 7.4.
- The shortage is concentrated: 54 districts hold half of it, and the 25 with the largest shortages, a tenth of the ranked districts, hold 31.0%.
- A district’s SBP 2026 classrooms show almost no relation to its 2023 shortage: Spearman’s rank correlation is 0.08 (95% interval -0.06 to 0.21), against 0.34 among cities and municipalities.
- The 10 districts with the largest shortages hold 16.9% of the national shortage and 7.3% of the SBP classrooms that have a district.
- The median district’s SBP classrooms equal 17.2% of its shortage; 40 districts are under 5%, 17 are at 100% or more, and 8 districts with a shortage have none, four of them in BARMM.
- Most of the uneven spread lies inside districts: 78.6% of the Theil index of the shortage relative to learners lies between schools in the same district and 21.4% between districts.
The congressional districts with the largest classroom shortages
DepEd’s 2023 shortage table labels each of its 47,659 schools with a congressional district, the legislative district that elects a member of the House of Representatives. These are not DepEd’s school districts, which group schools under a district supervisor. After labels that differ only in capitalization are merged, the table holds 259 districts; the 247 with four or more schools are ranked here, and the method section explains the rest. Of the 247, 40 carry the label “Lone District”.
Their shortages differ widely. The middle half of the ranked districts are short between 298 and 830 classrooms, with a median of 513. The largest shortage is Rizal, 2nd District’s 4,522; the smallest is Batanes, Lone District’s 7.
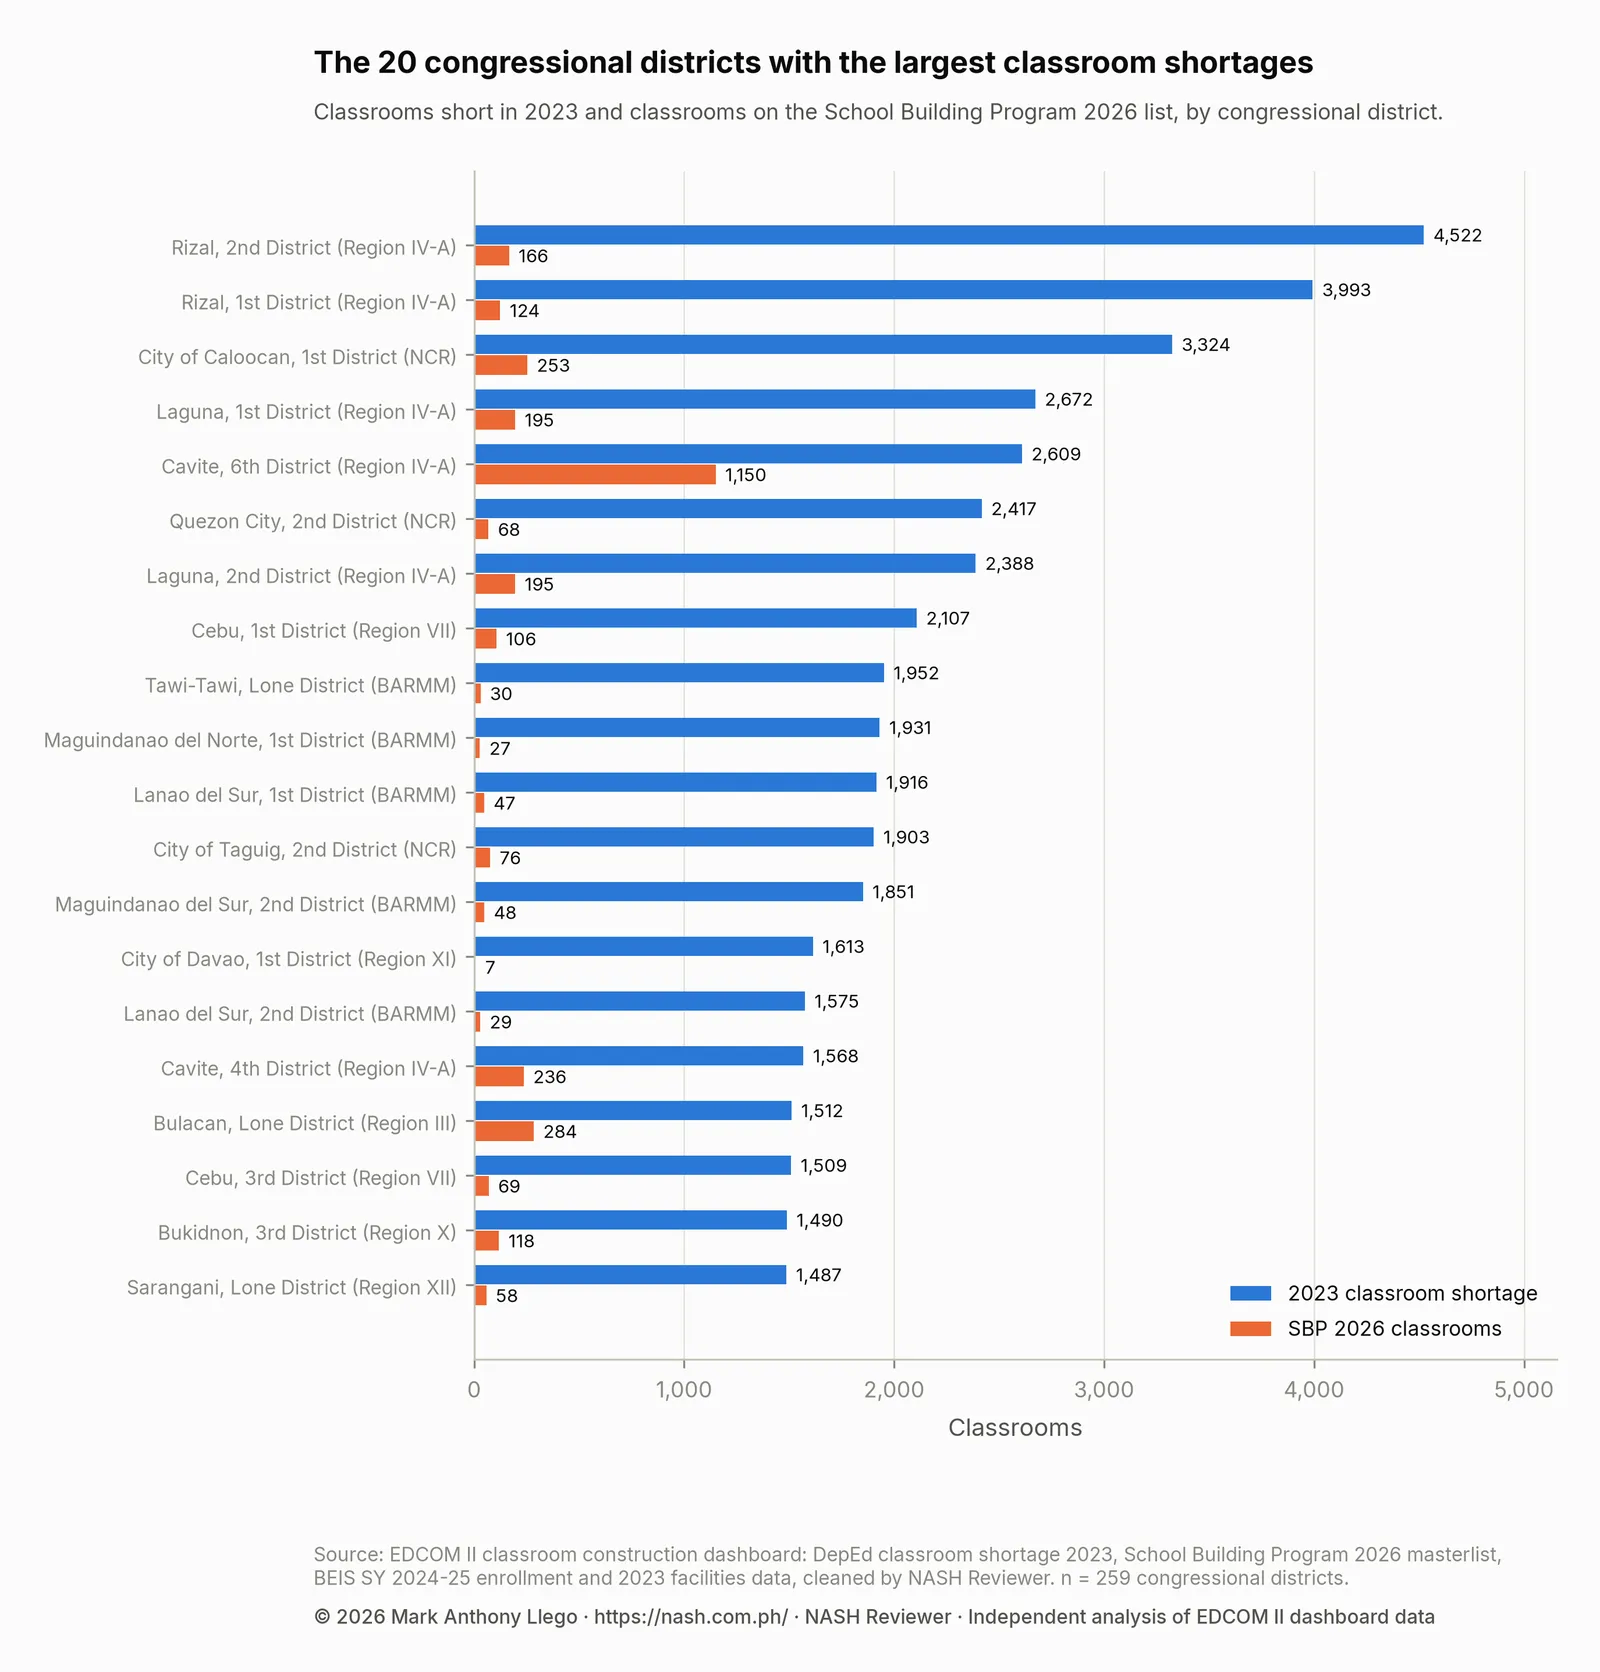
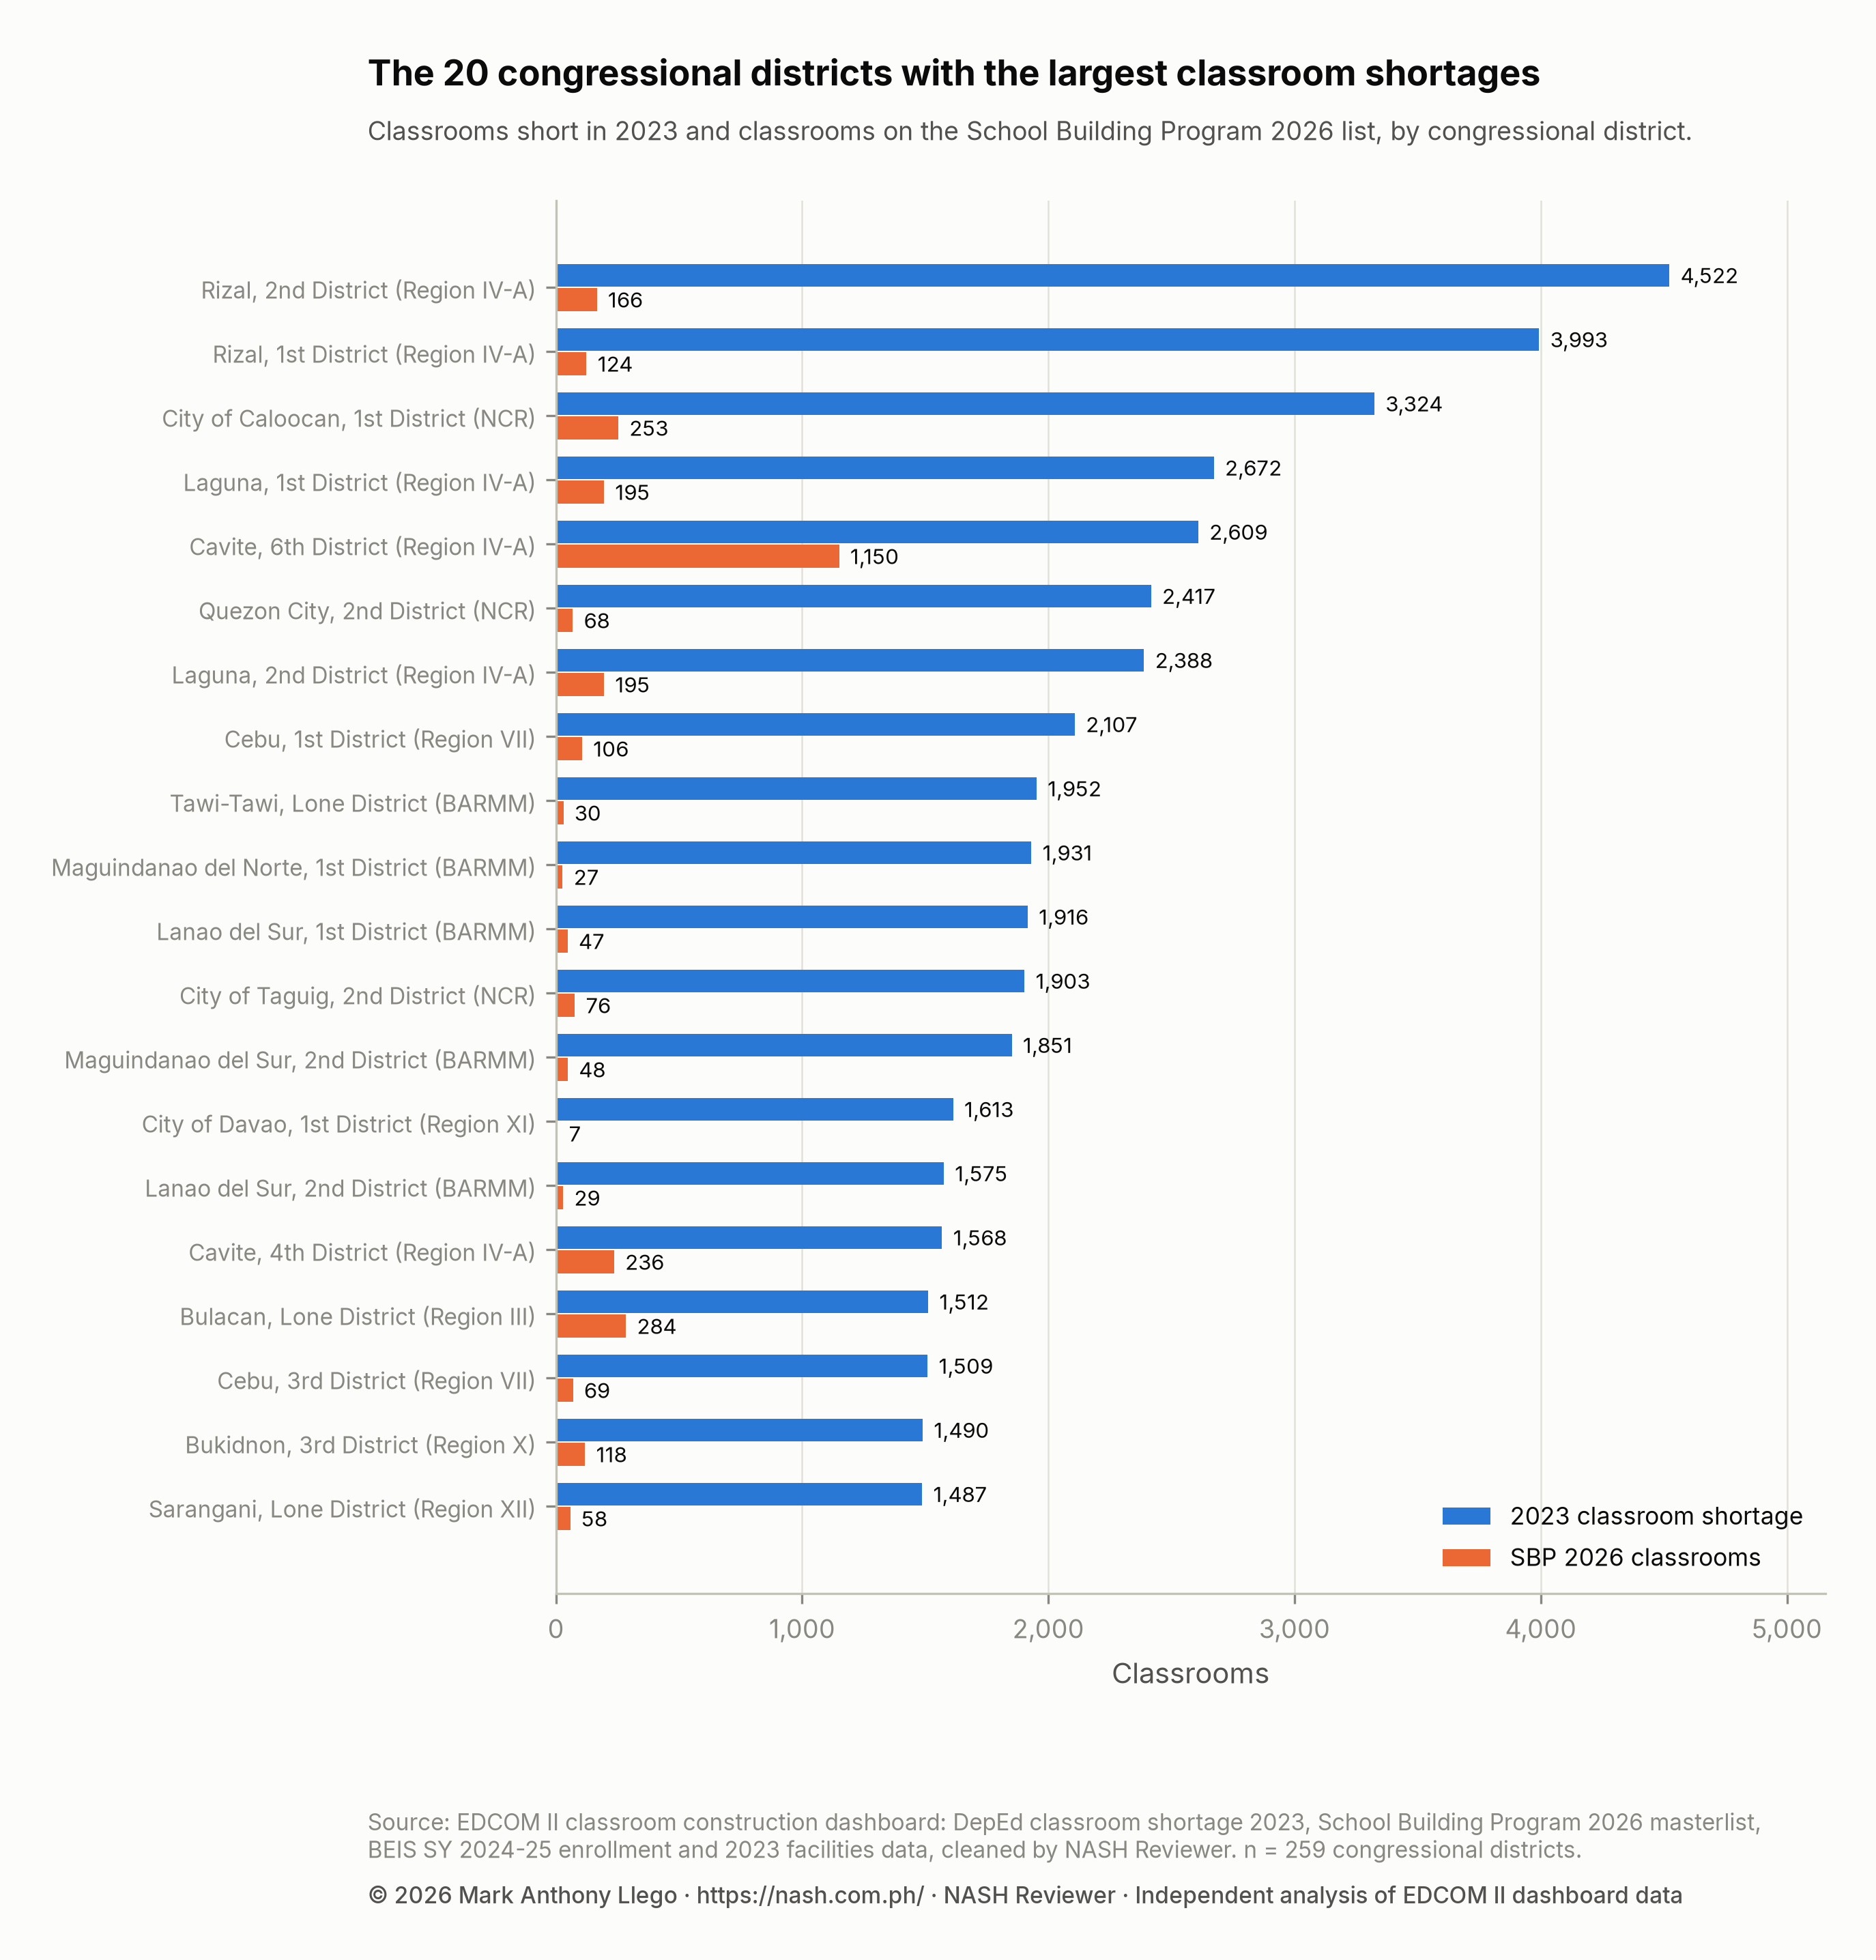
Six of the 20 districts are in Region IV-A, five in BARMM and three in NCR. In every one, the orange bar is shorter than the blue one. Coverage, a district’s SBP 2026 classrooms as a share of its 2023 shortage, ranges from 0.4% in City of Davao, 1st District to 18.8% in Bulacan, Lone District, with one exception: in Cavite, 6th District, 1,150 classrooms equal 44.1% of a shortage of 2,609.
| District | Region | Schools | Learners (SY 2024-25) | Classroom shortage (2023) | Shortage per 1,000 learners | SBP 2026 classrooms | Coverage |
|---|---|---|---|---|---|---|---|
| Rizal, 2nd District | Region IV-A | 246 | 344,060 | 4,522 | 13.1 | 166 | 3.7% |
| Rizal, 1st District | Region IV-A | 123 | 286,906 | 3,993 | 13.9 | 124 | 3.1% |
| City of Caloocan, 1st District | NCR | 65 | 212,990 | 3,324 | 15.6 | 253 | 7.6% |
| Laguna, 1st District | Region IV-A | 95 | 177,684 | 2,672 | 15.0 | 195 | 7.3% |
| Cavite, 6th District | Region IV-A | 85 | 202,665 | 2,609 | 12.9 | 1,150 | 44.1% |
| Quezon City, 2nd District | NCR | 20 | 128,437 | 2,417 | 18.8 | 68 | 2.8% |
| Laguna, 2nd District | Region IV-A | 141 | 192,004 | 2,388 | 12.1 | 195 | 8.2% |
| Cebu, 1st District | Region VII | 246 | 179,749 | 2,107 | 11.7 | 106 | 5.0% |
| Tawi-Tawi, Lone District | BARMM | 262 | 80,627 | 1,952 | 24.2 | 30 | 1.5% |
| Maguindanao del Norte, 1st District | BARMM | 346 | 171,531 | 1,931 | 11.2 | 27 | 1.4% |
| Lanao del Sur, 1st District | BARMM | 460 | 146,708 | 1,916 | 13.0 | 47 | 2.5% |
| City of Taguig, 2nd District | NCR | 32 | 122,446 | 1,903 | 15.5 | 76 | 4.0% |
| Maguindanao del Sur, 2nd District | BARMM | 315 | 138,001 | 1,851 | 13.3 | 48 | 2.6% |
| City of Davao, 1st District | Region XI | 71 | 129,070 | 1,613 | 12.5 | 7 | 0.4% |
| Lanao del Sur, 2nd District | BARMM | 399 | 109,761 | 1,575 | 14.3 | 29 | 1.8% |
| Cavite, 4th District | Region IV-A | 40 | 112,680 | 1,568 | 13.9 | 236 | 15.1% |
| Bulacan, Lone District | Region III | 57 | 126,952 | 1,512 | 11.9 | 284 | 18.8% |
| Cebu, 3rd District | Region VII | 291 | 153,749 | 1,509 | 9.8 | 69 | 4.6% |
| Bukidnon, 3rd District | Region X | 275 | 118,345 | 1,490 | 12.5 | 118 | 7.9% |
| Sarangani, Lone District | Region XII | 323 | 141,057 | 1,487 | 10.4 | 58 | 3.9% |
Classroom Shortage in Rizal and Antipolo, 2023–2026 reads the province, with the City of Antipolo, school by school; the Quezon City deep dive does the same for Quezon City’s six districts, and the Tawi-Tawi deep dive for the province with the highest rate. Top 20 Cities and Municipalities by Classroom Shortage ranks cities and municipalities the same way.
Classroom shortage per 1,000 learners by congressional district
Counts favor large districts. The shortage per 1,000 learners divides a district’s 2023 shortage by its SY 2024-25 learners, so districts of different sizes can be compared. A district with few learners can swing to an extreme rate on a handful of classrooms, so rates are ranked only among the 237 districts with 20,000 learners or more, as Philippine Classroom Shortage 2023: Where the Gap Is ranks divisions. Smaller districts keep their rates in the full table; one of them, Maguindanao del Sur, 1st District, at 28.1 for 3,056 learners, would otherwise top the list.
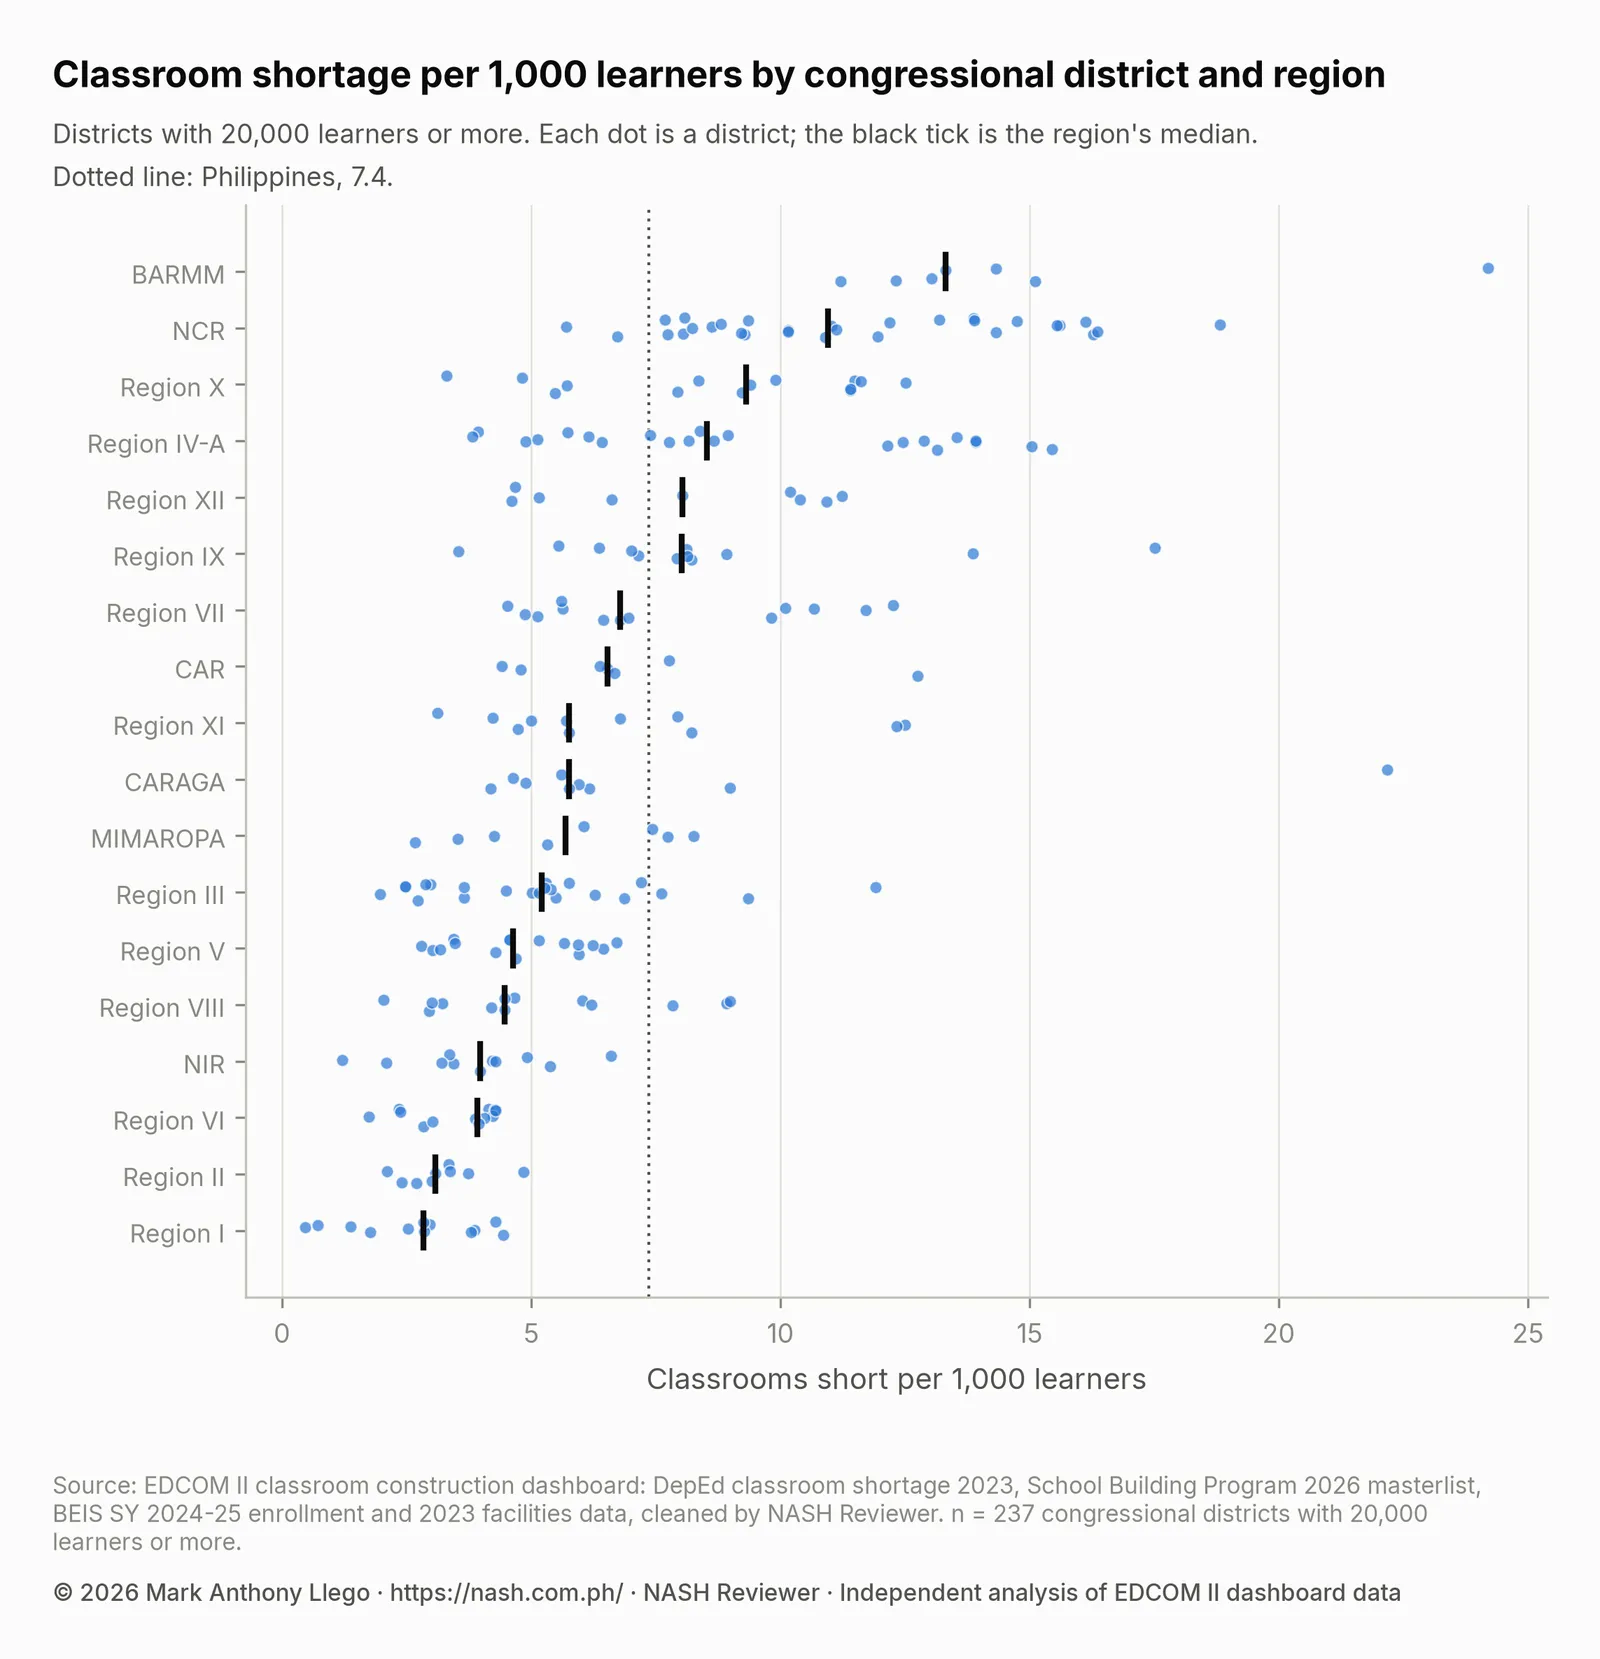
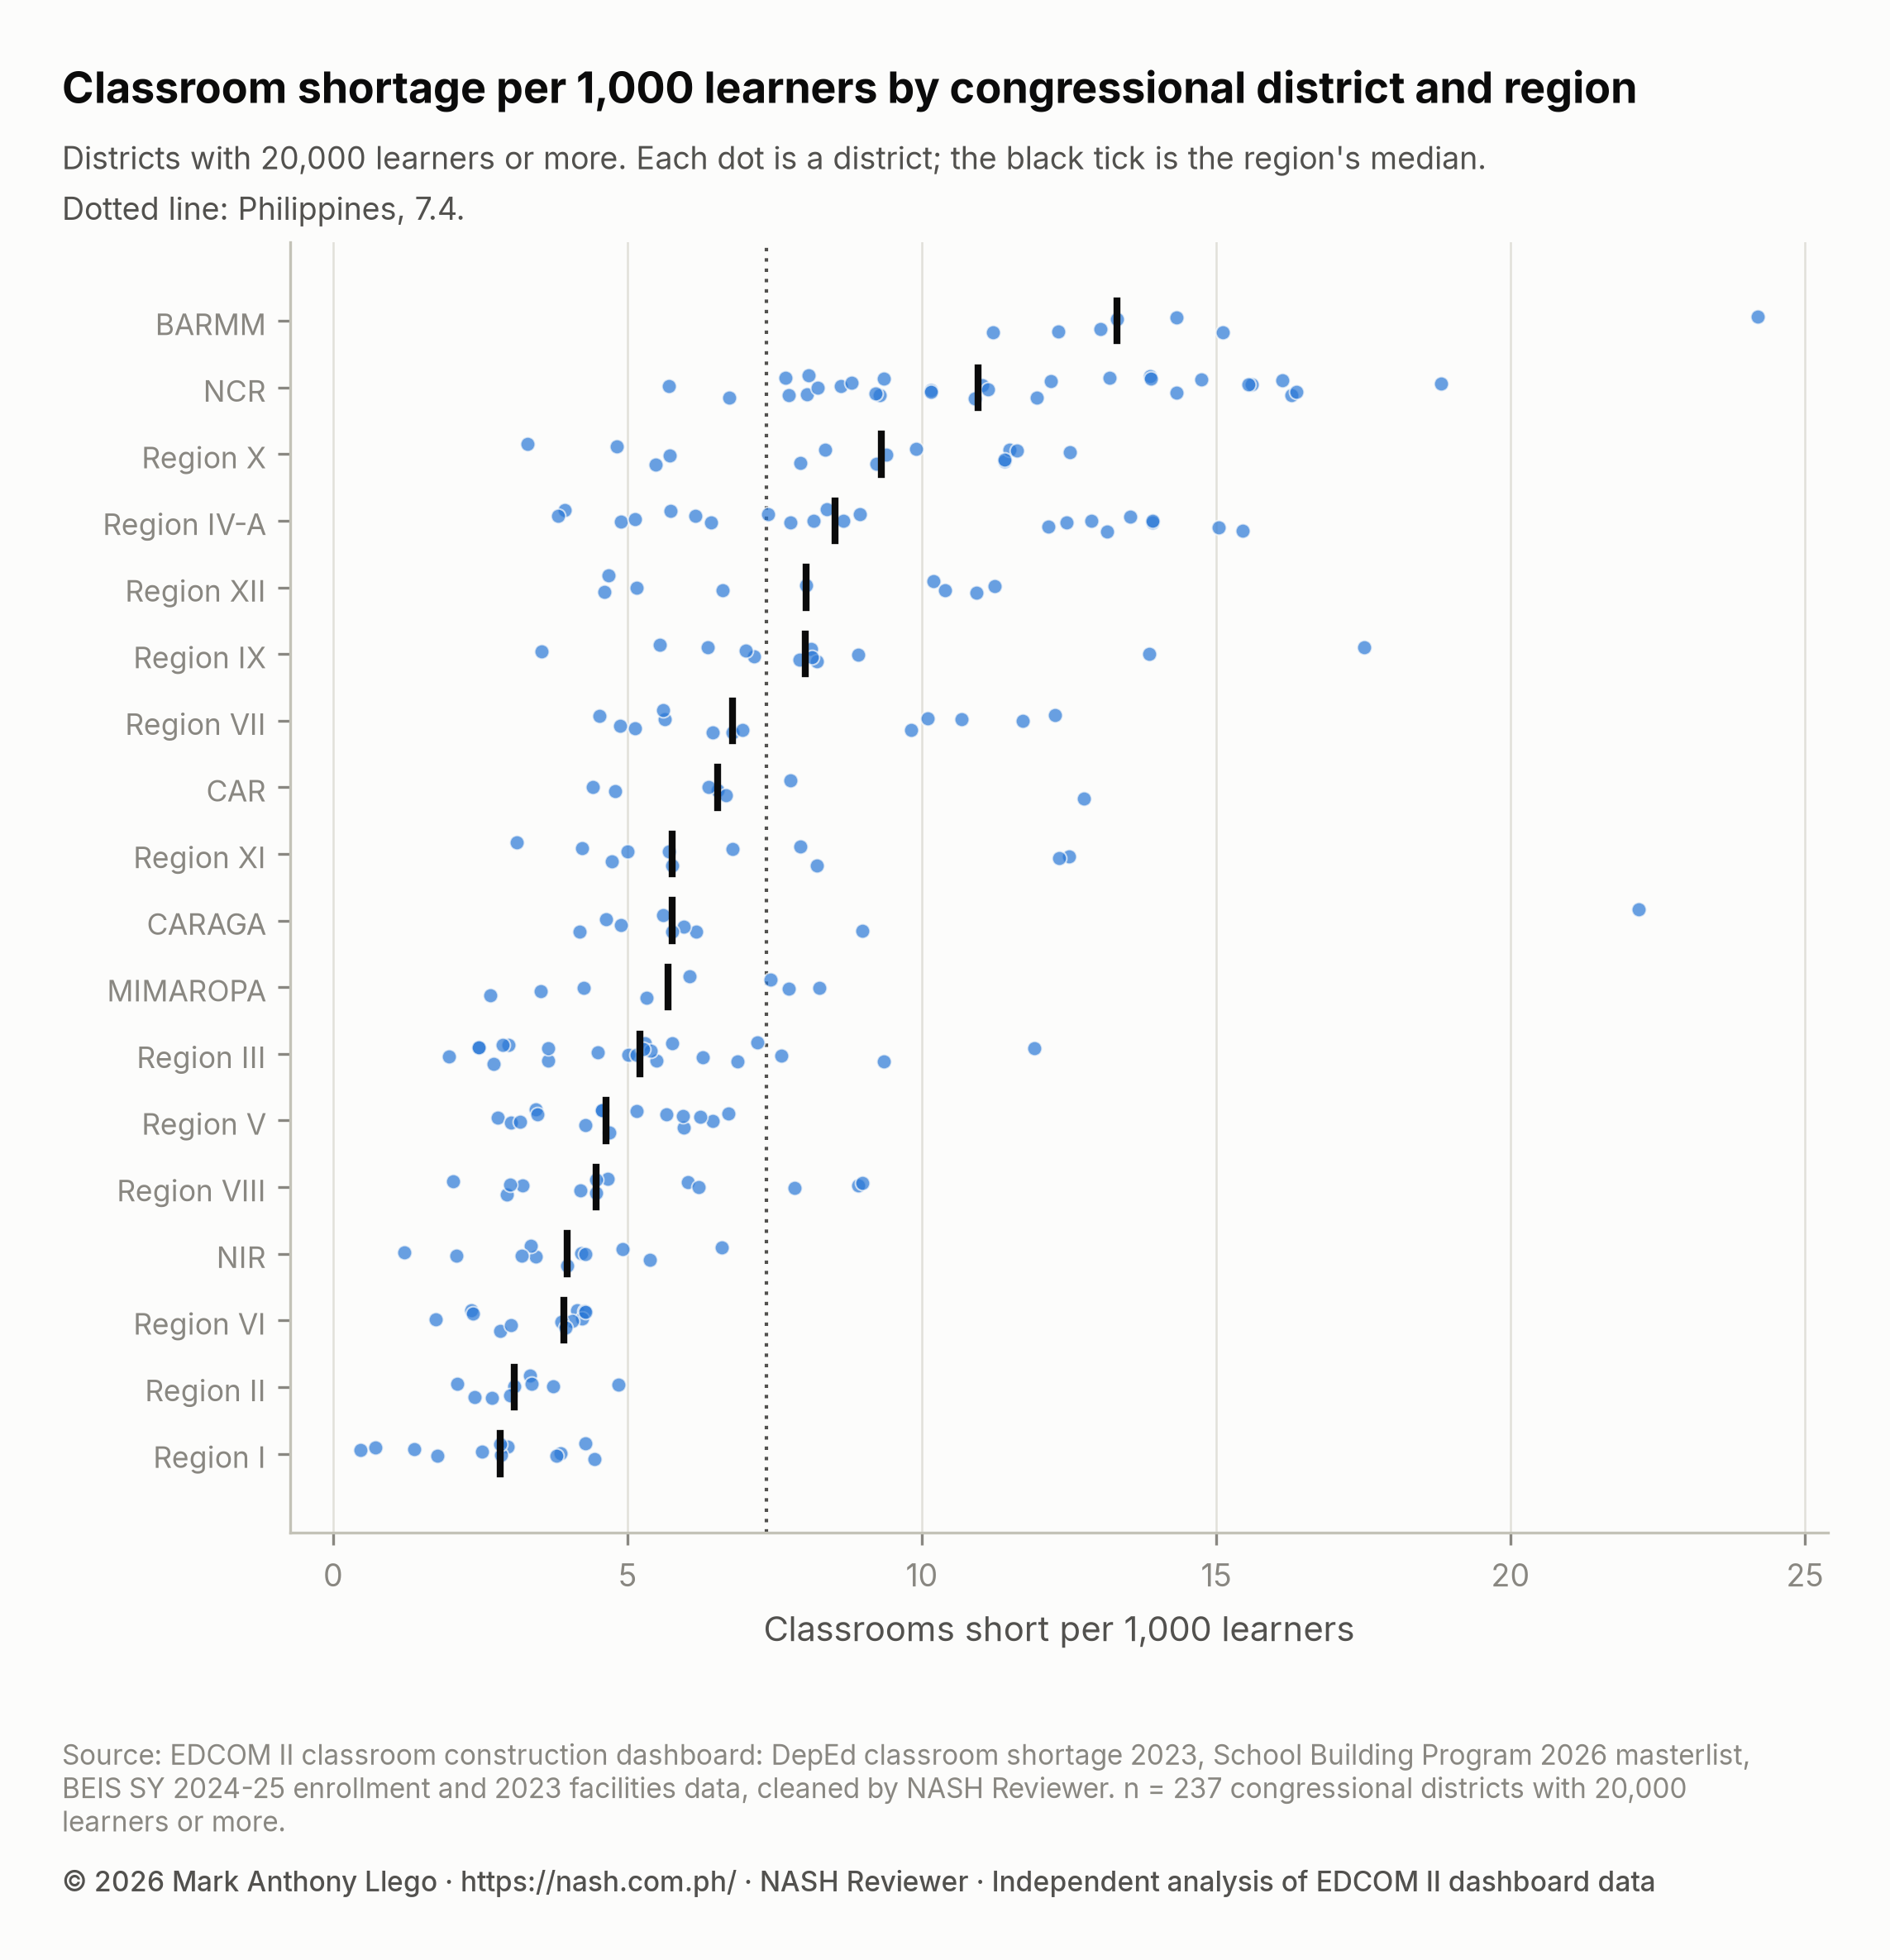
The middle half of districts are short between 4.2 and 9.3 classrooms per 1,000 learners, with a median of 6.0. 92 districts are above the national rate of 7.4, and 13 are at twice it or more. The regions’ medians run from 13.3 in BARMM and 11.0 in NCR down to 2.8 in Region I, but each region also has its own spread: Dinagat Islands, Lone District (22.2) stands far above the rest of CARAGA, and Sulu, 2nd District (17.5) above the rest of Region IX. The lowest rate is Ilocos Norte, 1st District’s 0.5.
| District | Region | Schools | Learners (SY 2024-25) | Classroom shortage (2023) | Shortage per 1,000 learners | SBP 2026 classrooms | Coverage |
|---|---|---|---|---|---|---|---|
| Tawi-Tawi, Lone District | BARMM | 262 | 80,627 | 1,952 | 24.2 | 30 | 1.5% |
| Dinagat Islands, Lone District | CARAGA | 142 | 28,139 | 624 | 22.2 | 25 | 4.0% |
| Quezon City, 2nd District | NCR | 20 | 128,437 | 2,417 | 18.8 | 68 | 2.8% |
| Sulu, 2nd District | Region IX | 218 | 51,832 | 916 | 17.5 | 23 | 2.5% |
| City of Manila, 1st District | NCR | 18 | 62,445 | 1,022 | 16.4 | 638 | 62.4% |
| City of Las Piñas, Lone District | NCR | 39 | 90,254 | 1,469 | 16.3 | 80 | 5.4% |
| City of Malabon, Lone District | NCR | 42 | 68,507 | 1,105 | 16.1 | 256 | 23.2% |
| City of Caloocan, 1st District | NCR | 65 | 212,990 | 3,324 | 15.6 | 253 | 7.6% |
| City of Taguig, 2nd District | NCR | 32 | 122,446 | 1,903 | 15.5 | 76 | 4.0% |
| Cavite, 3rd District | Region IV-A | 31 | 69,872 | 1,079 | 15.4 | 24 | 2.2% |
| Basilan, Lone District | BARMM | 229 | 77,926 | 1,178 | 15.1 | 12 | 1.0% |
| Laguna, 1st District | Region IV-A | 95 | 177,684 | 2,672 | 15.0 | 195 | 7.3% |
| City of Parañaque, 2nd District | NCR | 17 | 48,078 | 709 | 14.7 | 20 | 2.8% |
| City of Navotas, Lone District | NCR | 25 | 46,219 | 662 | 14.3 | 224 | 33.8% |
| Lanao del Sur, 2nd District | BARMM | 399 | 109,761 | 1,575 | 14.3 | 29 | 1.8% |
| Rizal, 1st District | Region IV-A | 123 | 286,906 | 3,993 | 13.9 | 124 | 3.1% |
| Cavite, 4th District | Region IV-A | 40 | 112,680 | 1,568 | 13.9 | 236 | 15.1% |
| Quezon City, 5th District | NCR | 29 | 97,830 | 1,359 | 13.9 | 36 | 2.6% |
| City of Valenzuela, 2nd District | NCR | 30 | 56,338 | 782 | 13.9 | 16 | 2.0% |
| Sulu, 1st District | Region IX | 230 | 90,709 | 1,257 | 13.9 | 81 | 6.4% |
Ten of the 20 districts with the highest rates are in NCR, four in Region IV-A and three in BARMM; the last five share a rounded rate of 13.9. Tawi-Tawi, Lone District’s rate, 24.2, is also the Tawi-Tawi division’s, the highest division rate in the national post. City of Manila, 1st District combines a high rate, 16.4, with coverage of 62.4%; the City of Manila deep dive reads the city’s six districts school by school.
Do SBP 2026 classrooms follow the district shortage?
Of the 32,419 SBP 2026 classrooms, 31,907 are at schools in DepEd’s 2023 shortage table and so carry a district label. The other 512 are at schools with no 2023 record and have no district; they count in national totals only. The district classrooms equal 19.3% of the national shortage, against 19.6% for all SBP classrooms.
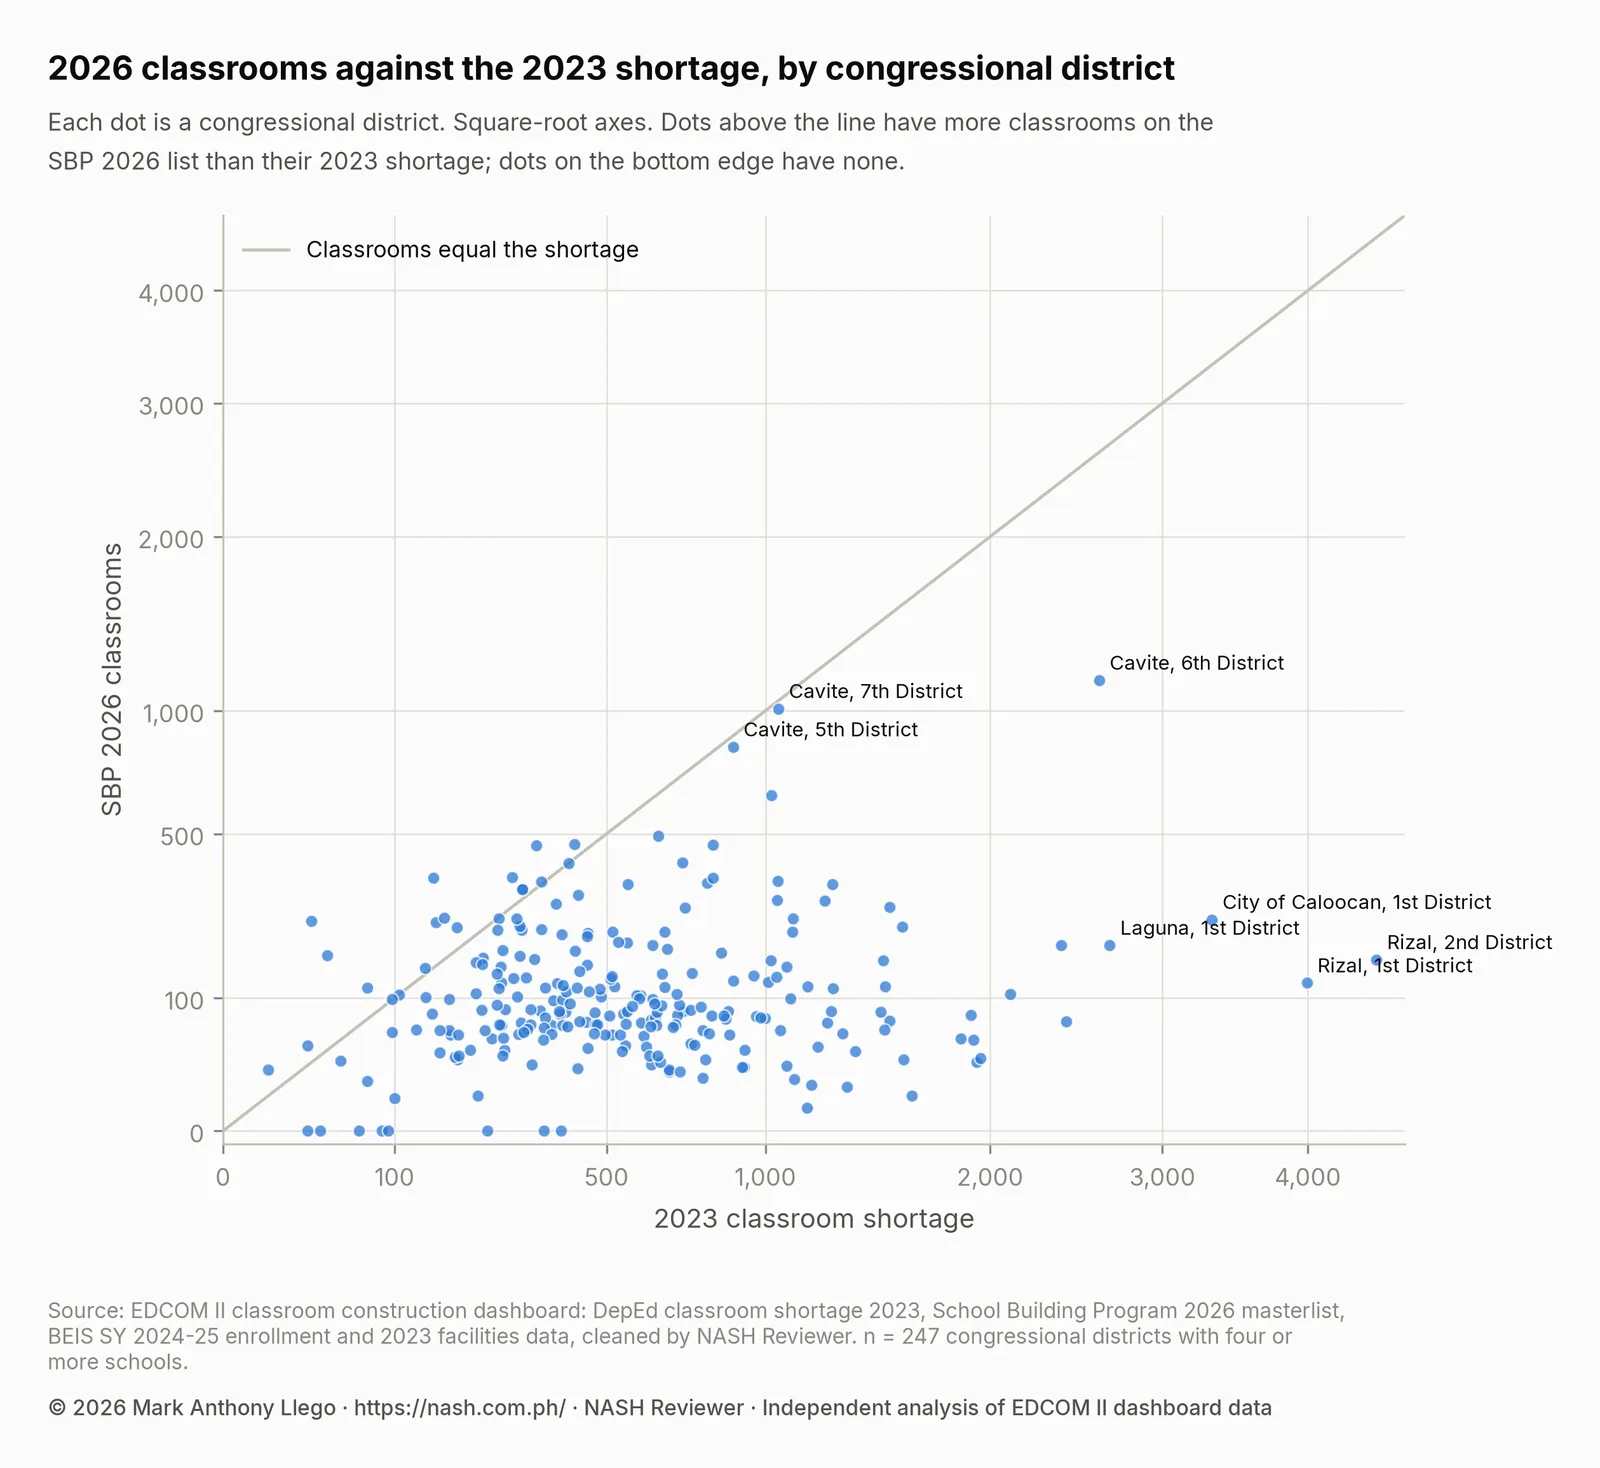
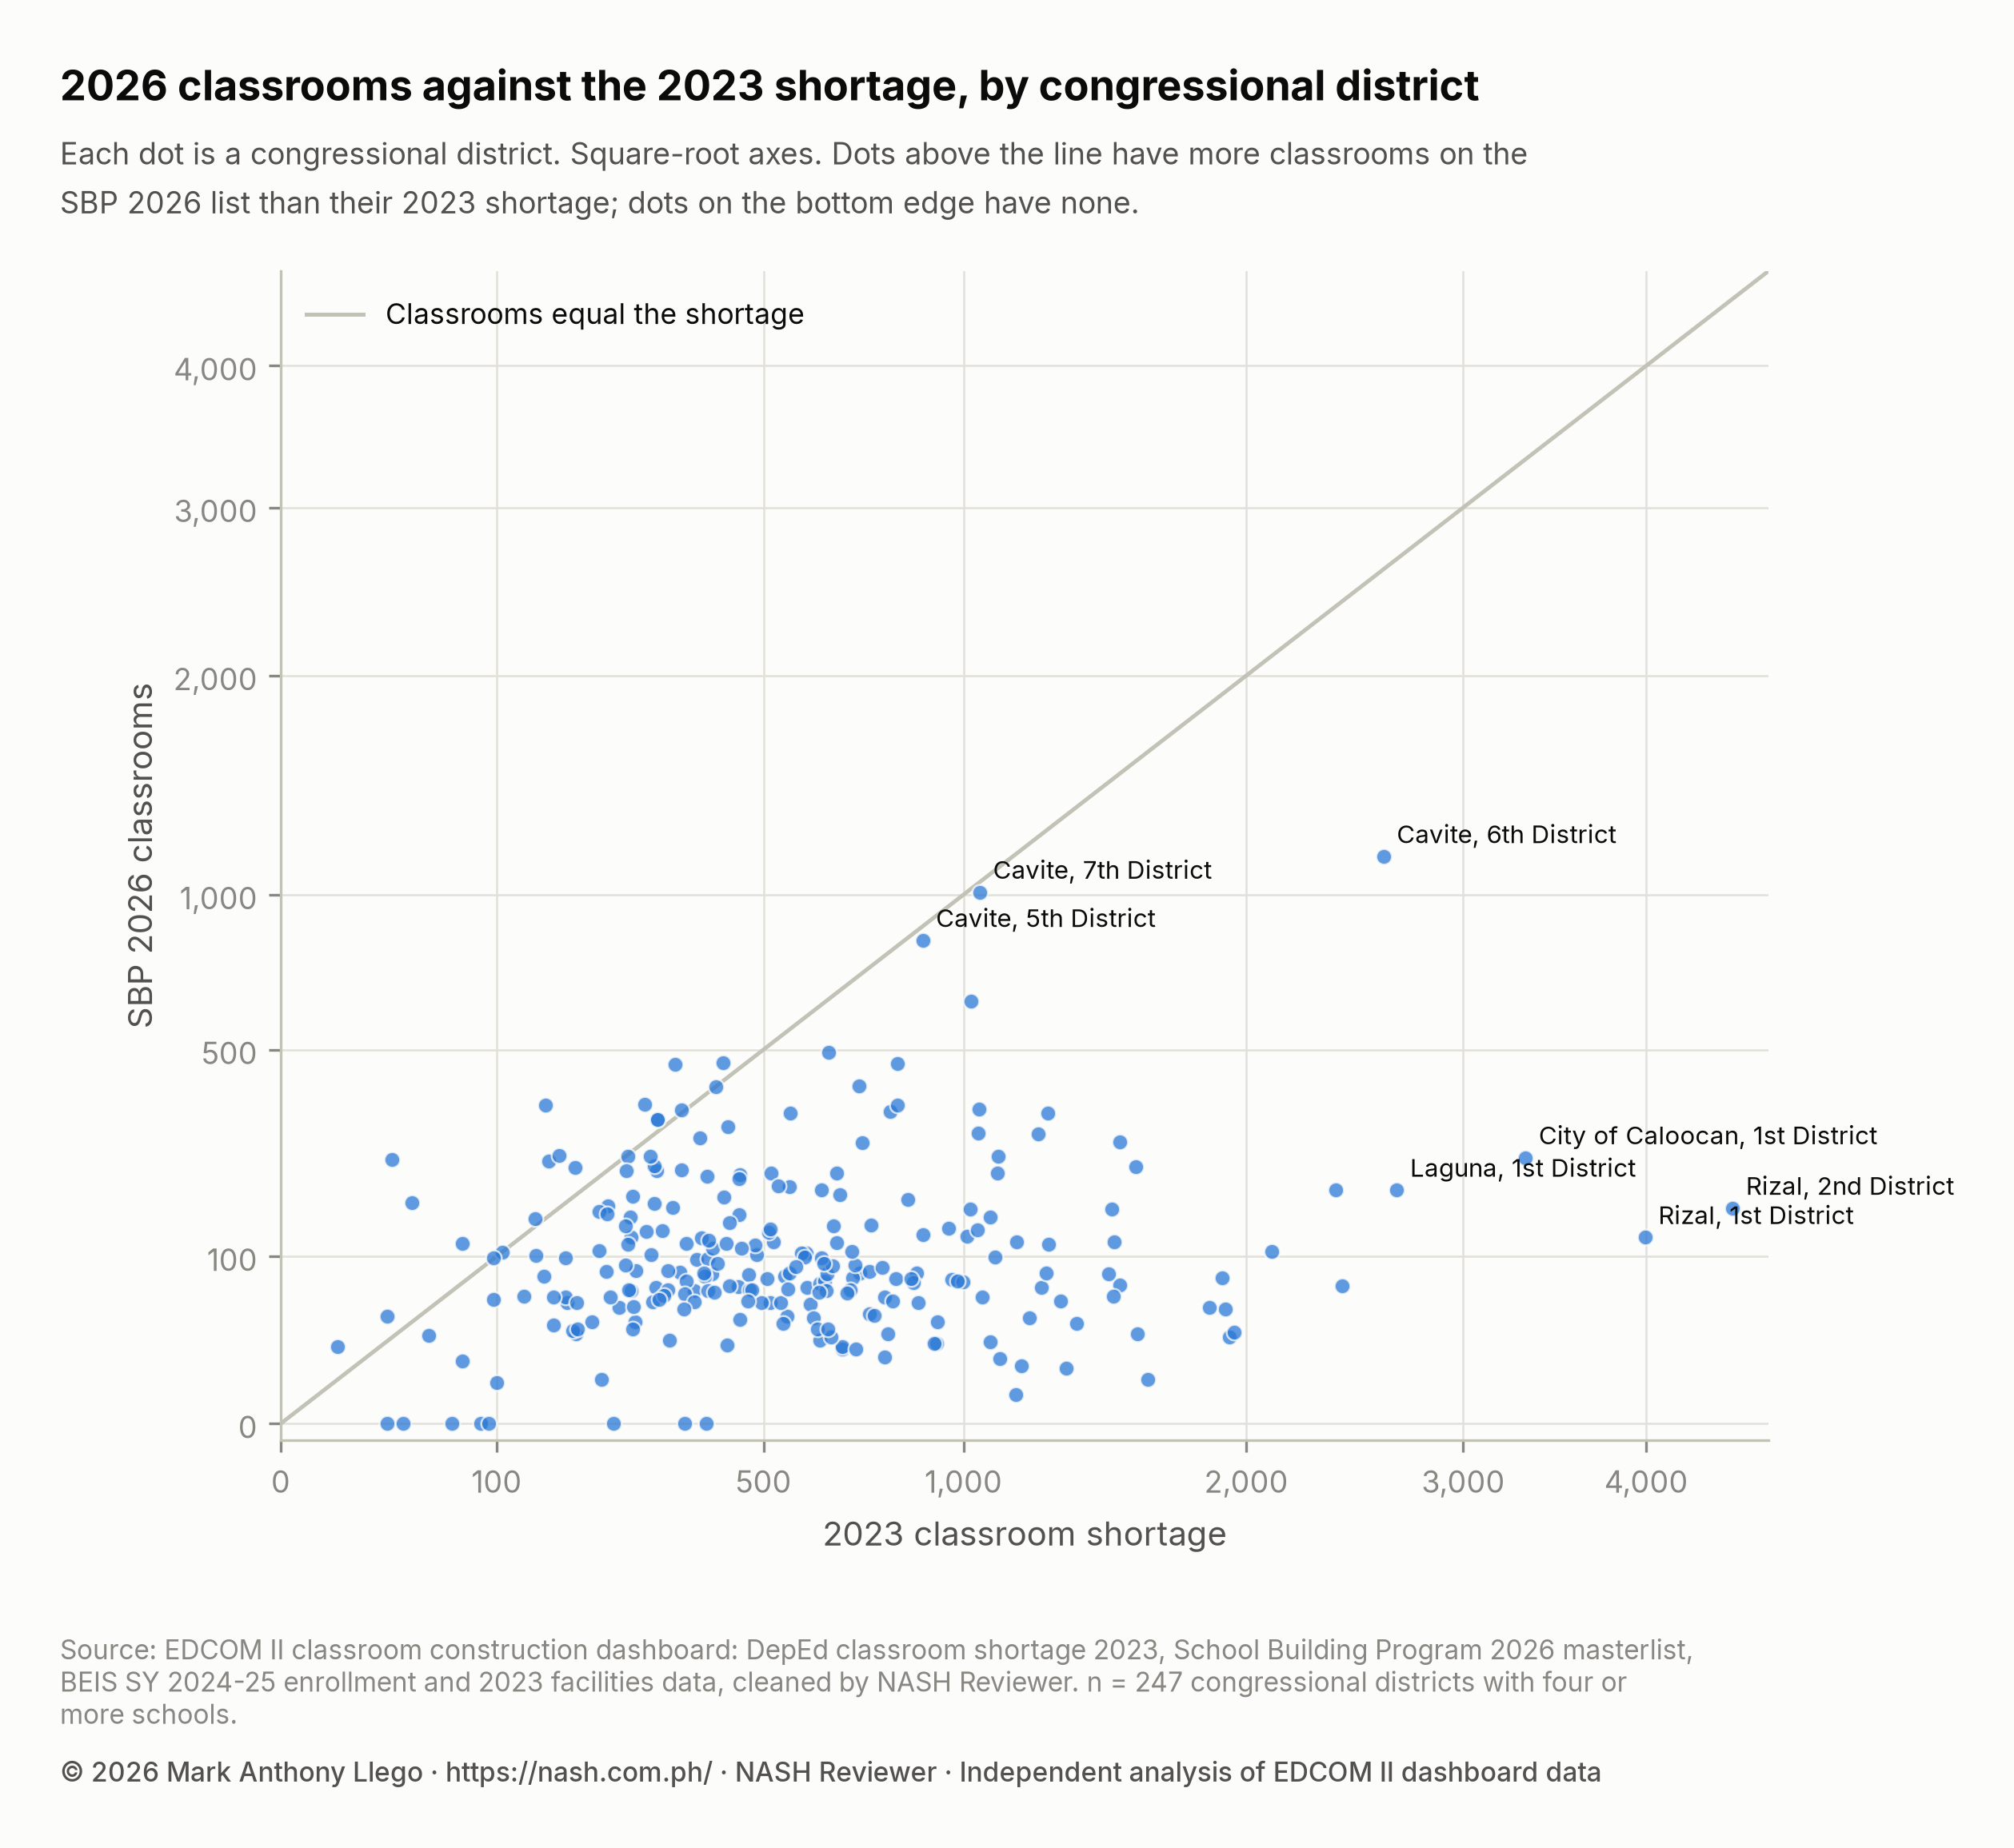
If classrooms followed the shortage, the dots would rise from left to right. They form a flat band instead: districts short a few hundred classrooms and districts short a few thousand receive similar numbers. Spearman’s rank correlation (Spearman, 1904), which compares the order of districts rather than their counts, is 0.08, with a 95% interval of -0.06 to 0.21 that includes zero. Among the 1,642 cities and municipalities, Do 2026 Classrooms Go Where the Shortage Is? finds 0.34 (0.29 to 0.38); districts are larger and fewer units, so the two figures are not strictly comparable, but at district level the link is weak.
The three districts with the most SBP classrooms, labeled in the chart, are in Cavite: Cavite, 6th District with 1,150 classrooms against a shortage of 2,609, Cavite, 7th District with 1,010 against 1,048 and Cavite, 5th District with 835 against 884. The Cavite deep dive reads the province school by school.
The concentration measures say the same. The Gini coefficient (Gini, 1912), 0 when every district has the same and 1 when one has all, is 0.42 for the shortage across the 247 districts and 0.49 for SBP classrooms: the classrooms are spread somewhat more unevenly than the shortage, and not over the same districts. The 10 districts with the largest shortages hold 16.9% of the national shortage and 7.3% of the classrooms with a district; the 25 largest hold 31.0% and 11.4%.
School by school, 53.8% of the 31,907 district classrooms fall within the receiving school’s own 2023 shortage, close to the 53.0% of all SBP classrooms in the national post, and the unmet shortage counted school by school is 148,276. A classroom beyond one school’s shortage does not meet another school’s need, even in the same district.
Districts with the lowest and highest SBP 2026 coverage
The median district’s SBP 2026 classrooms equal 17.2% of its 2023 shortage, and the middle half of districts lie between 7.8% and 38.4%. 40 districts are under 5%, 77 under 10%, and 17 at 100% or more.
Among the 183 districts short 300 classrooms or more, these 20 have the lowest coverage:
| District | Region | Schools | Learners (SY 2024-25) | Classroom shortage (2023) | Shortage per 1,000 learners | SBP 2026 classrooms | Coverage |
|---|---|---|---|---|---|---|---|
| City of Cebu , 1st District | Region VII | 50 | 71,975 | 350 | 4.9 | 0 | 0.0% |
| Special Geographic Area, 1st District | BARMM | 90 | 31,511 | 388 | 12.3 | 0 | 0.0% |
| City of Zamboanga, 2nd District | Region IX | 143 | 130,082 | 1,160 | 8.9 | 3 | 0.3% |
| City of Davao, 1st District | Region XI | 71 | 129,070 | 1,613 | 12.5 | 7 | 0.4% |
| City of Davao, 2nd District | Region XI | 122 | 107,243 | 1,323 | 12.3 | 11 | 0.8% |
| Basilan, Lone District | BARMM | 229 | 77,926 | 1,178 | 15.1 | 12 | 1.0% |
| City of Davao, 3rd District | Region XI | 236 | 135,079 | 1,109 | 8.2 | 15 | 1.4% |
| Maguindanao del Norte, 1st District | BARMM | 346 | 171,531 | 1,931 | 11.2 | 27 | 1.4% |
| Tawi-Tawi, Lone District | BARMM | 262 | 80,627 | 1,952 | 24.2 | 30 | 1.5% |
| Lanao del Sur, 2nd District | BARMM | 399 | 109,761 | 1,575 | 14.3 | 29 | 1.8% |
| City of Valenzuela, 2nd District | NCR | 30 | 56,338 | 782 | 13.9 | 16 | 2.0% |
| Cavite, 3rd District | Region IV-A | 31 | 69,872 | 1,079 | 15.4 | 24 | 2.2% |
| Lanao del Sur, 1st District | BARMM | 460 | 146,708 | 1,916 | 13.0 | 47 | 2.5% |
| Bukidnon, 1st District | Region X | 170 | 80,902 | 923 | 11.4 | 23 | 2.5% |
| Sulu, 2nd District | Region IX | 218 | 51,832 | 916 | 17.5 | 23 | 2.5% |
| Maguindanao del Sur, 2nd District | BARMM | 315 | 138,001 | 1,851 | 13.3 | 48 | 2.6% |
| Quezon City, 5th District | NCR | 29 | 97,830 | 1,359 | 13.9 | 36 | 2.6% |
| Quezon City, 2nd District | NCR | 20 | 128,437 | 2,417 | 18.8 | 68 | 2.8% |
| City of Parañaque, 2nd District | NCR | 17 | 48,078 | 709 | 14.7 | 20 | 2.8% |
| City of Cebu , 2nd District | Region VII | 57 | 104,906 | 676 | 6.4 | 20 | 3.0% |
City of Cebu , 1st District and Special Geographic Area, 1st District have no SBP 2026 classroom; City of Zamboanga, 2nd District has 3 against a shortage of 1,160, and the three City of Davao districts between 0.4% and 1.4%. Seven of the 20 are in BARMM, the region with the lowest coverage in DepEd School Building Program 2026 in Numbers.
Eight districts with a shortage have no SBP classroom at all, 1,274 classrooms of shortage between them: the two City of Makati districts in NCR, City of Cebu , 1st District in Region VII, Agusan del Norte, 1st District in CARAGA, and four in BARMM (Maguindanao del Norte, 2nd District; Maguindanao del Sur, 1st District; and Special Geographic Area, 1st and 3rd Districts). These data cannot say why. A city may build classrooms with its own funds, which the masterlist would not show. For BARMM, the Bangsamoro Organic Law (RA 11054), Article VI, Section 13, says national programs and projects such as the School Building Program “shall continue to be funded by the National Government”, and EDCOM II has reported that some national programs pulled back from BARMM after the law because of unclear interpretation (EDCOM II, 2025, November 13). Classroom Shortage in BARMM, 2023–2026: Highest Rate reads the region in full.
At the other end, among districts short 100 classrooms or more, these 10 have the highest coverage:
| District | Region | Schools | Learners (SY 2024-25) | Classroom shortage (2023) | Shortage per 1,000 learners | SBP 2026 classrooms | Coverage |
|---|---|---|---|---|---|---|---|
| Pangasinan, 5th District | Region I | 248 | 108,924 | 150 | 1.4 | 363 | 242.0% |
| Cagayan, 2nd District | Region II | 266 | 64,260 | 154 | 2.4 | 246 | 159.8% |
| Pangasinan, 6th District | Region I | 275 | 94,048 | 166 | 1.8 | 257 | 154.9% |
| City of Manila, 2nd District | NCR | 19 | 37,893 | 334 | 8.8 | 462 | 138.4% |
| Pangasinan, 4th District | Region I | 139 | 100,407 | 284 | 2.8 | 365 | 128.3% |
| La Union, 1st District | Region I | 188 | 65,375 | 186 | 2.8 | 235 | 126.3% |
| Sorsogon, 2nd District | Region V | 304 | 97,800 | 419 | 4.3 | 466 | 111.2% |
| Isabela, 4th District | Region II | 254 | 90,139 | 304 | 3.4 | 331 | 108.9% |
| Isabela, 1st District | Region II | 286 | 90,858 | 304 | 3.3 | 331 | 108.8% |
| Ilocos Sur, 1st District | Region I | 202 | 55,024 | 139 | 2.5 | 150 | 108.1% |
Pangasinan, 5th District has 363 SBP classrooms against a shortage of 150, 242.0%. Most of the 17 districts at 100% or more are in Region I and Region II, the regions with the lowest district rates. Smaller shortages give higher coverage still: Ilocos Norte, 1st District has 250 classrooms against 26 (944.0%). Coverage above 100% is not necessarily a mistake: a school may since have lost rooms to calamity or condemnation, gained learners or need rooms the 2023 count does not measure.
Across the 237 districts with 20,000 learners or more, the higher a district’s shortage per learner, the lower its coverage tends to be: Spearman’s rank correlation is -0.63 (95% interval -0.71 to -0.54), close to the -0.54 found for cities and municipalities in Top 20 Cities and Municipalities by Classroom Shortage. Much of this follows from the arithmetic of coverage. Districts with high rates also tend to have large shortages, and since a district’s classrooms barely rise with its shortage, a similar number of classrooms covers a smaller share of a larger gap.
Congressional districts by region
The table sums the districts by region. A district’s region is the DepEd region of its schools; Sulu’s two districts are in Region IX, since its schools division moved to DepEd Region IX on 20 October 2026. The district count, the median rate and the districts with no SBP classroom cover the 247 ranked districts (the rate columns only those with 20,000 learners or more); the shortage and SBP classrooms include every label.
| Region | Districts | Classroom shortage (2023) | Median district rate per 1,000 learners | Districts above the national rate | Districts with no SBP 2026 classroom | SBP 2026 classrooms |
|---|---|---|---|---|---|---|
| NCR | 33 | 24,866 | 11.0 | 28 | 2 | 4,572 |
| CAR | 7 | 2,301 | 6.5 | 2 | 0 | 1,054 |
| Region I | 12 | 3,061 | 2.8 | 0 | 0 | 3,092 |
| Region II | 10 | 2,501 | 3.1 | 0 | 0 | 1,959 |
| Region III | 22 | 13,119 | 5.2 | 3 | 0 | 4,063 |
| Region IV-A | 22 | 31,010 | 8.5 | 14 | 0 | 6,294 |
| MIMAROPA | 8 | 4,777 | 5.7 | 2 | 0 | 1,678 |
| Region V | 16 | 7,415 | 4.6 | 0 | 0 | 2,346 |
| Region VI | 12 | 3,522 | 3.9 | 0 | 0 | 793 |
| NIR | 11 | 4,579 | 4.0 | 0 | 0 | 767 |
| Region VII | 13 | 10,857 | 6.8 | 5 | 1 | 892 |
| Region VIII | 13 | 5,990 | 4.5 | 3 | 0 | 927 |
| Region IX | 12 | 8,826 | 8.0 | 7 | 0 | 627 |
| Region X | 14 | 10,333 | 9.3 | 10 | 0 | 1,081 |
| Region XI | 13 | 8,532 | 5.8 | 4 | 0 | 565 |
| Region XII | 9 | 8,281 | 8.0 | 5 | 0 | 477 |
| CARAGA | 10 | 4,410 | 5.8 | 2 | 1 | 527 |
| BARMM | 10 | 11,064 | 13.3 | 7 | 4 | 193 |
Region IV-A’s districts hold the largest shortage, 31,010 classrooms, and NCR’s 24,866; 28 NCR districts are above the national rate. In Region I, Region II, Region V, Region VI and NIR, no district is above it, and Region I’s districts together have 3,092 SBP classrooms against a shortage of 3,061. BARMM’s districts have the highest median rate, 13.3, four with no SBP classroom, and 193 classrooms against a shortage of 11,064. The regional reports, such as Classroom Shortage in Region IV-A, 2023–2026: Rizal, Cavite and Classroom Shortage in NCR, 2023–2026: Shifts and Crowding, read each region by division, province and city.
Districts differ, but the schools inside a district differ more. The Theil index (Theil, 1967) measures how far the shortage departs from an even spread over learners; across the 47,524 schools with learners it is 0.671. It splits exactly: 21.4% of it lies between districts and 78.6% between schools in the same district, the same share that Philippine Classroom Shortage 2023: Where the Gap Is finds between schools in the same division. A district’s total or rate hides most of the differences among its schools.
What this means for school heads
The same uses apply to LGU staff and legislative offices reading the district table.
- Find your district, then your school. The table below gives each district’s shortage, rate, SBP 2026 classrooms and coverage. In the school table,
congressional_districtgives your school’s district label,shortage_totalits 2023 shortage andsbp_classroomsits SBP 2026 classrooms. How to Read DepEd Data: A Guide for Aspiring School Heads explains how to read such tables. - Do not judge your school by the district. With 78.6% of the uneven spread lying between schools in the same district, a district’s rate says little about any one school. Cite your own school’s figures in the School Improvement Plan and AIP.
- Use rates and counts together. A district short 4,522 classrooms for 344,060 learners, as Rizal, 2nd District is, makes a different case from one short 624 for 28,139, as Dinagat Islands, Lone District is.
- Bring the numbers to the division, the LGU and the local school board. LGU-implemented lines carry 8,665 SBP classrooms nationally. Show your shortage, allocation and unmet gap beside your district’s and city’s or municipality’s totals.
- Check your school’s label. If your school sits under a district label that looks wrong, such as one of the stray labels described below, raise it with the division before the data are used for planning.
- Document need beyond the 2023 count. Record enrollment, shifts, makeshift rooms and condemned rooms, with dates and photos; Class Shifts and Crowded Classrooms in DepEd Schools shows how shifting is measured.
How these numbers were made
The data are the cleaned tables behind the EDCOM II classroom construction dashboard: DepEd’s 2023 classroom shortage by school, which labels each school with its congressional district; the SBP 2026 masterlist; and SY 2024-25 enrollment from the Basic Education Information System (BEIS). How the EDCOM Classroom Data Was Cleaned documents every table. The analysis was done in Python with pandas, NumPy and SciPy, and the charts drawn with Matplotlib.
- District labels. A school’s district is its label in DepEd’s 2023 shortage table. The table carries 270 labels. Eleven of them differ from another label only in capitalization, mostly “Del” against “del”: in Davao del Norte, Davao del Sur, Lanao del Norte, Lanao del Sur, Zamboanga del Norte and Zamboanga del Sur (for example, “Lanao Del Sur, 1st District” beside “Lanao del Sur, 1st District”). Each is merged under its more common spelling, leaving 259 districts. Labels are otherwise kept as DepEd writes them, including a stray space in some city names. A district’s region is the DepEd region of most of its schools.
- Stray labels. 12 labels are attached to three schools or fewer, 19 schools and 75 classrooms of shortage in all. Each sits beside a label that holds most of the same province’s or city’s schools, such as “Basilan, 1st District” beside “Basilan, Lone District”, so they look like slips or older names in DepEd’s table. They stay in the full table and in the national totals but are left out of the rankings and statistics. They are Benguet, 2nd District; City of Baguio, 1st District; Aklan, Lone District; Iloilo, Lone District; City of Lapu-Lapu, 1st District; City of Mandaue, 1st District; Lanao Del Norte, Lone District; Davao Del Sur, 3rd District; Agusan del Sur, Lone District; Basilan, 1st District; Special Geographic Area, 2nd District; and Special Geographic Area, No Legislative District.
- Shortage and rates. A district’s shortage is the sum of its schools’ 2023 shortage, Kindergarten to Grade 10 plus senior high school, counted only where a school lacks classrooms. The rate divides the shortage of schools with SY 2024-25 learners by those learners and multiplies by 1,000. Rates are ranked, and their quartiles taken, only among the 237 districts with 20,000 learners or more.
- SBP classrooms and coverage. A district’s SBP 2026 classrooms are the sum over its schools; the 512 classrooms at schools not in the 2023 table have no district. Coverage is a district’s SBP classrooms divided by its shortage. Classrooms within a school’s shortage are the smaller of its SBP classrooms and its shortage, summed over schools.
- Rank correlation. Spearman’s rho (Spearman, 1904) ranks districts on each measure and correlates the ranks: 1 means the same order, 0 no relation and -1 the opposite order. It is computed for shortage and SBP classrooms over the 247 ranked districts, and for rate and coverage over the 237 with 20,000 learners or more. Each 95% interval is the middle 95% of 1,000 bootstrap samples of districts drawn with replacement (Efron & Tibshirani, 1993).
- Concentration. The Gini coefficients are computed over the 247 ranked districts. The top 10 and top 25 shares divide those districts’ shortage by the national 165,443 and their SBP classrooms by the 31,907 with a district. The 54 districts holding half the shortage are the fewest, taken from the largest down, whose shortages add up to half of the ranked districts’ total.
- Theil index. For each school, its share of the national shortage, s, is multiplied by the natural logarithm of s divided by its share of national learners, w, and the products are added up over schools (Theil, 1967). The between-district part is the same sum over districts; the rest lies between schools in the same district, so the two parts add up to the total.
Limits
The years differ: the shortage and the district labels are from 2023, enrollment from SY 2024-25 and the allocations from 2026, with PSIP III construction expected from March 2027 to July 2028. Allocations are plans, not buildings. At EDCOM II’s 16 October 2026 hearing, of the PHP 21.45 billion for 6,000 DPWH-led classrooms, only PHP 1.87 billion, covering 533 classrooms, had reached the award or near-award stage (EDCOM II, 2026, October 20).
District boundaries follow DepEd’s 2023 data. Districts created or redrawn since, and schools labeled under an old or neighboring district, may differ from today’s map, and a school’s shortage counts wherever its label places it. The shortage is DepEd’s own estimate and not the whole need: the National Education Plan 2026-2035 puts the classrooms needed from current and projected deficits at 219,000 by 2028 (EDCOM II, 2026).
The 512 SBP classrooms at schools with no 2023 record have no district, so district totals fall slightly short of the national list. Rates for small districts are shown but not ranked, and coverage for a small shortage can run far above 100%. All results are descriptive: they show where the shortage and the 2026 classrooms are, not why, and nothing in them measures the work of any official or office.
Every congressional district: find yours
The table lists all 259 districts, sorted by region and then by label, as DepEd’s 2023 table writes them. Look for your district under that label, which may differ from its current name: city districts start with “City of” (except Quezon City and Pasay City), some labels have a space before the comma (“City of Cebu , 1st District”), and the schools of Lapu-Lapu and Mandaue are mostly under “City of Lapu-Lapu, 6th District” and “City of Mandaue, 6th District”. The 12 stray labels, those with three schools or fewer, are included but not ranked. “Not given” means the district has no learners in the SY 2024-25 data; “No shortage” means it has no 2023 shortage, so coverage cannot be computed.
| District | Region | Schools | Learners (SY 2024-25) | Classroom shortage (2023) | Shortage per 1,000 learners | SBP 2026 classrooms | Coverage |
|---|---|---|---|---|---|---|---|
| City of Caloocan, 1st District | NCR | 65 | 212,990 | 3,324 | 15.6 | 253 | 7.6% |
| City of Caloocan, 2nd District | NCR | 24 | 52,003 | 483 | 9.3 | 114 | 23.6% |
| City of Las Piñas, Lone District | NCR | 39 | 90,254 | 1,469 | 16.3 | 80 | 5.4% |
| City of Makati, 1st District | NCR | 19 | 26,660 | 237 | 8.6 | 0 | 0.0% |
| City of Makati, 2nd District | NCR | 4 | 3,972 | 32 | 8.1 | 0 | 0.0% |
| City of Malabon, Lone District | NCR | 42 | 68,507 | 1,105 | 16.1 | 256 | 23.2% |
| City of Mandaluyong, Lone District | NCR | 24 | 52,542 | 299 | 5.7 | 238 | 79.5% |
| City of Manila, 1st District | NCR | 18 | 62,445 | 1,022 | 16.4 | 638 | 62.4% |
| City of Manila, 2nd District | NCR | 19 | 37,893 | 334 | 8.8 | 462 | 138.4% |
| City of Manila, 3rd District | NCR | 16 | 40,345 | 312 | 7.7 | 133 | 42.6% |
| City of Manila, 4th District | NCR | 19 | 32,002 | 422 | 13.2 | 184 | 43.6% |
| City of Manila, 5th District | NCR | 16 | 48,331 | 390 | 8.1 | 218 | 55.9% |
| City of Manila, 6th District | NCR | 17 | 31,846 | 293 | 9.2 | 255 | 86.9% |
| City of Marikina, 1st District | NCR | 18 | 30,666 | 287 | 9.4 | 132 | 46.0% |
| City of Marikina, 2nd District | NCR | 15 | 45,550 | 555 | 12.2 | 81 | 14.6% |
| City of Muntinlupa, Lone District | NCR | 27 | 82,999 | 843 | 10.2 | 179 | 21.2% |
| City of Navotas, Lone District | NCR | 25 | 46,219 | 662 | 14.3 | 224 | 33.8% |
| City of Parañaque, 1st District | NCR | 26 | 52,845 | 582 | 11.0 | 104 | 17.9% |
| City of Parañaque, 2nd District | NCR | 17 | 48,078 | 709 | 14.7 | 20 | 2.8% |
| City of Pasig, Lone District | NCR | 44 | 142,463 | 958 | 6.7 | 136 | 14.2% |
| City of San Juan, Lone District | NCR | 13 | 11,585 | 71 | 6.1 | 116 | 163.4% |
| City of Taguig, 1st District | NCR | 20 | 64,335 | 701 | 10.9 | 76 | 10.8% |
| City of Taguig, 2nd District | NCR | 32 | 122,446 | 1,903 | 15.5 | 76 | 4.0% |
| City of Valenzuela, 1st District | NCR | 41 | 74,011 | 885 | 12.0 | 128 | 14.5% |
| City of Valenzuela, 2nd District | NCR | 30 | 56,338 | 782 | 13.9 | 16 | 2.0% |
| Pasay City, Lone District | NCR | 29 | 63,982 | 650 | 10.2 | 27 | 4.2% |
| Pateros, 1st District | NCR | 10 | 8,150 | 47 | 5.8 | 28 | 59.6% |
| Quezon City, 1st District | NCR | 36 | 56,578 | 455 | 8.0 | 110 | 24.2% |
| Quezon City, 2nd District | NCR | 20 | 128,437 | 2,417 | 18.8 | 68 | 2.8% |
| Quezon City, 3rd District | NCR | 25 | 34,548 | 266 | 7.7 | 32 | 12.0% |
| Quezon City, 4th District | NCR | 27 | 47,700 | 393 | 8.2 | 120 | 30.6% |
| Quezon City, 5th District | NCR | 29 | 97,830 | 1,359 | 13.9 | 36 | 2.6% |
| Quezon City, 6th District | NCR | 21 | 55,526 | 618 | 11.1 | 32 | 5.2% |
| Abra, Lone District | CAR | 317 | 48,018 | 230 | 4.8 | 169 | 73.5% |
| Apayao, Lone District | CAR | 200 | 26,324 | 174 | 6.5 | 57 | 32.8% |
| Benguet, 2nd District | CAR | 1 | 234 | 0 | 0.0 | 0 | No shortage |
| Benguet, Lone District | CAR | 430 | 82,742 | 557 | 6.7 | 344 | 61.8% |
| City of Baguio, 1st District | CAR | 1 | 1,771 | 0 | 0.0 | 3 | No shortage |
| City of Baguio, Lone District | CAR | 65 | 57,732 | 255 | 4.4 | 140 | 55.0% |
| Ifugao, Lone District | CAR | 266 | 40,587 | 259 | 6.4 | 115 | 44.4% |
| Kalinga, Lone District | CAR | 297 | 50,798 | 400 | 7.8 | 110 | 27.5% |
| Mountain Province, Lone District | CAR | 267 | 33,250 | 426 | 12.8 | 116 | 27.2% |
| Ilocos Norte, 1st District | Region I | 223 | 58,018 | 26 | 0.5 | 250 | 944.0% |
| Ilocos Norte, 2nd District | Region I | 213 | 51,836 | 37 | 0.7 | 175 | 471.7% |
| Ilocos Sur, 1st District | Region I | 202 | 55,024 | 139 | 2.5 | 150 | 108.1% |
| Ilocos Sur, 2nd District | Region I | 358 | 73,502 | 218 | 3.0 | 107 | 49.1% |
| La Union, 1st District | Region I | 188 | 65,375 | 186 | 2.8 | 235 | 126.3% |
| La Union, 2nd District | Region I | 231 | 85,533 | 330 | 3.9 | 167 | 50.6% |
| Pangasinan, 1st District | Region I | 274 | 101,468 | 451 | 4.4 | 215 | 47.7% |
| Pangasinan, 2nd District | Region I | 224 | 113,423 | 430 | 3.8 | 315 | 73.3% |
| Pangasinan, 3rd District | Region I | 285 | 150,394 | 644 | 4.3 | 493 | 76.5% |
| Pangasinan, 4th District | Region I | 139 | 100,407 | 284 | 2.8 | 365 | 128.3% |
| Pangasinan, 5th District | Region I | 248 | 108,924 | 150 | 1.4 | 363 | 242.0% |
| Pangasinan, 6th District | Region I | 275 | 94,048 | 166 | 1.8 | 257 | 154.9% |
| Batanes, Lone District | Region II | 27 | 3,914 | 7 | 1.8 | 21 | 300.0% |
| Cagayan, 1st District | Region II | 344 | 97,192 | 263 | 2.7 | 152 | 57.9% |
| Cagayan, 2nd District | Region II | 266 | 64,260 | 154 | 2.4 | 246 | 159.8% |
| Cagayan, 3rd District | Region II | 231 | 103,211 | 217 | 2.1 | 161 | 74.2% |
| Isabela, 1st District | Region II | 286 | 90,858 | 304 | 3.3 | 331 | 108.8% |
| Isabela, 2nd District | Region II | 295 | 92,269 | 344 | 3.7 | 230 | 66.8% |
| Isabela, 3rd District | Region II | 265 | 83,940 | 259 | 3.1 | 255 | 98.6% |
| Isabela, 4th District | Region II | 254 | 90,139 | 304 | 3.4 | 331 | 108.9% |
| Nueva Vizcaya, Lone District | Region II | 380 | 105,078 | 510 | 4.8 | 131 | 25.7% |
| Quirino, Lone District | Region II | 187 | 46,299 | 139 | 3.0 | 101 | 72.5% |
| Aurora, Lone District | Region III | 174 | 53,645 | 106 | 2.0 | 105 | 99.4% |
| Bataan, 1st District | Region III | 122 | 80,549 | 294 | 3.6 | 102 | 34.7% |
| Bataan, 2nd District | Region III | 113 | 101,915 | 303 | 3.0 | 228 | 75.3% |
| Bulacan, 1st District | Region III | 176 | 129,999 | 748 | 5.8 | 141 | 18.8% |
| Bulacan, 2nd District | Region III | 148 | 151,824 | 1,043 | 6.9 | 301 | 28.9% |
| Bulacan, 3rd District | Region III | 203 | 137,318 | 726 | 5.3 | 282 | 38.8% |
| Bulacan, 4th District | Region III | 100 | 135,061 | 1,263 | 9.4 | 345 | 27.3% |
| Bulacan, Lone District | Region III | 57 | 126,952 | 1,512 | 11.9 | 284 | 18.8% |
| City of Olongapo, 1st District | Region III | 39 | 46,504 | 233 | 5.0 | 57 | 24.5% |
| Nueva Ecija, 1st District | Region III | 294 | 119,693 | 344 | 2.9 | 352 | 102.2% |
| Nueva Ecija, 2nd District | Region III | 247 | 100,541 | 256 | 2.5 | 228 | 89.0% |
| Nueva Ecija, 3rd District | Region III | 218 | 126,961 | 653 | 5.1 | 89 | 13.6% |
| Nueva Ecija, 4th District | Region III | 186 | 109,780 | 299 | 2.7 | 173 | 57.8% |
| Pampanga, 1st District | Region III | 145 | 161,750 | 1,231 | 7.6 | 300 | 24.4% |
| Pampanga, 2nd District | Region III | 190 | 114,214 | 513 | 4.5 | 135 | 26.3% |
| Pampanga, 3rd District | Region III | 177 | 148,917 | 817 | 5.5 | 464 | 56.8% |
| Pampanga, 4th District | Region III | 199 | 104,300 | 380 | 3.6 | 123 | 32.3% |
| Tarlac, 1st District | Region III | 248 | 86,971 | 627 | 7.2 | 98 | 15.6% |
| Tarlac, 2nd District | Region III | 205 | 117,303 | 632 | 5.4 | 92 | 14.6% |
| Tarlac, 3rd District | Region III | 149 | 102,403 | 643 | 6.3 | 32 | 5.0% |
| Zambales, 1st District | Region III | 81 | 50,695 | 267 | 5.3 | 49 | 18.4% |
| Zambales, 2nd District | Region III | 234 | 91,922 | 227 | 2.5 | 83 | 36.6% |
| Batangas, 1st District | Region IV-A | 230 | 130,090 | 635 | 4.9 | 73 | 11.5% |
| Batangas, 2nd District | Region IV-A | 256 | 114,856 | 451 | 3.9 | 156 | 34.6% |
| Batangas, 3rd District | Region IV-A | 238 | 138,976 | 797 | 5.7 | 349 | 43.8% |
| Batangas, 4th District | Region IV-A | 291 | 175,501 | 671 | 3.8 | 187 | 27.9% |
| Cavite, 1st District | Region IV-A | 47 | 61,207 | 377 | 6.2 | 292 | 77.4% |
| Cavite, 2nd District | Region IV-A | 51 | 93,465 | 1,266 | 13.5 | 115 | 9.1% |
| Cavite, 3rd District | Region IV-A | 31 | 69,872 | 1,079 | 15.4 | 24 | 2.2% |
| Cavite, 4th District | Region IV-A | 40 | 112,680 | 1,568 | 13.9 | 236 | 15.1% |
| Cavite, 5th District | Region IV-A | 75 | 108,414 | 884 | 8.2 | 835 | 94.5% |
| Cavite, 6th District | Region IV-A | 85 | 202,665 | 2,609 | 12.9 | 1,150 | 44.1% |
| Cavite, 7th District | Region IV-A | 171 | 125,035 | 1,048 | 8.4 | 1,010 | 96.3% |
| City of Lucena , 2nd District | Region IV-A | 55 | 64,045 | 555 | 8.7 | 201 | 36.2% |
| Laguna, 1st District | Region IV-A | 95 | 177,684 | 2,672 | 15.0 | 195 | 7.3% |
| Laguna, 2nd District | Region IV-A | 141 | 192,004 | 2,388 | 12.1 | 195 | 8.2% |
| Laguna, 3rd District | Region IV-A | 176 | 116,878 | 1,046 | 8.9 | 354 | 33.9% |
| Laguna, 4th District | Region IV-A | 207 | 119,073 | 1,483 | 12.5 | 164 | 11.1% |
| Quezon, 1st District | Region IV-A | 271 | 129,610 | 1,020 | 7.8 | 164 | 16.1% |
| Quezon, 2nd District | Region IV-A | 141 | 97,745 | 627 | 6.4 | 195 | 31.1% |
| Quezon, 3rd District | Region IV-A | 273 | 105,817 | 781 | 7.4 | 57 | 7.3% |
| Quezon, 4th District | Region IV-A | 309 | 104,514 | 536 | 5.1 | 52 | 9.7% |
| Rizal, 1st District | Region IV-A | 123 | 286,906 | 3,993 | 13.9 | 124 | 3.1% |
| Rizal, 2nd District | Region IV-A | 246 | 344,060 | 4,522 | 13.1 | 166 | 3.7% |
| City of Puerto Princesa , 2nd District | MIMAROPA | 98 | 69,552 | 516 | 7.4 | 225 | 43.6% |
| Marinduque, Lone District | MIMAROPA | 229 | 55,767 | 148 | 2.7 | 78 | 52.5% |
| Occidental Mindoro, Lone District | MIMAROPA | 363 | 134,718 | 1,042 | 7.7 | 134 | 12.9% |
| Oriental Mindoro, 1st District | MIMAROPA | 315 | 106,042 | 452 | 4.3 | 222 | 49.2% |
| Oriental Mindoro, 2nd District | MIMAROPA | 281 | 99,795 | 531 | 5.3 | 202 | 38.1% |
| Palawan, 1st District | MIMAROPA | 443 | 118,690 | 718 | 6.1 | 407 | 56.7% |
| Palawan, 2nd District | MIMAROPA | 379 | 133,520 | 1,103 | 8.3 | 225 | 20.4% |
| Romblon, Lone District | MIMAROPA | 269 | 75,485 | 266 | 3.5 | 185 | 69.5% |
| Albay, 1st District | Region V | 186 | 96,898 | 271 | 2.8 | 84 | 31.0% |
| Albay, 2nd District | Region V | 213 | 104,675 | 624 | 6.0 | 70 | 11.2% |
| Albay, 3rd District | Region V | 328 | 127,130 | 720 | 5.7 | 81 | 11.3% |
| Camarines Norte, 1st District | Region V | 173 | 80,372 | 367 | 4.6 | 63 | 17.2% |
| Camarines Norte, 2nd District | Region V | 144 | 76,278 | 263 | 3.4 | 124 | 47.2% |
| Camarines Sur, 1st District | Region V | 163 | 52,913 | 160 | 3.0 | 35 | 21.9% |
| Camarines Sur, 2nd District | Region V | 205 | 79,751 | 372 | 4.6 | 96 | 25.8% |
| Camarines Sur, 3rd District | Region V | 204 | 126,465 | 815 | 6.4 | 363 | 44.5% |
| Camarines Sur, 4th District | Region V | 350 | 128,293 | 811 | 6.2 | 75 | 9.2% |
| Camarines Sur, 5th District | Region V | 261 | 115,935 | 544 | 4.7 | 78 | 14.3% |
| Catanduanes, Lone District | Region V | 268 | 71,789 | 228 | 3.2 | 157 | 68.9% |
| Masbate, 1st District | Region V | 173 | 47,883 | 321 | 6.7 | 64 | 19.9% |
| Masbate, 2nd District | Region V | 292 | 111,709 | 663 | 5.9 | 117 | 17.6% |
| Masbate, 3rd District | Region V | 278 | 83,804 | 432 | 5.2 | 68 | 15.7% |
| Sorsogon, 1st District | Region V | 310 | 117,067 | 406 | 3.5 | 405 | 99.7% |
| Sorsogon, 2nd District | Region V | 304 | 97,800 | 419 | 4.3 | 466 | 111.2% |
| Aklan, 1st District | Region VI | 201 | 62,078 | 176 | 2.8 | 52 | 29.6% |
| Aklan, 2nd District | Region VI | 175 | 59,258 | 245 | 4.1 | 48 | 19.6% |
| Aklan, Lone District | Region VI | 3 | 1,157 | 9 | 7.8 | 0 | 0.0% |
| Antique, Lone District | Region VI | 535 | 137,605 | 592 | 4.3 | 104 | 17.6% |
| Capiz, 1st District | Region VI | 220 | 92,449 | 391 | 4.2 | 97 | 24.8% |
| Capiz, 2nd District | Region VI | 301 | 73,009 | 127 | 1.7 | 58 | 45.7% |
| City of Iloilo , Lone District | Region VI | 64 | 79,987 | 187 | 2.3 | 52 | 27.7% |
| Guimaras, Lone District | Region VI | 115 | 41,069 | 97 | 2.4 | 55 | 56.6% |
| Iloilo, 1st District | Region VI | 197 | 70,605 | 302 | 4.3 | 66 | 21.8% |
| Iloilo, 2nd District | Region VI | 176 | 73,087 | 297 | 4.1 | 53 | 17.9% |
| Iloilo, 3rd District | Region VI | 322 | 99,241 | 385 | 3.9 | 78 | 20.3% |
| Iloilo, 4th District | Region VI | 228 | 87,455 | 264 | 3.0 | 63 | 23.9% |
| Iloilo, 5th District | Region VI | 290 | 113,671 | 449 | 4.0 | 67 | 14.9% |
| Iloilo, Lone District | Region VI | 2 | 1,679 | 0 | 0.0 | 0 | No shortage |
| City of Bacolod , Lone District | NIR | 71 | 122,456 | 486 | 4.0 | 102 | 21.0% |
| Negros Occidental, 1st District | NIR | 200 | 91,634 | 315 | 3.4 | 59 | 18.7% |
| Negros Occidental, 2nd District | NIR | 153 | 91,513 | 308 | 3.4 | 55 | 17.9% |
| Negros Occidental, 3rd District | NIR | 154 | 109,342 | 351 | 3.2 | 60 | 17.1% |
| Negros Occidental, 4th District | NIR | 131 | 82,814 | 174 | 2.1 | 98 | 56.5% |
| Negros Occidental, 5th District | NIR | 214 | 111,852 | 471 | 4.2 | 64 | 13.6% |
| Negros Occidental, 6th District | NIR | 295 | 129,299 | 696 | 5.4 | 64 | 9.2% |
| Negros Oriental, 1st District | NIR | 326 | 104,315 | 688 | 6.6 | 61 | 8.9% |
| Negros Oriental, 2nd District | NIR | 305 | 119,401 | 589 | 4.9 | 99 | 16.8% |
| Negros Oriental, 3rd District | NIR | 284 | 111,173 | 477 | 4.3 | 64 | 13.4% |
| Siquijor, Lone District | NIR | 78 | 20,087 | 24 | 1.2 | 41 | 169.4% |
| Bohol, 1st District | Region VII | 314 | 90,143 | 507 | 5.6 | 75 | 14.8% |
| Bohol, 2nd District | Region VII | 396 | 109,173 | 743 | 6.8 | 83 | 11.2% |
| Bohol, 3rd District | Region VII | 420 | 91,623 | 470 | 5.1 | 79 | 16.8% |
| Cebu, 1st District | Region VII | 246 | 179,749 | 2,107 | 11.7 | 106 | 5.0% |
| Cebu, 2nd District | Region VII | 337 | 116,917 | 655 | 5.6 | 140 | 21.4% |
| Cebu, 3rd District | Region VII | 291 | 153,749 | 1,509 | 9.8 | 69 | 4.6% |
| Cebu, 4th District | Region VII | 242 | 132,960 | 602 | 4.5 | 51 | 8.5% |
| Cebu, 5th District | Region VII | 268 | 137,787 | 965 | 6.9 | 74 | 7.7% |
| Cebu, 6th District | Region VII | 47 | 44,868 | 550 | 12.3 | 41 | 7.5% |
| City of Cebu , 1st District | Region VII | 50 | 71,975 | 350 | 4.9 | 0 | 0.0% |
| City of Cebu , 2nd District | Region VII | 57 | 104,906 | 676 | 6.4 | 20 | 3.0% |
| City of Lapu-Lapu, 1st District | Region VII | 2 | 748 | 25 | 33.4 | 8 | 32.0% |
| City of Lapu-Lapu, 6th District | Region VII | 67 | 99,946 | 1,009 | 10.1 | 125 | 12.4% |
| City of Mandaue, 1st District | Region VII | 1 | 1,187 | 10 | 8.4 | 0 | 0.0% |
| City of Mandaue, 6th District | Region VII | 44 | 63,469 | 677 | 10.7 | 21 | 3.1% |
| Biliran, Lone District | Region VIII | 143 | 47,627 | 97 | 2.0 | 98 | 100.8% |
| City of Tacloban , 1st District | Region VIII | 60 | 54,153 | 159 | 2.9 | 57 | 35.7% |
| Eastern Samar, Lone District | Region VIII | 524 | 116,151 | 700 | 6.0 | 106 | 15.2% |
| Leyte, 1st District | Region VIII | 215 | 68,442 | 220 | 3.2 | 7 | 3.2% |
| Leyte, 2nd District | Region VIII | 432 | 106,358 | 495 | 4.7 | 52 | 10.5% |
| Leyte, 3rd District | Region VIII | 149 | 40,871 | 183 | 4.5 | 31 | 17.0% |
| Leyte, 4th District | Region VIII | 281 | 115,062 | 353 | 3.0 | 116 | 32.9% |
| Leyte, 5th District | Region VIII | 376 | 93,274 | 392 | 4.2 | 63 | 16.1% |
| Northern Samar, 1st District | Region VIII | 280 | 87,206 | 541 | 6.2 | 36 | 6.7% |
| Northern Samar, 2nd District | Region VIII | 328 | 77,054 | 609 | 7.8 | 40 | 6.6% |
| Samar, 1st District | Region VIII | 420 | 85,674 | 777 | 8.9 | 87 | 11.2% |
| Samar, 2nd District | Region VIII | 560 | 119,119 | 1,080 | 9.0 | 153 | 14.2% |
| Southern Leyte, Lone District | Region VIII | 420 | 86,038 | 384 | 4.5 | 81 | 21.1% |
| City of Isabela (Not a Province), Lone District | Region IX | 64 | 32,596 | 207 | 6.4 | 37 | 17.8% |
| City of Zamboanga, 1st District | Region IX | 72 | 107,318 | 872 | 8.1 | 52 | 6.0% |
| City of Zamboanga, 2nd District | Region IX | 143 | 130,082 | 1,160 | 8.9 | 3 | 0.3% |
| Sulu, 1st District | Region IX | 230 | 90,709 | 1,257 | 13.9 | 81 | 6.4% |
| Sulu, 2nd District | Region IX | 218 | 51,832 | 916 | 17.5 | 23 | 2.5% |
| Zamboanga Sibugay, 1st District | Region IX | 245 | 67,296 | 552 | 8.2 | 65 | 11.8% |
| Zamboanga Sibugay, 2nd District | Region IX | 261 | 92,835 | 755 | 8.1 | 42 | 5.6% |
| Zamboanga del Norte, 1st District | Region IX | 225 | 56,403 | 403 | 7.1 | 62 | 15.4% |
| Zamboanga del Norte, 2nd District | Region IX | 300 | 102,559 | 570 | 5.6 | 88 | 15.4% |
| Zamboanga del Norte, 3rd District | Region IX | 338 | 101,488 | 803 | 7.9 | 54 | 6.7% |
| Zamboanga del Sur, 1st District | Region IX | 479 | 140,144 | 981 | 7.0 | 73 | 7.4% |
| Zamboanga del Sur, 2nd District | Region IX | 410 | 96,125 | 348 | 3.5 | 47 | 13.5% |
| Bukidnon, 1st District | Region X | 170 | 80,902 | 923 | 11.4 | 23 | 2.5% |
| Bukidnon, 2nd District | Region X | 226 | 108,094 | 1,241 | 11.5 | 66 | 5.3% |
| Bukidnon, 3rd District | Region X | 275 | 118,345 | 1,490 | 12.5 | 118 | 7.9% |
| Bukidnon, 4th District | Region X | 127 | 76,139 | 868 | 11.4 | 81 | 9.3% |
| Camiguin, Lone District | Region X | 66 | 22,324 | 187 | 8.4 | 29 | 15.5% |
| City of Cagayan De Oro , 1st District | Region X | 70 | 69,626 | 398 | 5.7 | 80 | 20.1% |
| City of Cagayan De Oro , 2nd District | Region X | 44 | 78,986 | 433 | 5.5 | 144 | 33.3% |
| City of Iligan, Lone District | Region X | 110 | 80,416 | 638 | 7.9 | 63 | 9.9% |
| Lanao Del Norte, Lone District | Region X | 2 | 322 | 0 | 0.0 | 0 | No shortage |
| Lanao del Norte, 1st District | Region X | 176 | 66,181 | 622 | 9.4 | 62 | 10.0% |
| Lanao del Norte, 2nd District | Region X | 205 | 73,885 | 859 | 11.6 | 71 | 8.3% |
| Misamis Occidental, 1st District | Region X | 252 | 53,865 | 260 | 4.8 | 64 | 24.6% |
| Misamis Occidental, 2nd District | Region X | 259 | 77,223 | 255 | 3.3 | 90 | 35.3% |
| Misamis Oriental, 1st District | Region X | 288 | 100,435 | 999 | 9.9 | 72 | 7.2% |
| Misamis Oriental, 2nd District | Region X | 251 | 125,670 | 1,161 | 9.2 | 118 | 10.2% |
| City of Davao, 1st District | Region XI | 71 | 129,070 | 1,613 | 12.5 | 7 | 0.4% |
| City of Davao, 2nd District | Region XI | 122 | 107,243 | 1,323 | 12.3 | 11 | 0.8% |
| City of Davao, 3rd District | Region XI | 236 | 135,079 | 1,109 | 8.2 | 15 | 1.4% |
| Davao Del Sur, 3rd District | Region XI | 1 | Not given | 0 | Not given | 0 | No shortage |
| Davao Occidental, 1st District | Region XI | 176 | 65,881 | 452 | 6.8 | 39 | 8.6% |
| Davao Occidental, Lone District | Region XI | 37 | 7,289 | 100 | 13.7 | 6 | 6.0% |
| Davao Oriental, 1st District | Region XI | 203 | 56,738 | 270 | 4.7 | 37 | 13.7% |
| Davao Oriental, 2nd District | Region XI | 195 | 89,345 | 515 | 5.8 | 52 | 10.1% |
| Davao de Oro, 1st District | Region XI | 182 | 82,974 | 353 | 4.2 | 73 | 20.7% |
| Davao de Oro, 2nd District | Region XI | 237 | 101,733 | 321 | 3.1 | 84 | 26.1% |
| Davao del Norte, 1st District | Region XI | 219 | 124,132 | 707 | 5.7 | 90 | 12.7% |
| Davao del Norte, 2nd District | Region XI | 219 | 133,003 | 1,056 | 7.9 | 57 | 5.4% |
| Davao del Sur, 1st District | Region XI | 232 | 127,245 | 641 | 5.0 | 80 | 12.5% |
| Davao del Sur, 2nd District | Region XI | 76 | 19,895 | 71 | 3.2 | 14 | 19.7% |
| City of General Santos, 1st District | Region XII | 103 | 153,648 | 791 | 5.2 | 29 | 3.7% |
| Cotabato, 1st District | Region XII | 272 | 116,741 | 1,202 | 10.2 | 40 | 3.3% |
| Cotabato, 2nd District | Region XII | 378 | 118,791 | 1,306 | 10.9 | 54 | 4.1% |
| Cotabato, 3rd District | Region XII | 198 | 80,273 | 925 | 11.2 | 37 | 4.0% |
| Sarangani, Lone District | Region XII | 323 | 141,057 | 1,487 | 10.4 | 58 | 3.9% |
| South Cotabato, 1st District | Region XII | 105 | 68,552 | 324 | 4.7 | 25 | 7.7% |
| South Cotabato, 2nd District | Region XII | 330 | 165,199 | 1,094 | 6.6 | 99 | 9.1% |
| Sultan Kudarat, 1st District | Region XII | 173 | 88,619 | 409 | 4.6 | 92 | 22.5% |
| Sultan Kudarat, 2nd District | Region XII | 257 | 90,409 | 743 | 8.0 | 43 | 5.8% |
| Agusan del Norte, 1st District | CARAGA | 35 | 9,092 | 24 | 2.4 | 0 | 0.0% |
| Agusan del Norte, 2nd District | CARAGA | 207 | 81,554 | 342 | 4.2 | 82 | 24.0% |
| Agusan del Sur, 1st District | CARAGA | 308 | 91,357 | 427 | 4.6 | 22 | 5.2% |
| Agusan del Sur, 2nd District | CARAGA | 279 | 96,568 | 595 | 6.2 | 66 | 11.1% |
| Agusan del Sur, Lone District | CARAGA | 1 | 1,108 | 0 | 0.0 | 0 | No shortage |
| City of Butuan , 1st District | CARAGA | 138 | 87,533 | 521 | 5.9 | 118 | 22.7% |
| Dinagat Islands, Lone District | CARAGA | 142 | 28,139 | 624 | 22.2 | 25 | 4.0% |
| Surigao del Norte, 1st District | CARAGA | 146 | 33,796 | 189 | 5.6 | 32 | 16.9% |
| Surigao del Norte, 2nd District | CARAGA | 287 | 95,742 | 468 | 4.9 | 54 | 11.5% |
| Surigao del Sur, 1st District | CARAGA | 309 | 94,682 | 853 | 9.0 | 75 | 8.8% |
| Surigao del Sur, 2nd District | CARAGA | 244 | 63,857 | 367 | 5.8 | 53 | 14.4% |
| Basilan, 1st District | BARMM | 2 | 426 | 10 | 23.5 | 0 | 0.0% |
| Basilan, Lone District | BARMM | 229 | 77,926 | 1,178 | 15.1 | 12 | 1.0% |
| Lanao del Sur, 1st District | BARMM | 460 | 146,708 | 1,916 | 13.0 | 47 | 2.5% |
| Lanao del Sur, 2nd District | BARMM | 399 | 109,761 | 1,575 | 14.3 | 29 | 1.8% |
| Maguindanao del Norte, 1st District | BARMM | 346 | 171,531 | 1,931 | 11.2 | 27 | 1.4% |
| Maguindanao del Norte, 2nd District | BARMM | 11 | 3,756 | 63 | 16.8 | 0 | 0.0% |
| Maguindanao del Sur, 1st District | BARMM | 15 | 3,056 | 86 | 28.1 | 0 | 0.0% |
| Maguindanao del Sur, 2nd District | BARMM | 315 | 138,001 | 1,851 | 13.3 | 48 | 2.6% |
| Special Geographic Area, 1st District | BARMM | 90 | 31,511 | 388 | 12.3 | 0 | 0.0% |
| Special Geographic Area, 2nd District | BARMM | 2 | 864 | 16 | 18.5 | 0 | 0.0% |
| Special Geographic Area, 3rd District | BARMM | 18 | 5,467 | 93 | 17.0 | 0 | 0.0% |
| Special Geographic Area, No Legislative District | BARMM | 1 | 460 | 5 | 10.9 | 0 | 0.0% |
| Tawi-Tawi, Lone District | BARMM | 262 | 80,627 | 1,952 | 24.2 | 30 | 1.5% |
Frequently asked questions
Which congressional district has the biggest classroom shortage?
Rizal, 2nd District in Region IV-A, with 4,522 classrooms in DepEd’s 2023 data, followed by Rizal, 1st District (3,993) and City of Caloocan, 1st District (3,324). The SBP 2026 list holds 166 classrooms for Rizal, 2nd District, 3.7% of its shortage.
Which district has the highest classroom shortage per learner?
Among the 237 districts with 20,000 learners or more, Tawi-Tawi, Lone District, short 24.2 classrooms per 1,000 learners in SY 2024-25, followed by Dinagat Islands, Lone District (22.2) and Quezon City, 2nd District (18.8). The national rate is 7.4.
How many SBP 2026 classrooms does my congressional district get?
Find your district in the full table above: it gives the SBP 2026 classrooms at the district’s schools and their share of its 2023 shortage. Of the 32,419 classrooms on the list, 31,907 can be placed in a district; the other 512 are at schools with no 2023 record. The list is a plan; it does not mean the classrooms are built.
Why is a district missing from the rankings?
Two rules apply. The 12 labels attached to three schools or fewer look like slips in DepEd’s table, so they are shown in the full table but not ranked. And rates per learner are ranked only among districts with 20,000 learners or more, because a few classrooms can swing a small district’s rate.
Download the data and cite this post
The cleaned EDCOM II classroom data behind this series are free to download for personal study; to reuse them, email support@nash.com.ph for written permission first. How the EDCOM Classroom Data Was Cleaned explains every table and cleaning rule. The files are at data.nash.com.ph: start with the README, then the school table (Parquet, or CSV), the School Building Program lines (CSV), the city and municipality table (CSV), and every table for Stata and SPSS. Every district figure in this post can be computed from the school table, grouped by congressional_district after merging labels that differ only in capitalization.
Every file, with its rows, columns and checksum, is listed on the EDCOM II classroom data page. To cite the data: Llego, M. A. (2026). EDCOM II classroom construction dashboard data, cleaned, version 1.1. NASH Reviewer. https://nash.com.ph/edcom-classroom-data
To cite this post: Llego, M. A. (2026, October 28). Classroom shortage by congressional district, 2023–2026. NASH Reviewer Blog. https://nash.com.ph/blog/classroom-shortage-by-congressional-district
References
- Efron, B., & Tibshirani, R. J. (1993). An introduction to the bootstrap. Chapman & Hall.
- Gini, C. (1912). Variabilità e mutabilità. Tipografia di Paolo Cuppini.
- Llego, M. A. (2026). EDCOM II classroom construction dashboard data, cleaned, version 1.1 [Data set]. NASH Reviewer. https://nash.com.ph/edcom-classroom-data
- Second Congressional Commission on Education (EDCOM II). (2025, November 13). Clarity needed on the implementation of 23 national education laws in BARMM [News release].
- Second Congressional Commission on Education (EDCOM II). (2026). National Education Plan 2026–2035 (Year Three report).
- Second Congressional Commission on Education (EDCOM II). (2026, October 20). Put classrooms where they’re needed most, EDCOM 2 tells DepEd [News release]. https://edcom2.gov.ph/put-classrooms-where-theyre-needed-most-edcom-2-tells-deped/
- Spearman, C. (1904). The proof and measurement of association between two things. American Journal of Psychology, 15(1), 72–101.
- Theil, H. (1967). Economics and information theory. North-Holland.
More in this series
- How the EDCOM Classroom Data Was Cleaned
- Philippine Classroom Shortage 2023: Where the Gap Is
- DepEd School Building Program 2026 in Numbers
- Do 2026 Classrooms Go Where the Shortage Is?
- Classroom Allocation by LGU Income Class, 2026
- Class Shifts and Crowded Classrooms in DepEd Schools
- Last Mile Schools: Classroom Need and 2026 Allocation
- Regional reports: NCR, CAR, Region I, Region II, Region III, Region IV-A, MIMAROPA, Region V, Region VI, NIR, Region VII, Region VIII, Region IX, Region X, Region XI, Region XII, Caraga, BARMM
- Rankings and deep dives: Congressional districts, Top 20 cities and municipalities, Rizal, Quezon City, City of Manila, Tawi-Tawi, Cavite, Cost of a classroom
- Explainers: PSIP III, Senior high shortage, Junior high shortage, Excess classrooms, Learning Continuity Spaces, How learners reach school
- For teachers and school heads: Action research and thesis topics
- Related: DepEd Classroom and School Building Data, SY 2023-2024, EDCOM II Final Report: Guide for Aspiring School Heads, DepEd School Improvement Plan (SIP): Steps, AIP and SRC, How to Read DepEd Data: A Guide for Aspiring School Heads, PPSSH Domain 2: Managing School Operations With DepEd Data
Analysis and charts by Mark Anthony Llego for NASH Reviewer. Data: EDCOM II classroom construction dashboard and Department of Education data. NASH Reviewer is not affiliated with EDCOM II or DepEd. Charts may be reused only with written permission from support@nash.com.ph.