The City of Manila receives 1,890 classrooms under the School Building Program (SBP) 2026, the most of any city or municipality in the Philippines and 5.8% of the national list. Set against the Manila schools division’s 2023 shortage of 2,773 classrooms, from DepEd’s data as published in the EDCOM II classroom construction dashboard, the list equals 68.2% of it, against 19.6% nationally and 18.4% in NCR. But 1,813 of the 1,890 (95.9%) are PSIP III classrooms, under the third Public-Private Partnership for School Infrastructure Project, which is still for bidding, with construction expected from March 2027 to July 2028. Only 77 are funded under the General Appropriations Act (GAA) 2026. The largest single line in the country, 160 classrooms, is at a Manila school.
The shortage itself is 11.0 classrooms for every 1,000 learners enrolled in SY 2024-25, 1.5 times the national rate of 7.4, and 79.0% of the city’s public schools have one. It is heaviest in the 1st District, as DepEd’s 2023 data label it: 1,022 classrooms, 36.9% of the city’s shortage, at 16.4 per 1,000 learners. School by school, 922 of the 1,890 classrooms (48.8%) fall within the receiving school’s own 2023 shortage, and the rest go beyond it or to schools that reported none, so the list meets 33.3% of the shortage and leaves 1,851 classrooms unmet. Listed schools tend to have larger shortages than unlisted ones, medians of 30.2 and 19.0 classrooms, but with 83 schools the tilt is not statistically clear.
Classroom Shortage in NCR, 2023–2026: Shifts and Crowding sets Manila among Metro Manila’s 16 divisions. The figures below, from the cleaned school-level data behind the dashboard, cover the Manila schools division school by school and district by district. Every file is listed on the EDCOM II classroom data page.
Key findings
- The City of Manila receives 1,890 SBP 2026 classrooms, the most of any city or municipality, equal to 68.2% of the division’s 2023 shortage of 2,773 classrooms.
- 1,813 of them (95.9%) are PSIP III classrooms still for bidding; only 77, on DPWH lines with PHP 0.49 billion, are funded under the GAA 2026.
- The largest single line in the country, 160 PSIP III classrooms, is at F. G. Calderon Elementary School, which was short 83 classrooms in 2023.
- The 1st District holds 1,022 classrooms of the shortage (36.9%) and the highest rate, 16.4 per 1,000 learners; the 2nd District is listed for 462 classrooms against a shortage of 334 (138.4%).
- School by school, 922 classrooms (48.8%) fall within the receiving school’s own shortage, 786 go beyond it and 182 go to four schools with none, so the list meets 33.3% of the shortage and leaves 1,851 unmet.
- The three schools with the largest shortages, R. Almario Elementary School (175), Tondo High School (165) and Ramon Magsaysay High School (142), are not on the list.
- 72 of 105 schools (68.6%) held classes in two or more shifts in SY 2024-25, more than NCR’s 62.2%.
The City of Manila against NCR and the country
The table sets the city’s main indicators beside NCR’s and the country’s, with the same definition in each column. The NCR and national figures are from the NCR report.
| Indicator | City of Manila | NCR | Philippines |
|---|---|---|---|
| Schools in the 2023 shortage data | 105 | 827 | 47,659 |
| Schools with a classroom shortage | 79.0% | 80.4% | 54.2% |
| Classroom shortage (2023) | 2,773 | 24,866 | 165,443 |
| Shortage per 1,000 learners | 11.0 | 12.2 | 7.4 |
| Median shortage of a school with a shortage | 21.0 | 26.0 | 3.0 |
| SBP 2026 classrooms | 1,890 | 4,584 | 32,419 |
| SBP 2026 classrooms as a share of the shortage | 68.2% | 18.4% | 19.6% |
| PSIP III share of SBP 2026 classrooms | 95.9% | 83.1% | 50.3% |
| Schools with a shortage that get any SBP 2026 classroom | 36.1% | 23.0% | 13.3% |
| SBP classrooms within the receiving school’s shortage | 48.8% | 60.9% | 53.0% |
| Schools with two or more shifts (SY 2024-25) | 68.6% | 62.2% | 4.3% |
| Median learners per classroom, elementary | 41.2 | 51.5 | 24.9 |
| Median learners per classroom, junior high | 39.9 | 52.8 | 32.1 |
| Schools using makeshift rooms (2023) | 22.9% | 11.5% | 29.0% |
Two rows set Manila apart from the rest of Metro Manila: the size of its 2026 list, 68.2% of its shortage against 18.4% in NCR, and the share of that list in PSIP III, 95.9%. More than a third of its schools with a shortage get any SBP classroom (36.1%), against 23.0% in NCR. By rate, by the median school’s shortage and by learners per classroom, Manila’s figures are lower than the region’s: 11.0 classrooms per 1,000 learners and a median of 21.0 classrooms at a school with a shortage, against 12.2 and 26.0. More of its schools, though, run shifts.
By count, the Manila division ranks 11th of the country’s 229 schools divisions; by rate, 41st of the 209 divisions with 20,000 learners or more. The 20 cities and municipalities with the largest classroom shortages ranks the City of Manila fourth. The figures here are the Manila division’s. The city as the Philippine Standard Geographic Code (PSGC) draws it, used in that ranking and in the NCR report’s city table, is short 2,771 classrooms, because one school of the Manila division is placed in the City of Marikina; its SBP total, 1,890, is the same.
Kindergarten to Grade 10 accounts for 2,629 classrooms of the shortage and senior high school for 144 (5.2%). The 10 schools with the largest shortages, the top 10% of the city’s schools, hold 38.3% of it, close to NCR’s 38.9% and far below the 66.0% nationally, and it takes 16 schools (15.2%) to reach half; 65 schools are short by 10 or more. At the same time, 26 schools report more Kindergarten to Grade 10 classrooms than they need, 256 in all; one school’s extra rooms do not reduce another school’s shortage. The city has no Last Mile Schools.
Classroom shortage by congressional district in Manila
DepEd’s 2023 shortage table places every Manila school in one of six congressional districts. The labels are DepEd’s; they divide the city into parts and say nothing about any representative, and the data show where the shortage and the 2026 classrooms are, not why. Classroom Shortage by Congressional District, 2023–2026 sets these six beside the country’s 259 districts.
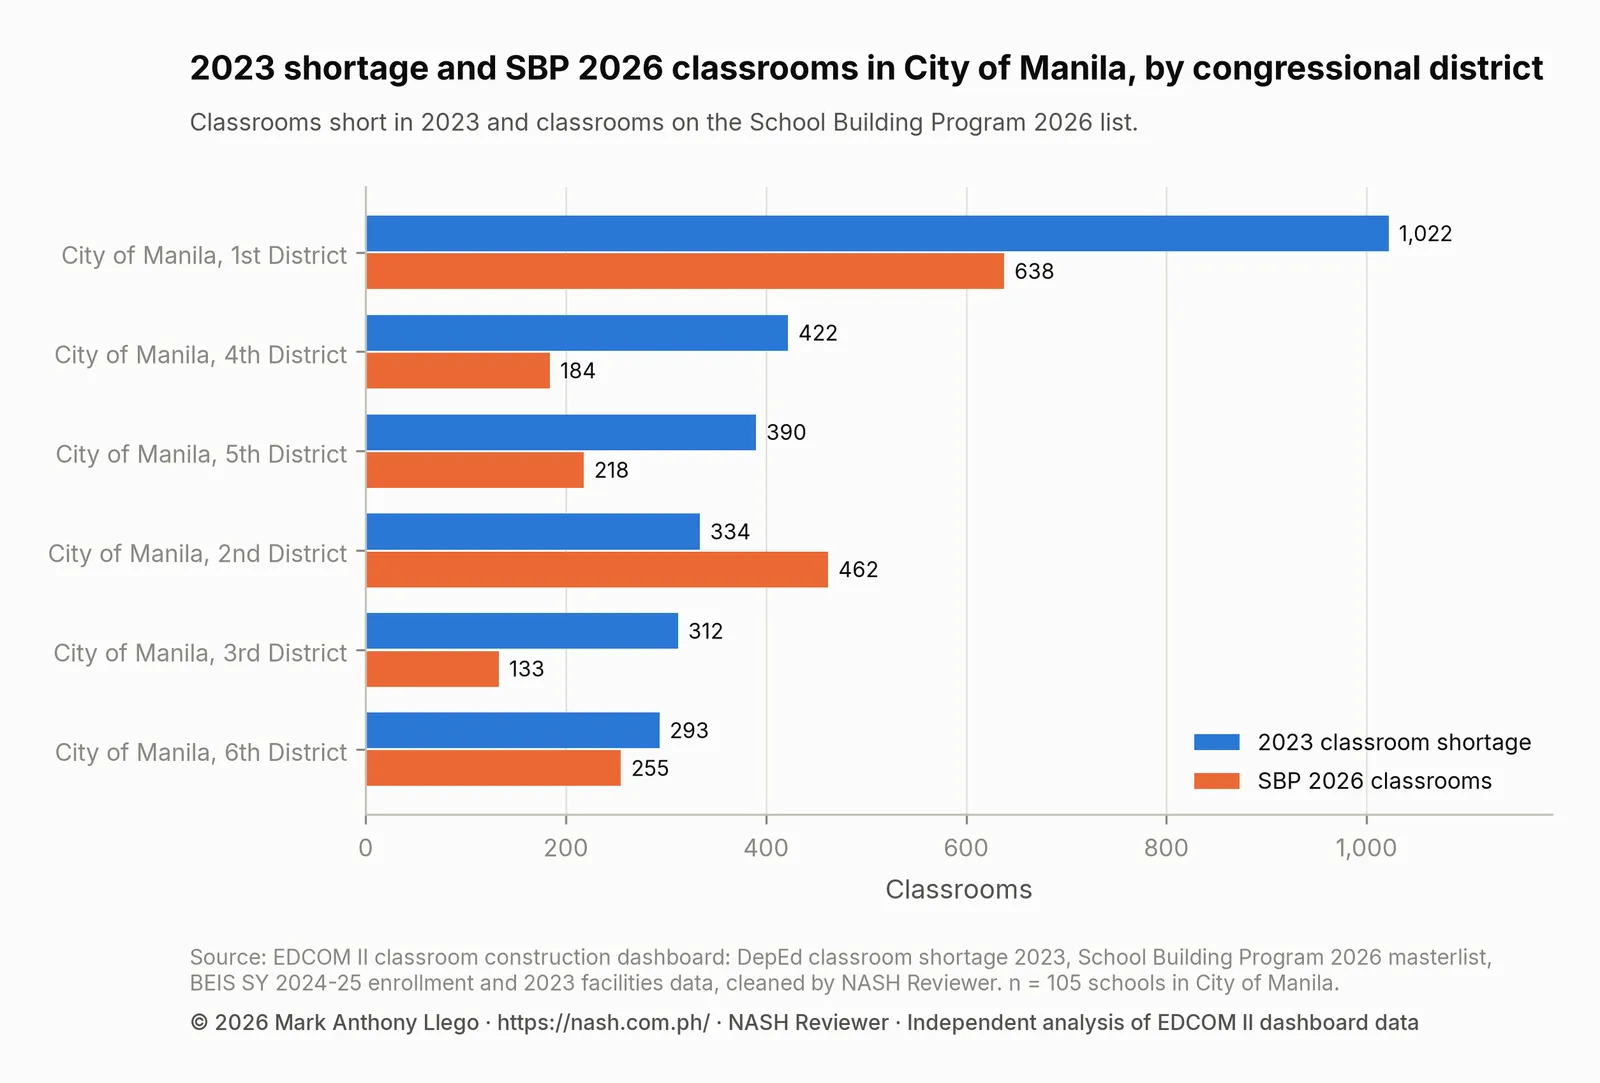
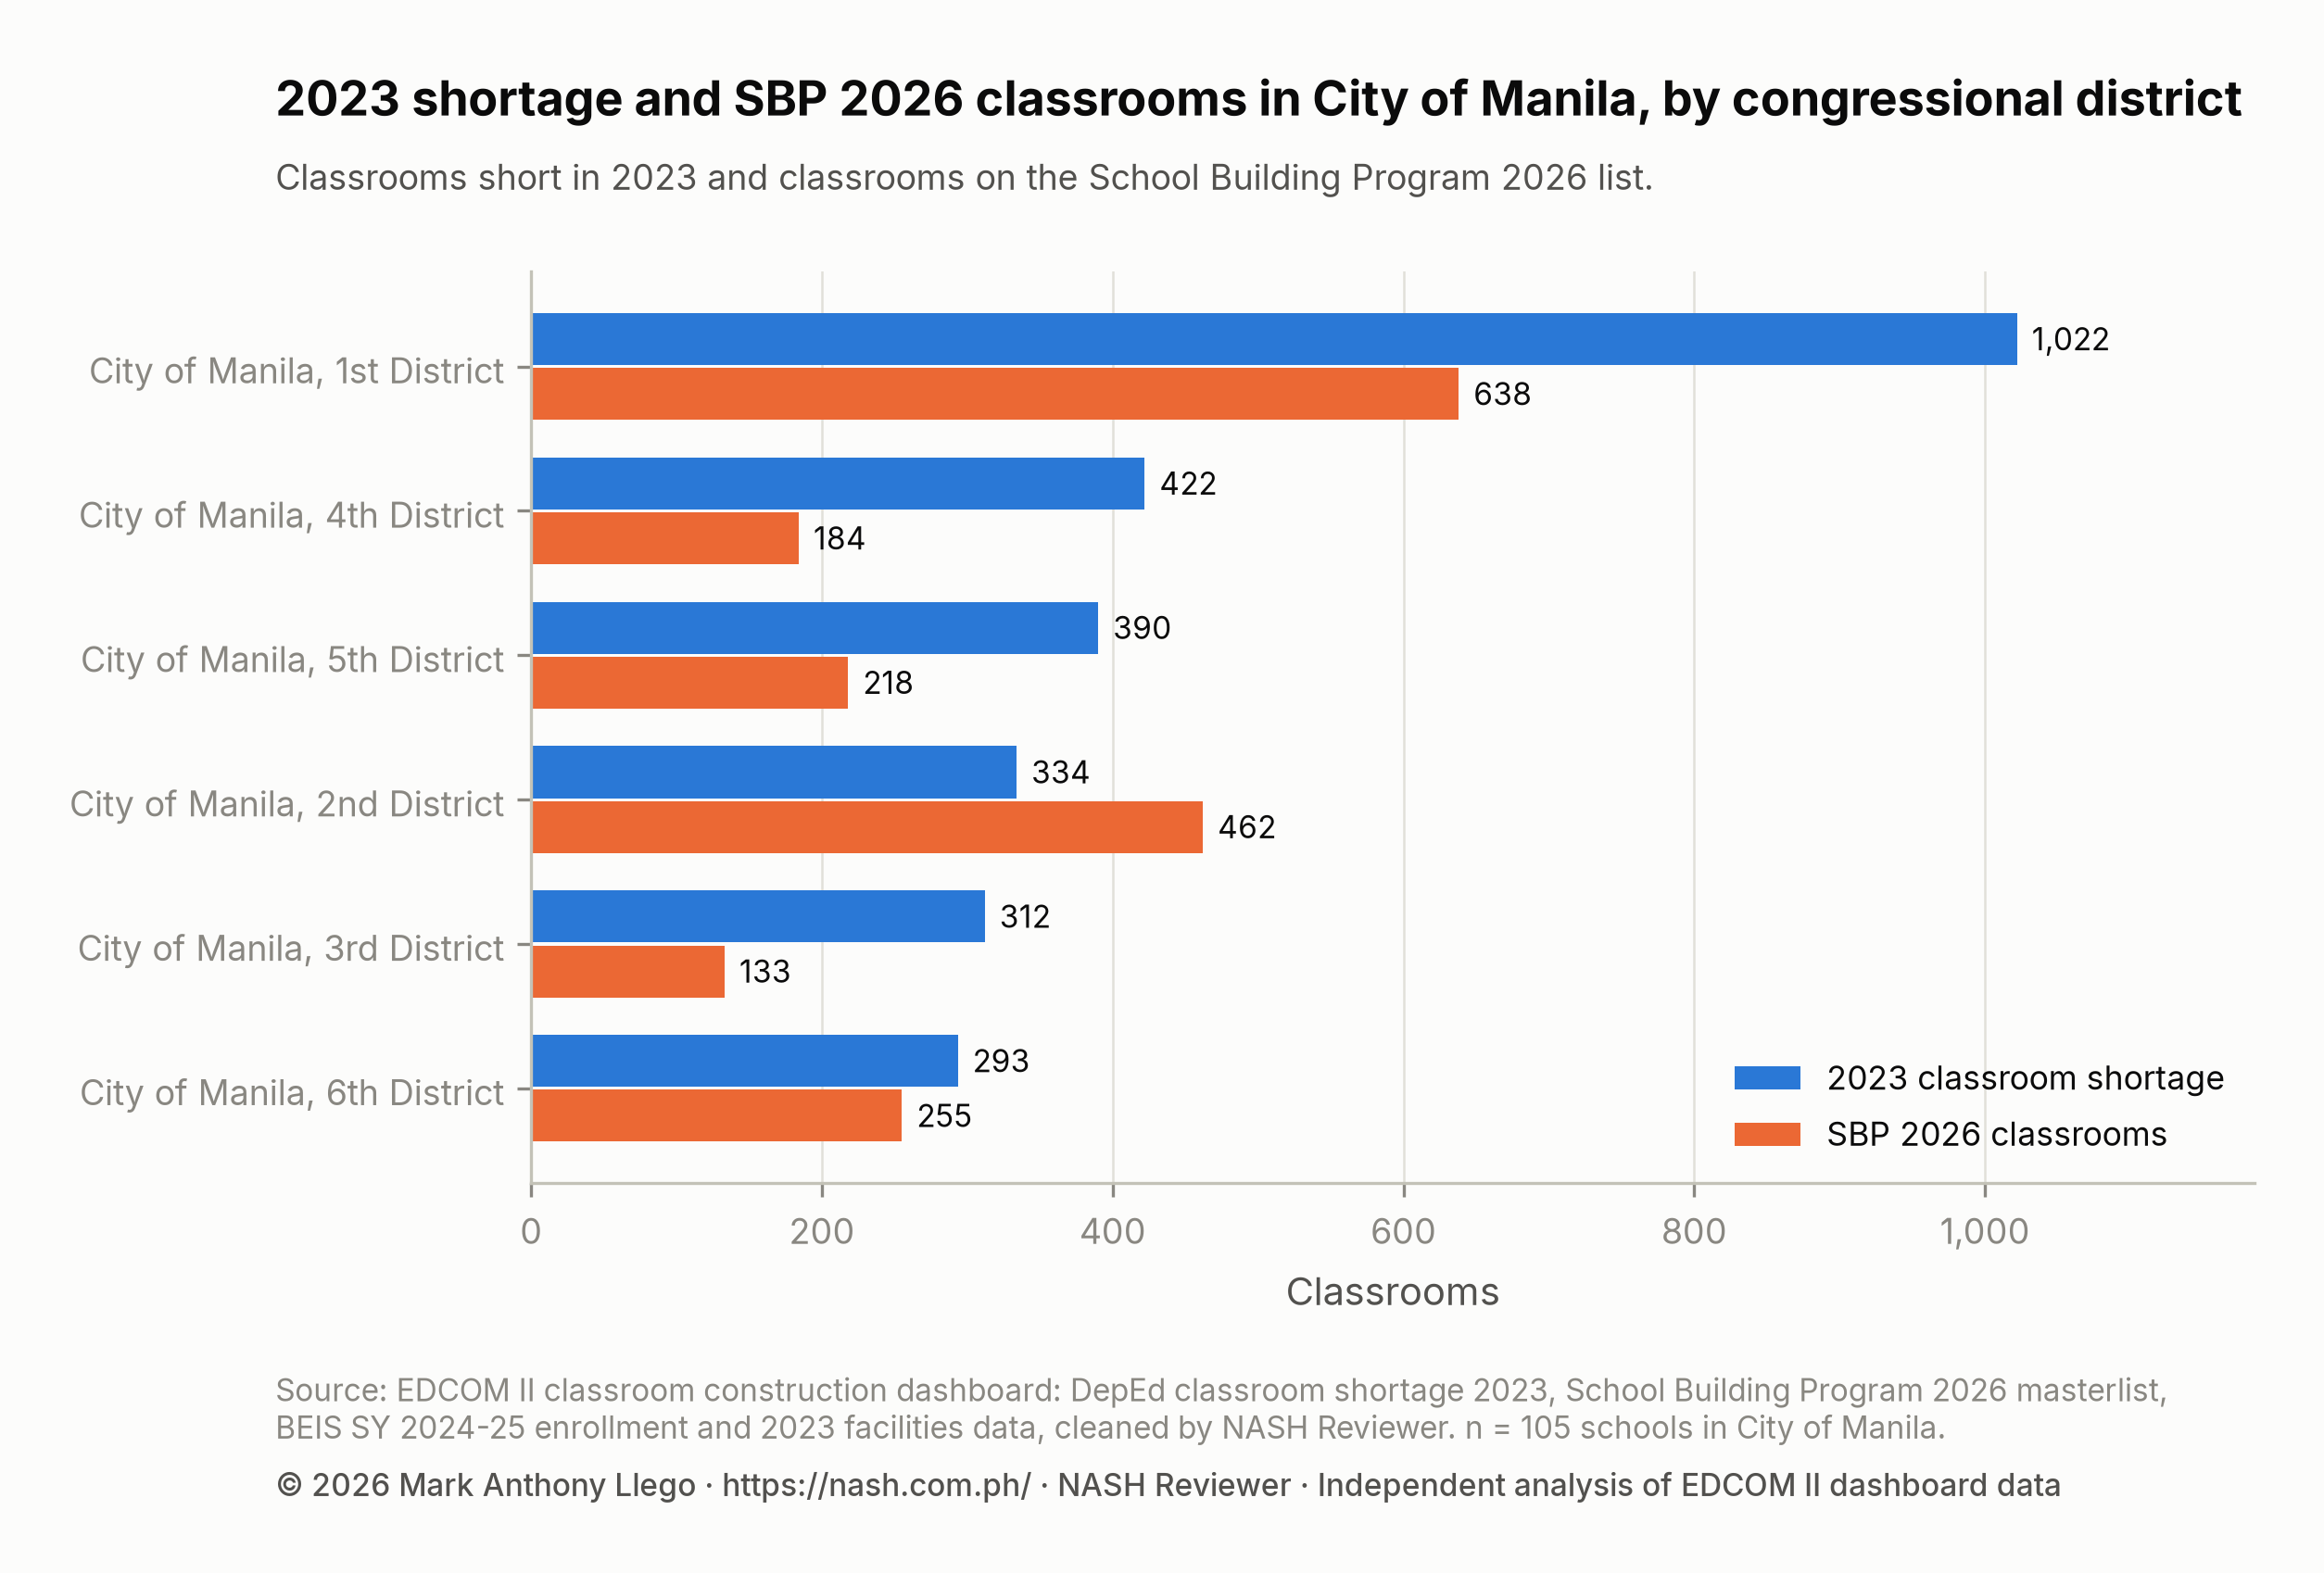
Unlike in Quezon City, every district’s orange bar is a sizable fraction of its blue one, and in the 2nd District it is longer. The 1st District has by far the largest shortage, 1,022 classrooms, and the largest list, 638. The other five districts are each short between 293 and 422 classrooms, and their lists run from 133 in the 3rd District to 462 in the 2nd.
| Congressional district | Schools | Learners (SY 2024-25) | Classroom shortage (2023) | Shortage per 1,000 learners | Schools with a shortage | Schools on shifts | SBP 2026 classrooms | Coverage |
|---|---|---|---|---|---|---|---|---|
| City of Manila, 1st District | 18 | 62,445 | 1,022 | 16.4 | 100.0% | 15 | 638 | 62.4% |
| City of Manila, 4th District | 19 | 32,002 | 422 | 13.2 | 73.7% | 7 | 184 | 43.6% |
| City of Manila, 5th District | 16 | 48,331 | 390 | 8.1 | 81.3% | 14 | 218 | 55.9% |
| City of Manila, 2nd District | 19 | 37,893 | 334 | 8.8 | 84.2% | 14 | 462 | 138.4% |
| City of Manila, 3rd District | 16 | 40,345 | 312 | 7.7 | 68.8% | 12 | 133 | 42.6% |
| City of Manila, 6th District | 17 | 31,846 | 293 | 9.2 | 64.7% | 10 | 255 | 86.9% |
Every one of the 1st District’s 18 schools has a shortage (100.0%), and 15 hold classes in shifts. Its rate, 16.4 classrooms per 1,000 learners, is the fifth highest of the 237 congressional districts in the country with 20,000 learners or more, and its list covers 62.4% of its shortage. The 4th District has the next highest rate, 13.2, and a coverage of 43.6%. The 3rd District has both the lowest rate, 7.7, and the lowest coverage, 42.6%.
The 2nd District is the only one listed for more than its shortage: 462 classrooms against 334, or 138.4%, one of 17 districts in the country listed for their whole shortage or more. It holds the largest single line in the country, 160 classrooms at F. G. Calderon Elementary School. Even Manila’s lowest district coverage, 42.6%, is above the national 19.6% and above the highest in Quezon City, 30.6% (Quezon City Classroom Shortage: Districts and Schools).
Schools with the largest classroom shortages in Manila
The 15 schools with the largest shortages lack 1,358 classrooms between them, 49.0% of the city’s shortage. Five are in the 1st District, 12 hold classes in shifts, and five are on the SBP 2026 list. Each can be looked up by its school ID in the school table.
| School ID | School | Congressional district | Barangay | Learners (SY 2024-25) | Learners per classroom | Classroom shortage (2023) | SBP 2026 classrooms | Two or more shifts |
|---|---|---|---|---|---|---|---|---|
| 136441 | R. Almario Elementary School | City of Manila, 1st District | Barangay 20 | 6,283 | 27.2 | 175 | 0 | No |
| 305291 | Tondo High School | City of Manila, 1st District | Barangay 123 | 5,935 | 53.0 | 165 | 0 | Yes |
| 305306 | Ramon Magsaysay High School | City of Manila, 4th District | Barangay 479 | 4,798 | Not given | 142 | 0 | Yes |
| 305288 | Dr. Juan G. Nolasco High School | City of Manila, 1st District | Barangay 91 | 2,957 | 41.6 | 94 | 120 | Yes |
| 136439 | Isabelo Delos Reyes Elementary School | City of Manila, 1st District | Barangay 4 | 6,038 | 83.9 | 90 | 0 | Yes |
| 136457 | Dr. A. Albert Elementary School | City of Manila, 4th District | Barangay 521 | 2,905 | 242.1 | 87 | 0 | No |
| 136968 | Sen. Benigno S. Aquino Jr. ES | City of Manila, 5th District | Barangay 649 | 5,391 | 87.0 | 86 | 0 | Yes |
| 500567 | F. G. Calderon Elementary School | City of Manila, 2nd District | Barangay 201 | 5,080 | 40.0 | 83 | 160 | Yes |
| 305319 | Eulogio Rodriguez Vocational High School | City of Manila, 6th District | Barangay 634 | 2,083 | 27.4 | 73 | 0 | Yes |
| 136434 | Gen. Vicente Lim Elementary School | City of Manila, 1st District | Barangay 106 | 3,940 | 56.3 | 66 | 50 | Yes |
| 305302 | Jose Abad Santos High School | City of Manila, 3rd District | Barangay 314 | 5,947 | 56.6 | 63 | 0 | Yes |
| 136461 | Legarda Elementary School | City of Manila, 4th District | Barangay 522 | 4,799 | 51.6 | 60 | 0 | Yes |
| 319401 | Pres. Corazon C. Aquino High School | City of Manila, 5th District | Barangay 649 | 4,230 | 81.3 | 60 | 88 | Yes |
| 136480 | Bagong Barangay Elementary School | City of Manila, 6th District | Barangay 841 | 2,071 | 76.7 | 58 | 7 | No |
| 136478 | H.J. Atienza Elementary School | City of Manila, 5th District | Barangay 649 | 3,686 | 65.8 | 56 | 0 | Yes |
The three largest shortages are not on the list: R. Almario Elementary School (175), Tondo High School (165) and Ramon Magsaysay High School (142). Of the five that are, three receive more than their 2023 shortage: F. G. Calderon Elementary School (160 against 83), Dr. Juan G. Nolasco High School (120 against 94) and Pres. Corazon C. Aquino High School (88 against 60). Gen. Vicente Lim Elementary School receives 50 against 66, and Bagong Barangay Elementary School 7 against 58.
A few records are worth confirming with the division before they are used for planning. R. Almario Elementary School, the largest shortage in the city, reports no shifts and 27.2 learners per classroom, as the NCR report noted. Dr. A. Albert Elementary School reports 242.1 learners per classroom, also with no shifts, and Ramon Magsaysay High School has no learners-per-classroom figure. The shortage is from 2023 and the learners from SY 2024-25, so the two can disagree.
Legarda Elementary School shares its shortage of 60 with Pres. Corazon C. Aquino High School; ties are broken by enrollment. The SBP masterlist calls F. G. Calderon Elementary School “F.G CALDERON INTEGRATED SCHOOL”.
Where Manila’s 1,890 SBP 2026 classrooms go
The SBP 2026 list has 43 lines for the city: 1,890 classrooms at 35 schools.
| Implementation modality | Lines | Schools | Classrooms | Share of the place’s SBP classrooms | Budget |
|---|---|---|---|---|---|
| PSIP III | 36 | 28 | 1,813 | 95.9% | For bidding |
| DPWH | 7 | 7 | 77 | 4.1% | PHP 0.49 billion |
PSIP III carries 1,813 classrooms on 36 lines at 28 schools. The project is still for bidding, with construction expected from March 2027 to July 2028, so its lines have no budget on the list yet. EDCOM II has reported that PSIP III targets over 16,000 classrooms using an “availability payment” model, and that DepEd launched the “Project Bukas” portal for it (EDCOM II, 2026, February 9); the National Education Plan 2026–2035 targets 15,000 classrooms under PSIP III by 2028 (EDCOM II, 2026). The other 77 classrooms, on seven lines of the Department of Public Works and Highways (DPWH) at seven schools, are funded under the GAA 2026 with PHP 0.49 billion. No line on the list is implemented by the city government; a city may build classrooms with its own funds, which the masterlist would not show.
Manila’s PSIP III lines are large. Nationally, the median PSIP III line has 10.0 classrooms (DepEd School Building Program 2026 in Numbers); the largest in the country, 160 classrooms, is at F. G. Calderon Elementary School. The 10 schools with the most SBP classrooms are below, each beside its own 2023 shortage.
| School | Congressional district | Classroom shortage (2023) | SBP 2026 classrooms | Modality |
|---|---|---|---|---|
| F. G. Calderon Elementary School | City of Manila, 2nd District | 83 | 160 | PSIP III |
| Dr. Juan G. Nolasco High School | City of Manila, 1st District | 94 | 120 | PSIP III |
| Gen. Emilio Aguinaldo Integrated School | City of Manila, 6th District | 28 | 120 | PSIP III |
| Pres. Corazon C. Aquino High School | City of Manila, 5th District | 60 | 88 | PSIP III |
| Lakan Dula High School | City of Manila, 2nd District | 46 | 86 | PSIP III |
| Raja Soliman Science and Technology High School | City of Manila, 3rd District | 40 | 84 | PSIP III |
| Elpidio Quirino High School | City of Manila, 6th District | 0 | 84 | PSIP III |
| Teodoro R. Yangco Elementary School | City of Manila, 1st District | 54 | 80 | PSIP III |
| Manuel L. Quezon Elementary School | City of Manila, 1st District | 50 | 80 | PSIP III |
| Arsenio H. Lacson Elementary School | City of Manila, 1st District | 43 | 80 | PSIP III |
All 10 receive their classrooms on PSIP III lines, and all 10 receive more than their 2023 shortage: Gen. Emilio Aguinaldo Integrated School receives 120 against 28, and Elpidio Quirino High School, with no 2023 shortage, 84. Four of the 10 are in the 1st District.
School by school, 922 of the 1,890 classrooms (48.8%) fall within the receiving school’s own 2023 shortage, below NCR’s 60.9% and the national 53.0%. Another 786 go beyond the receiving school’s shortage, and 182 (9.6%) go to four schools that reported no 2023 shortage. Counted this way, the list meets 33.3% of the city’s shortage and leaves 1,851 classrooms unmet, against the 68.2% that dividing the list by the shortage suggests. Still, 30 of the 83 schools with a shortage (36.1%) receive at least one classroom, against 23.0% in NCR and 13.3% nationally. Do 2026 Classrooms Go Where the Shortage Is? explains why a classroom beyond one school’s shortage meets no other school’s need.
These are 2026 plans set against a 2023 count. Need can change through enrollment, calamity damage and the condition of old buildings, and planners may weigh buildable land, site readiness and other funding, none of which are in these data. A school listed for more than its 2023 shortage is not necessarily a mistake; the data cannot say which applies at each school.
The masterlist also holds two PSIP III lines, 40 classrooms, that each exactly copy another line at the same school, Gen. Maximino Hizon Elementary School, one of the four listed schools with no 2023 shortage. With no project ID, a second identical building cannot be told from a double entry, so the lines are kept in the totals; without them, the city’s list is 1,850 classrooms.
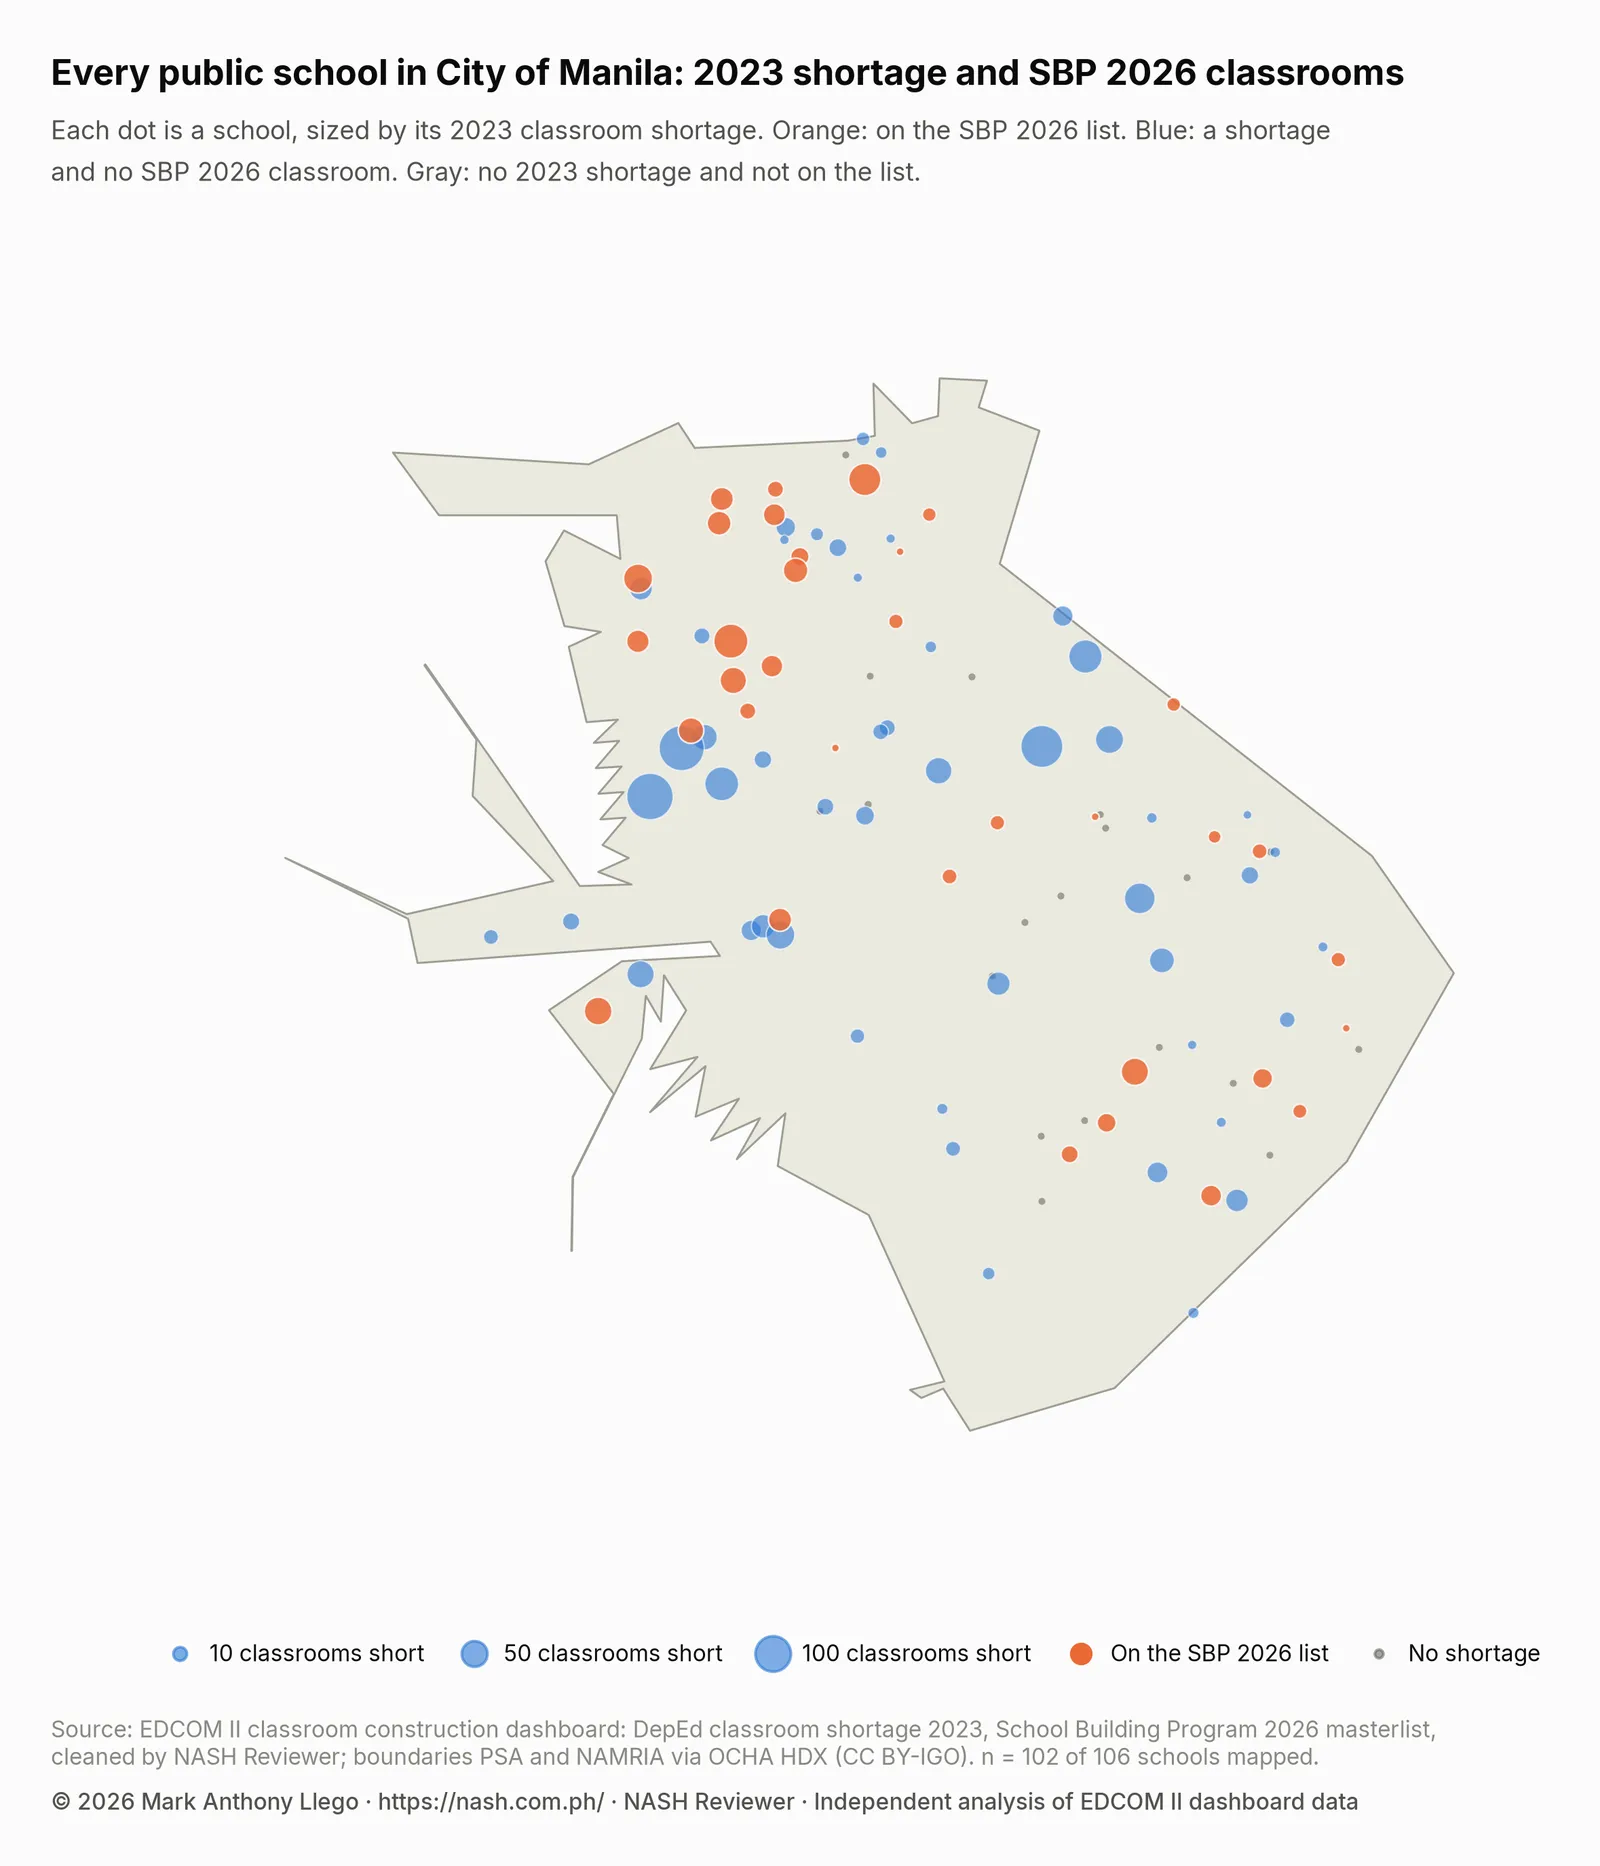
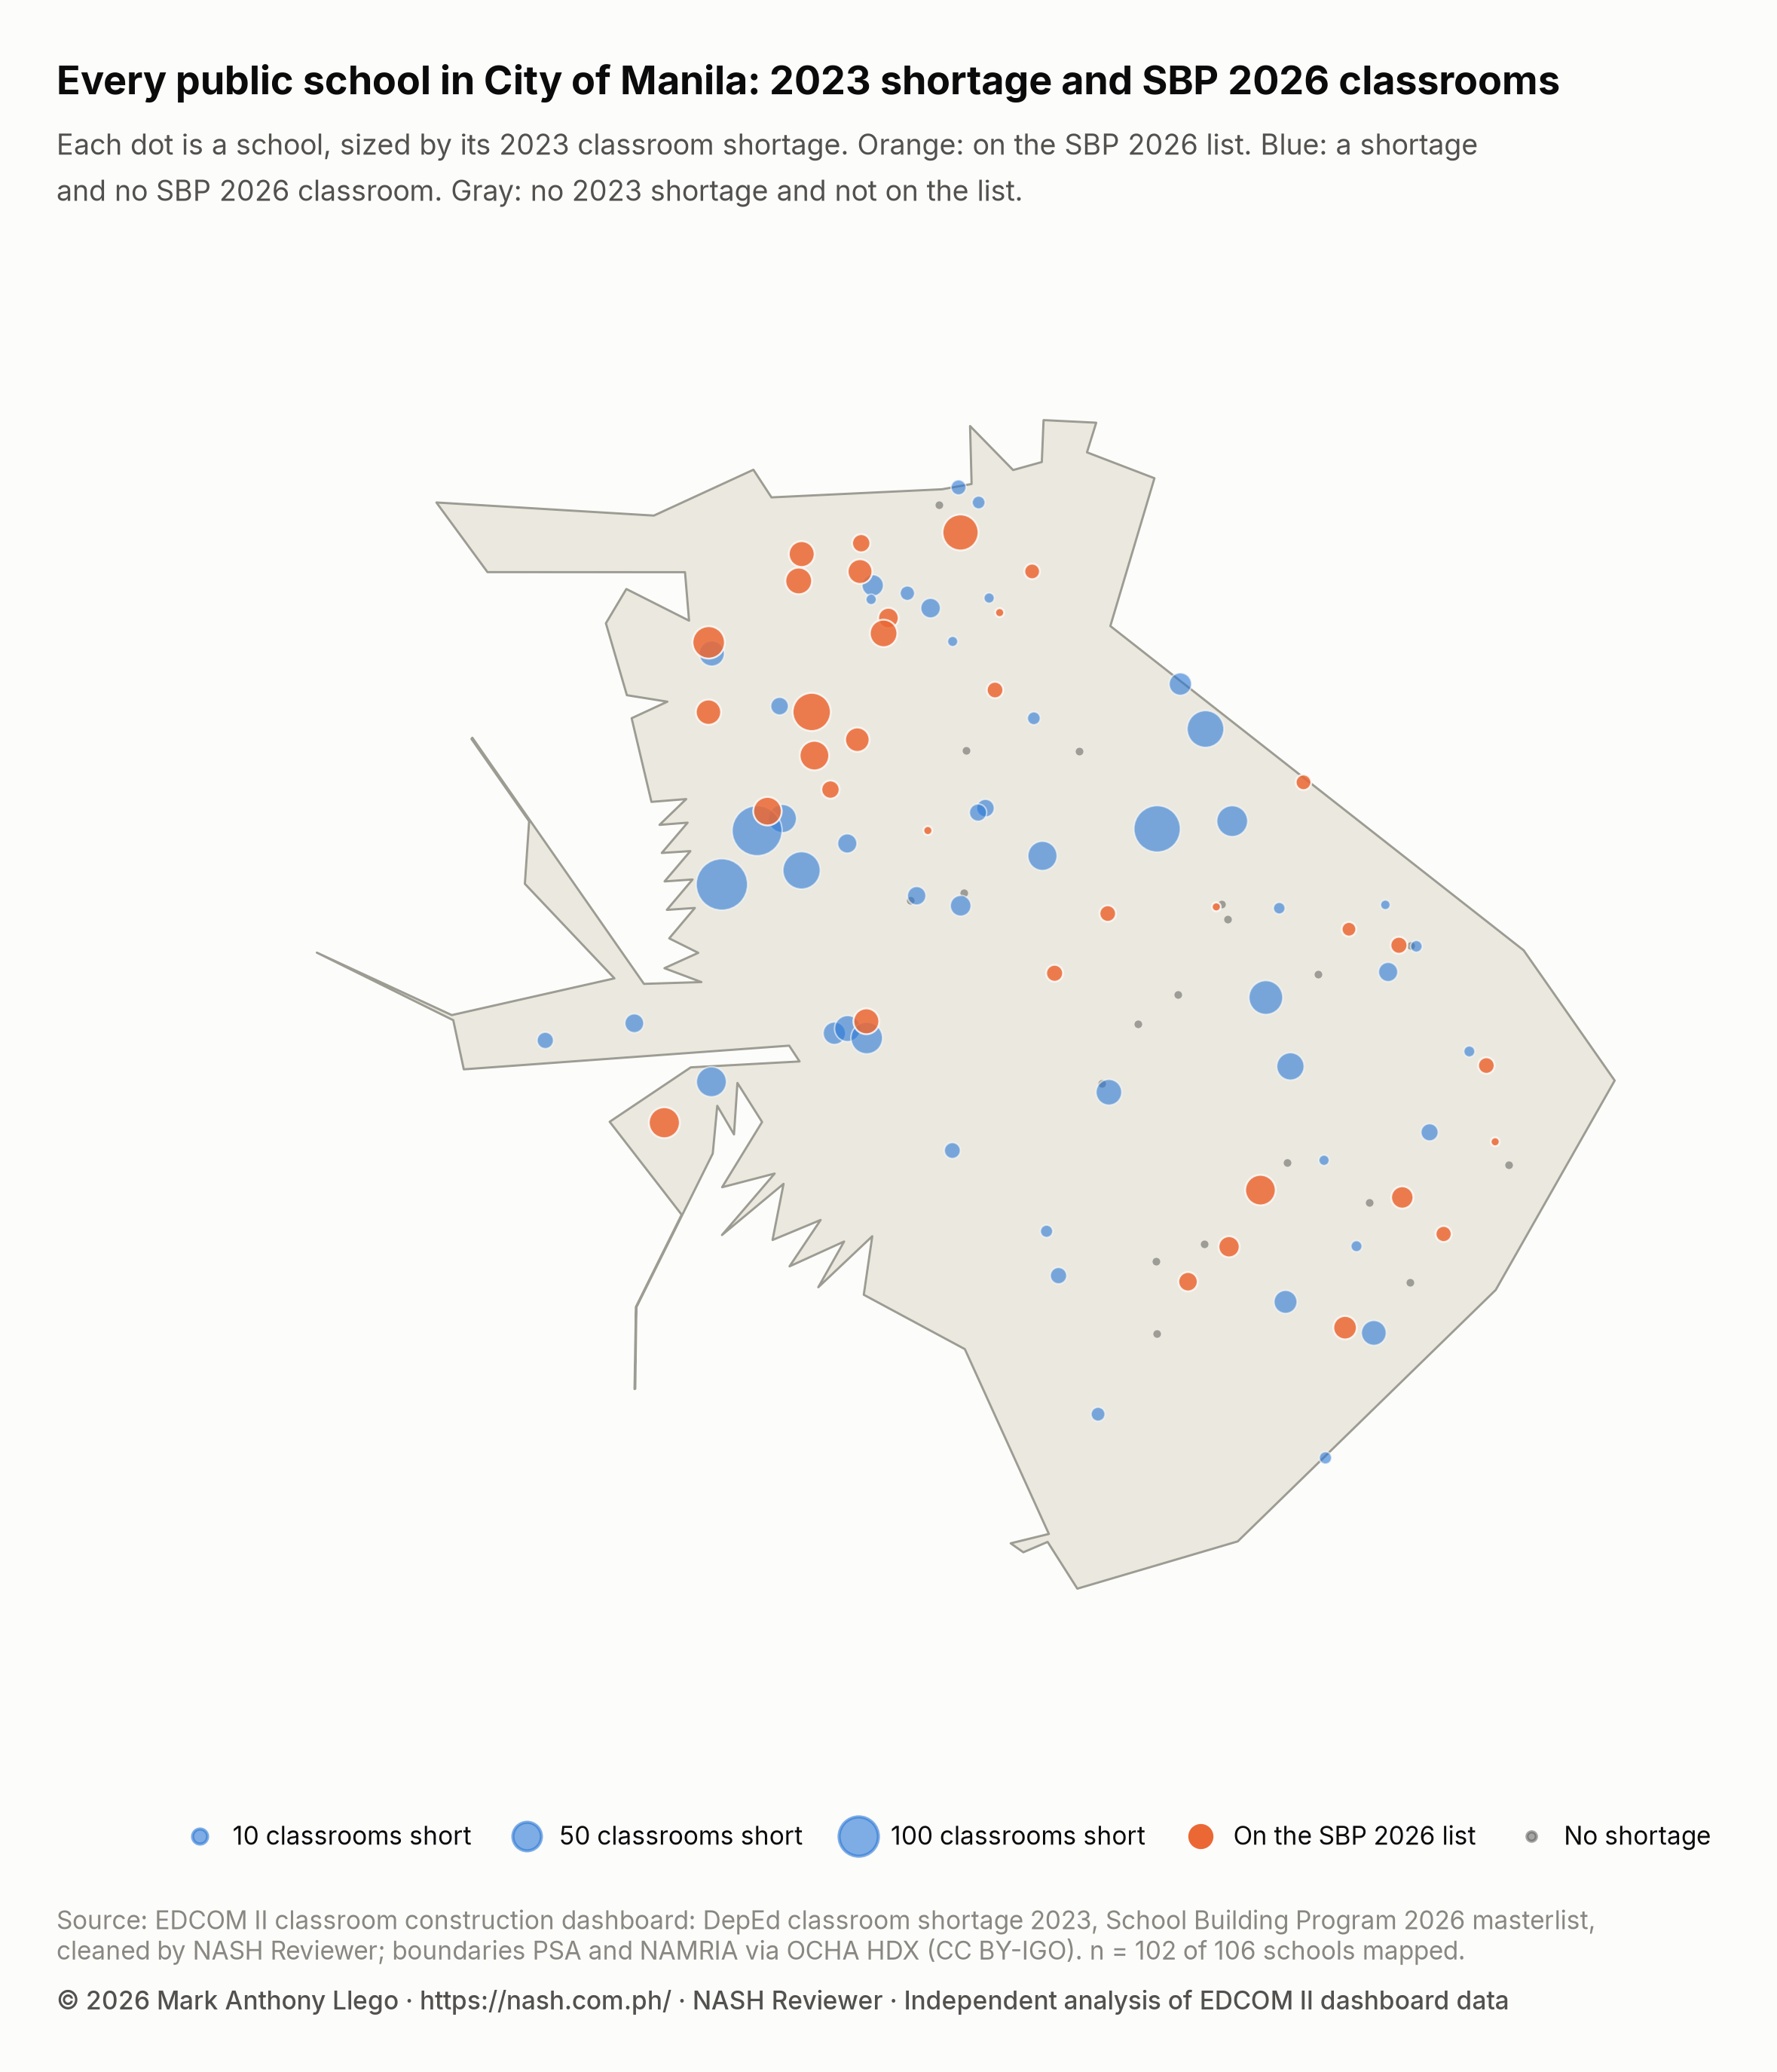
The map places 102 of the city’s 106 schools. Orange dots, the listed schools, are thickest in the north and west, in the 1st and 2nd Districts, with another group in the east and southeast. The biggest blue dots sit among them: R. Almario Elementary School and Tondo High School in the west, with no SBP classroom, and Ramon Magsaysay High School near the center. The dots sit at the 2022 coordinates of DepEd’s National School Building Inventory, which can be imprecise, and schools with no coordinates, or with coordinates more than 10 km from their barangay, are left off.
Does the 2026 list favor Manila’s largest shortages?
With a list this large, a natural question is whether it reaches the schools with the most need first. Two checks answer it, both within the city.
The first sorts the city’s 105 schools in the 2023 shortage table into four bands by shortage and gives the share in each band with any SBP 2026 classroom.
| 2023 classroom shortage | Schools | Schools with SBP 2026 classrooms | Share (95% interval) |
|---|---|---|---|
| None | 22 | 4 | 18.2% (7.3% to 38.5%) |
| 1 to 5 | 12 | 0 | 0.0% (0.0% to 24.2%) |
| Over 5 to 20 | 29 | 12 | 41.4% (25.5% to 59.3%) |
| Over 20 | 42 | 18 | 42.9% (29.1% to 57.8%) |
The share is highest for the larger shortages: 41.4% of schools short over 5 to 20 classrooms and 42.9% of those short more than 20 are listed, against none of the 12 schools short 1 to 5. Schools with no shortage sit in between, with 4 of 22 listed (18.2%). Each share comes with a 95% interval: the range of shares that fit the data, given how few schools are in each band. With 12 to 42 schools a band, the ranges are wide. None of 12 schools fits any share from 0.0% to 24.2%, and the two upper bands’ intervals, 25.5% to 59.3% and 29.1% to 57.8%, overlap almost entirely. Because these are all the city’s schools, not a sample, read an interval as a measure of how firmly a share rests on so few schools, not as survey error. They are Wilson score intervals (Wilson, 1927), which stay accurate for small groups and for shares near zero.
The second check sets the 30 listed schools with a shortage beside the 53 unlisted ones. The median listed school is short 30.2 classrooms, the median unlisted school 19.0. The Mann–Whitney test (Mann & Whitney, 1947) compares the two groups across every school, not only the middle one: it ranks all 83 schools by shortage and asks whether the listed schools sit higher in that ranking than chance alone would put them. Its effect size, the rank-biserial correlation (Kerby, 2014), pairs every listed school with every unlisted one and takes the share of pairs in which the listed school has the larger shortage, minus the share in which it has the smaller. It runs from 1, every listed school short more than every unlisted one, through 0, no tilt either way, to −1, the reverse.
In Manila the rank-biserial correlation is 0.20, a modest tilt toward the larger shortages. The p-value, 0.132, is the chance of a gap at least this large if being listed had nothing to do with a school’s shortage; at that level, chance could well explain it. In plain words, the listed schools do tend to have larger shortages, as the bands suggest, but with 83 schools the test cannot show clearly that the list favors them; nor does it show the reverse. Two facts pull in different directions: most listed schools are short more than 5 classrooms, yet the three largest shortages in the city are off the list.
This compares where classrooms are listed, not why. Quezon City Classroom Shortage: Districts and Schools makes the same comparison next door, where the listed and unlisted schools’ medians are almost the same.
Class shifts, crowding and school buildings in Manila
In SY 2024-25, 72 of the city’s 105 schools in the enrollment data (68.6%) held classes in two or more shifts, more than NCR’s 62.2% and far above the national 4.3%, and they enroll 81.6% of the city’s learners. Manila holds 72 of the 2,041 schools on shifts in the country. Shifts are most common in the 1st District, where 15 of 18 schools run them, and the 5th, with 14 of 16; in the 4th District, 7 of 19 do.
Rooms are less crowded than in Metro Manila as a whole. The median school has 41.2 learners per classroom in elementary, 39.9 in junior high and 36.3 in senior high, against 51.5, 52.8 and 40.4 in NCR, though well above the national 24.9, 32.1 and 30.6. 30 schools have more than 50 learners per classroom, with 39.3% of the learners counted, and bringing each down to 50 would take at least 408 classrooms. Learners per classroom count all of a school’s learners against its rooms, so in a school on shifts they describe the load over the day, not the size of one class. Class Shifts and Crowded Classrooms in DepEd Schools explains the measure.
The 2023 facilities data show more makeshift rooms than the region: 24 schools (22.9%) use them, against 11.5% across NCR. Another 17 schools report a building for condemnation or demolition, 25 buildings in all.
What this means for school heads in Manila
In Manila the question for many schools is less whether classrooms are coming than when, and whether they match the school’s own need.
- Find your school and its line. Look up your school ID in the school table for your 2023 shortage (
shortage_total), SBP 2026 classrooms (sbp_classrooms), shifts (multi_shift) and district (congressional_district), then filter the SBP lines file by the same ID for each line’s modality and scope. The EDCOM II classroom data page links every file. - Plan on the PSIP III timeline. With 95.9% of the city’s 2026 classrooms in PSIP III, still for bidding and expected to be built from March 2027 to July 2028, plan the school’s rooms and shifts for the years before the buildings are ready, and track the line in the annual implementation plan.
- Write down what new rooms will do. If your school is listed for more than its 2023 shortage, record in the school improvement plan what each new room replaces or relieves: a makeshift room, a second shift, a building for condemnation. If it has a large shortage and no line, document current enrollment, shifts and rooms with dates.
- Compare within your district. Coverage runs from 42.6% in the 3rd District to 138.4% in the 2nd, so a school’s case depends on where it stands; bring school and district figures to the division and the local school board.
- Check the record before you cite it. A large shortage beside modest crowding, as at R. Almario Elementary School, or a learners-per-classroom figure such as 242.1, may be worth confirming with the division before the data are used for planning.
How these numbers were made
The data are the cleaned tables behind the EDCOM II classroom construction dashboard: DepEd’s 2023 classroom shortage by school, the SBP 2026 masterlist, SY 2024-25 enrollment and class shifts from the Basic Education Information System (BEIS), 2023 school facilities, and school coordinates from the National School Building Inventory (NSBI) for SY 2022-23. How the EDCOM Classroom Data Was Cleaned documents every table and cleaning rule.
The place is the Manila schools division: 105 schools in the 2023 shortage table, 106 in all. Its parts are the congressional districts as DepEd’s 2023 shortage table labels them; labels that differ only in capitalization are merged, as in the congressional district ranking, and every school in the table carries one of six labels.
A school’s shortage is DepEd’s 2023 figure for Kindergarten to Grade 10 plus senior high school, counted only where the school lacks classrooms. The shortage per 1,000 learners divides the shortage of schools with SY 2024-25 learners by those learners and multiplies by 1,000. Divisions are ranked by shortage among all 229, and by rate among the 209 with 20,000 learners or more. Coverage is SBP 2026 classrooms divided by the 2023 shortage. Classrooms within a school’s shortage are counted up to the size of that shortage; any beyond it are counted as beyond. Learners per classroom divide SY 2024-25 learners by 2023 instructional classrooms; for a school above 50, the classrooms needed are its learners divided by 50, rounded up, minus the classrooms it has.
- Wilson intervals. For k listed schools out of n, the interval holds every share p for which k/n lies within about two standard errors of p, with the standard error computed from p itself; this keeps it inside 0% to 100% and accurate for small n (Wilson, 1927).
- Mann–Whitney test. Among schools with a 2023 shortage, the shortages of listed and unlisted schools are compared with a two-sided Mann–Whitney U test (Mann & Whitney, 1947). The rank-biserial correlation is 2U/(n₁n₂) − 1, where U counts the listed–unlisted pairs in which the listed school has the larger shortage, ties counting half (Kerby, 2014).
- Duplicates. A line that is an exact copy of an earlier line is flagged and kept; totals without such lines are given beside the full ones.
- Map. Each school is drawn at its 2022 coordinates; schools with no coordinates, with coordinates outside the map’s frame, or flagged as more than 10 km from their barangay’s center are left off.
The analysis was done in Python with pandas and SciPy, and the charts and map drawn with Matplotlib and geopandas.
Limits
The sources span several years: the shortage and facilities are from 2023, enrollment and shifts from SY 2024-25, coordinates from 2022, and the allocations from 2026, so a school’s figures may have changed since. The SBP list shows planned classrooms, not finished ones, and 1,813 of the city’s are PSIP III classrooms still for bidding, with no budget yet. The shortage is DepEd’s own estimate, and new, merged or renumbered schools may be missing or counted under a new ID. The figures are the Manila division’s, which differ slightly from the PSGC city’s.
District labels follow DepEd’s 2023 data; districts created or redrawn since may differ. Learners per classroom count all of a school’s learners against its rooms, so in a school on shifts they describe the load over the day. With 83 schools with a shortage, the Mann–Whitney test can miss a modest tilt, and the band shares rest on few schools. The map’s coordinates can be imprecise. These are descriptive figures: they show where the shortage and the 2026 classrooms are, not why.
Frequently asked questions
How many SBP 2026 classrooms will the City of Manila get?
The SBP 2026 masterlist has 1,890 classrooms for the City of Manila on 43 lines at 35 schools, the most of any city or municipality in the country and 68.2% of the division’s 2023 shortage of 2,773. Of these, 1,813 are PSIP III classrooms still for bidding and 77 are DPWH classrooms funded under the GAA 2026 with PHP 0.49 billion. The list is a plan; it does not mean the classrooms are built.
What is PSIP III, and when will Manila’s classrooms be built?
PSIP III is the third Public-Private Partnership for School Infrastructure Project. On the SBP 2026 masterlist its lines are still for bidding and carry no budget, with construction expected from March 2027 to July 2028. EDCOM II has reported that PSIP III targets over 16,000 classrooms using an “availability payment” model (EDCOM II, 2026, February 9).
Which Manila district has the biggest classroom shortage?
The 1st District, short 1,022 classrooms, 36.9% of the city’s shortage, at 16.4 classrooms per 1,000 learners; every one of its 18 schools has a shortage. It receives 638 SBP 2026 classrooms, 62.4% of its shortage.
Which school in Manila has the largest classroom shortage?
R. Almario Elementary School in the 1st District, short 175 classrooms in DepEd’s 2023 data, followed by Tondo High School (165) and Ramon Magsaysay High School (142). None of the three is on the SBP 2026 list.
Download the data and cite this post
The cleaned EDCOM II classroom data behind this series are free to download for personal study; to reuse them, email support@nash.com.ph for written permission first. How the EDCOM Classroom Data Was Cleaned explains every table and cleaning rule. The files are at data.nash.com.ph: start with the README, then the school table (Parquet, or CSV), the School Building Program lines (CSV), the city and municipality table (CSV), and every table for Stata and SPSS. Every figure on Manila in this post can be computed from the school table, filtered to the Manila division by division and split by congressional_district, with the SBP lines file, matched on school_id, for the modalities and duplicates.
Every file, with its rows, columns and checksum, is listed on the EDCOM II classroom data page. To cite the data: Llego, M. A. (2026). EDCOM II classroom construction dashboard data, cleaned, version 1.1. NASH Reviewer. https://nash.com.ph/edcom-classroom-data
To cite this post: Llego, M. A. (2026, October 28). Manila classroom shortage: Districts, schools and PSIP III. NASH Reviewer Blog. https://nash.com.ph/blog/classroom-shortage-manila
References
- Kerby, D. S. (2014). The simple difference formula: An approach to teaching nonparametric correlation. Comprehensive Psychology, 3.
- Llego, M. A. (2026). EDCOM II classroom construction dashboard data, cleaned, version 1.1 [Data set]. NASH Reviewer. https://nash.com.ph/edcom-classroom-data
- Mann, H. B., & Whitney, D. R. (1947). On a test of whether one of two random variables is stochastically larger than the other. Annals of Mathematical Statistics, 18(1), 50–60.
- Second Congressional Commission on Education (EDCOM II). (2026). National Education Plan 2026–2035 (Year Three report).
- Second Congressional Commission on Education (EDCOM II). (2026, February 9). EDCOM II: 51,000 classrooms likely to be condemned by 2028 [News release].
- Wilson, E. B. (1927). Probable inference, the law of succession, and statistical inference. Journal of the American Statistical Association, 22(158), 209–212.
More in this series
- How the EDCOM Classroom Data Was Cleaned
- Philippine Classroom Shortage 2023: Where the Gap Is
- DepEd School Building Program 2026 in Numbers
- Do 2026 Classrooms Go Where the Shortage Is?
- Classroom Allocation by LGU Income Class, 2026
- Class Shifts and Crowded Classrooms in DepEd Schools
- Last Mile Schools: Classroom Need and 2026 Allocation
- Regional reports: NCR, CAR, Region I, Region II, Region III, Region IV-A, MIMAROPA, Region V, Region VI, NIR, Region VII, Region VIII, Region IX, Region X, Region XI, Region XII, Caraga, BARMM
- Rankings and deep dives: Congressional districts, Top 20 cities and municipalities, Rizal, Quezon City, City of Manila, Tawi-Tawi, Cavite, Cost of a classroom
- Explainers: PSIP III, Senior high shortage, Junior high shortage, Excess classrooms, Learning Continuity Spaces, How learners reach school
- For teachers and school heads: Action research and thesis topics
- Related: Quezon City Classroom Shortage: Districts and Schools, The 20 cities and municipalities with the largest classroom shortages, CRLA Results SY 2025-26 in NCR: Low Shares, Large Schools, DepEd Classroom and School Building Data, SY 2023-2024, DepEd School Improvement Plan (SIP): Steps, AIP and SRC, How to Read DepEd Data: A Guide for Aspiring School Heads
Analysis and charts by Mark Anthony Llego for NASH Reviewer. Data: EDCOM II classroom construction dashboard and Department of Education data. NASH Reviewer is not affiliated with EDCOM II or DepEd. Charts may be reused only with written permission from support@nash.com.ph.