DepEd’s School Building Program (SBP) 2026 masterlist, as published in the EDCOM II classroom construction dashboard, lists 32,419 classrooms on 5,652 lines at 5,231 public schools. Half of them have no budget yet. The 16,114 classrooms funded under the General Appropriations Act (GAA) 2026 (49.7%) carry PHP 55.47 billion. The other 16,305 (50.3%) belong to PSIP III, the third Public-Private Partnership for School Infrastructure Project, still for bidding, with construction expected from March 2027 to July 2028. The whole list equals 19.6% of DepEd’s 2023 classroom shortage of 165,443 classrooms, and the funded classrooms alone 9.7%.
In new buildings, the median budget per classroom is PHP 3.25 million when the Department of Public Works and Highways (DPWH) builds, PHP 3.00 million when local government units (LGUs) build and PHP 5.57 million on DepEd’s own Last Mile School lines. By region, Region I’s list exceeds its 2023 shortage, while BARMM holds 0.6% of the classrooms against 6.7% of the shortage.
The figures come from the cleaned masterlist (How the EDCOM Classroom Data Was Cleaned) and are for teachers, school heads and aspiring school heads who cite the program in a school improvement plan, a thesis or action research. They are allocations, not finished buildings; school-by-school targeting is the subject of Do 2026 Classrooms Go Where the Shortage Is?
Key findings
- The SBP 2026 masterlist holds 32,419 classrooms at 5,231 schools, equal to 19.6% of DepEd’s 2023 classroom shortage.
- Half of the classrooms (16,305, or 50.3%) are PSIP III classrooms still for bidding; the 16,114 funded under GAA 2026 carry PHP 55.47 billion and equal 9.7% of the shortage on their own.
- DPWH implements 6,142 classrooms (18.9% of the list), provinces, cities and municipalities 8,665 (26.7%), and DepEd’s own modalities 1,307 (4.0%).
- The median budget per classroom in new buildings is PHP 3.25 million for DPWH lines, PHP 3.00 million for LGU lines and PHP 5.57 million for DepEd lines, a clear difference (Kruskal-Wallis H = 384.5, p < 0.001, eta-squared 0.11).
- Region I’s list holds more classrooms than its 2023 shortage (coverage 101.2%), while BARMM’s 197 SBP classrooms are 0.6% of the list against 6.7% of the national shortage.
- 103 PSIP III lines are exact copies of earlier lines, carrying 1,554 classrooms; without them the list totals 30,865 classrooms.
SBP 2026 classrooms by implementing modality
Each masterlist line names a school, a scope of work, a number of classrooms and an implementing modality: who will build them. The seven modalities fall into four groups, shown by color in Figure 1.
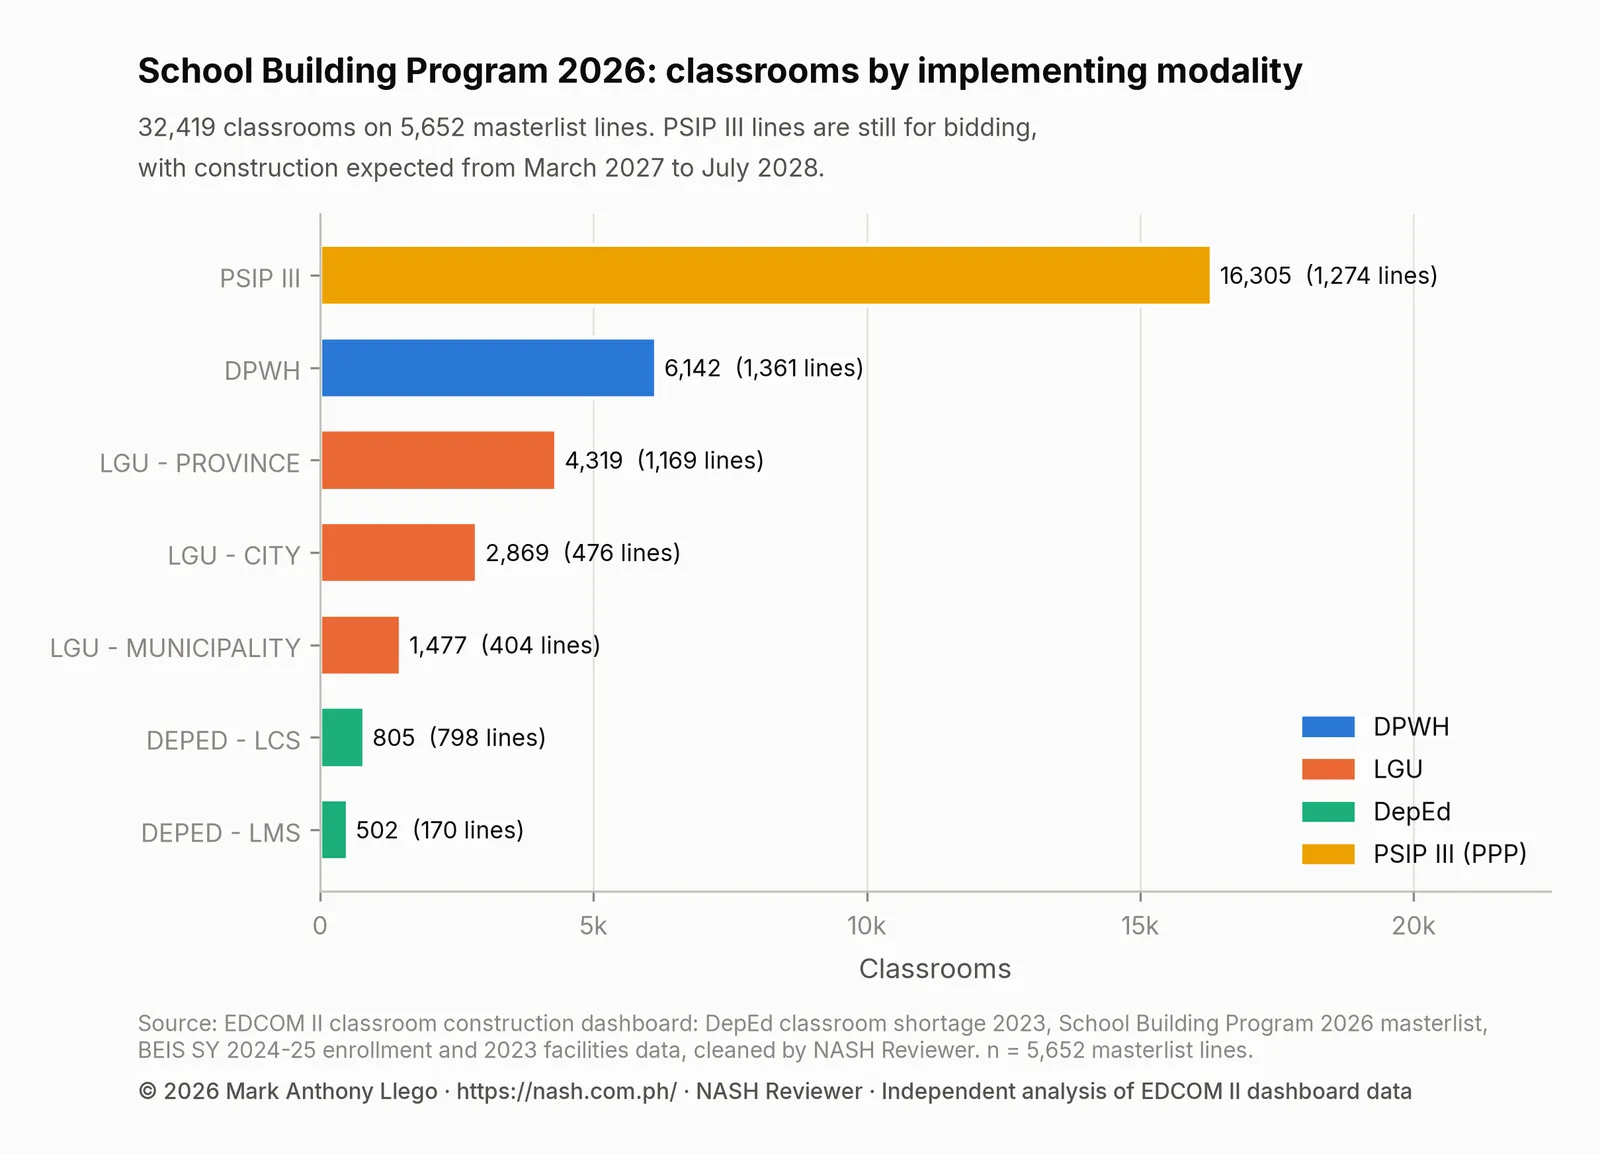
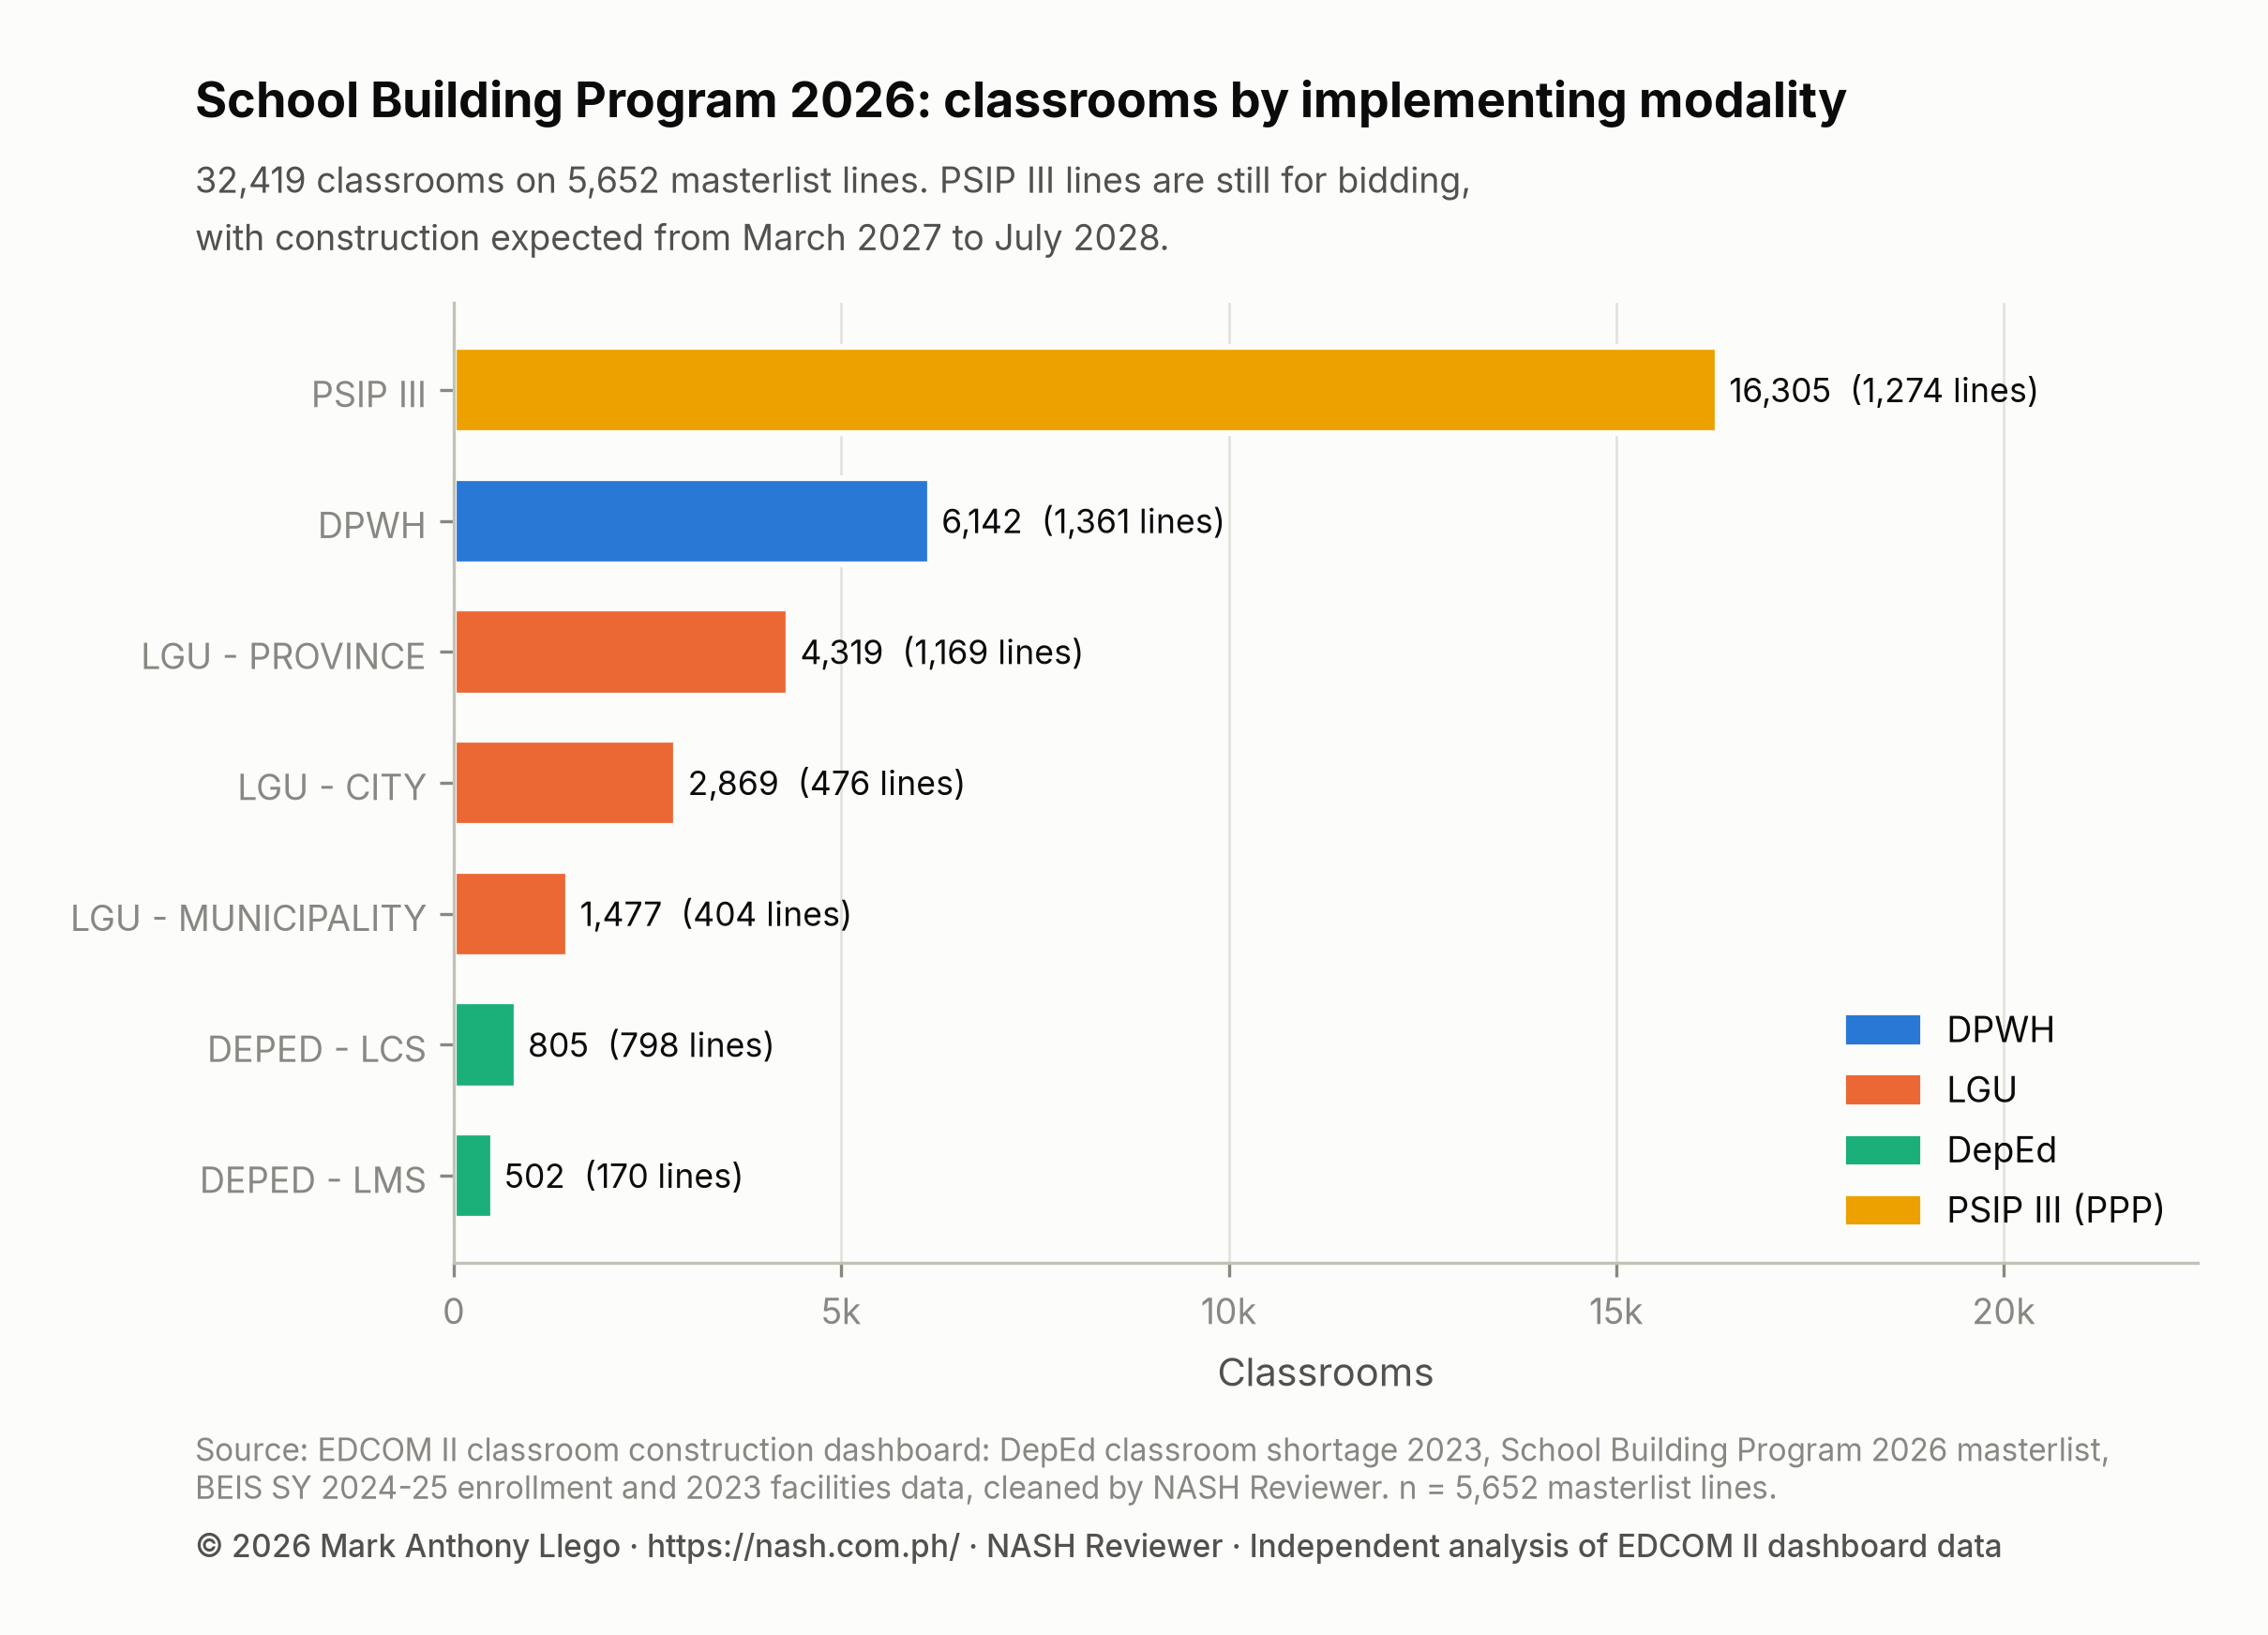
PSIP III alone holds more classrooms than DPWH and the three LGU modalities together, and DepEd’s own modalities are the smallest. What each modality means for a school:
- DPWH. The Department of Public Works and Highways builds the classrooms: 1,361 lines with PHP 20.90 billion, the largest funded share.
- LGU - PROVINCE, LGU - CITY and LGU - MUNICIPALITY. The provincial, city or municipal government implements the project: 2,049 lines together. Classroom Allocation by LGU Income Class, 2026 shows which LGUs receive them.
- DEPED - LCS. Learning Continuity Spaces are prefabricated rooms, usually one per line: 805 classrooms at 797 schools.
- DEPED - LMS. New buildings at Last Mile Schools, which EDCOM II’s National Education Plan places in Geographically Isolated and Disadvantaged and Conflict-Affected Areas (GIDCAs) and hardship posts: 502 classrooms at 169 schools. Last Mile Schools: Classroom Need and 2026 Allocation compares these schools with the rest.
- PSIP III. A public-private partnership. EDCOM II reported in February 2026 that PSIP III targets over 16,000 classrooms using an “availability payment” model, consistent with the 16,305 here: as the term is generally used, the private partner finances and builds, and the government pays in installments once the classrooms are available for use. Its budget column reads “N/A (For Bidding)”.
| Implementation modality | Lines | Schools | Classrooms | Share of classrooms | Median classrooms per line | Budget allocated |
|---|---|---|---|---|---|---|
| PSIP III | 1,274 | 1,094 | 16,305 | 50.3% | 10.0 | For bidding |
| DPWH | 1,361 | 1,361 | 6,142 | 18.9% | 4.0 | PHP 20.90 billion |
| LGU - PROVINCE | 1,169 | 1,169 | 4,319 | 13.3% | 3.0 | PHP 14.38 billion |
| LGU - CITY | 476 | 476 | 2,869 | 8.8% | 4.0 | PHP 10.36 billion |
| LGU - MUNICIPALITY | 404 | 404 | 1,477 | 4.6% | 3.0 | PHP 4.66 billion |
| DEPED - LCS | 798 | 797 | 805 | 2.5% | 1.0 | PHP 2.17 billion |
| DEPED - LMS | 170 | 169 | 502 | 1.5% | 3.0 | PHP 2.98 billion |
PSIP III lines are larger, with a median of 10.0 classrooms per line, and a school can have several: the 1,274 lines fall at 1,094 schools. The largest line, 160 classrooms at F.G Calderon Integrated School in the City of Manila, is a PSIP III line. Before quoting totals, note that 103 PSIP III lines are exact copies of an earlier line, carrying 1,554 classrooms. They are kept, as in the dashboard; without them the list holds 30,865 classrooms.
What the lines build: scope of work and building heights
Classified by its scope-of-work text, nearly every line is a new classroom building: 4,834 lines with 31,413 classrooms. Another 798 lines (805 classrooms) install Learning Continuity Spaces, 18 lines (201 classrooms) complete buildings already started, and two lines are other works with no classrooms.
DPWH, LGU and PSIP III lines describe a building with a code: 2STY4CL means two stories and four classrooms. DepEd’s Last Mile School lines spell the work out, typically a building with a common toilet and the provision of a rainwater collector, school furniture and a solar PV energy system. Of the 4,692 new-building lines that give a height, the median building has two stories; 44.2% have one story and 20.6% have four or more. Most of the tall buildings are PSIP III lines, up to 13 stories in the City of Manila.
Budget per classroom in new classroom buildings
Budget per classroom is a line’s allocated budget divided by its classrooms, computed for new classroom buildings only. PSIP III lines have no budget yet, so the comparison covers 3,559 lines implemented by DPWH, LGUs and DepEd; DepEd’s lines in it are all Last Mile School lines. Across them, the median is PHP 3.03 million per classroom, and the middle half falls between PHP 3.00 million and PHP 3.67 million.
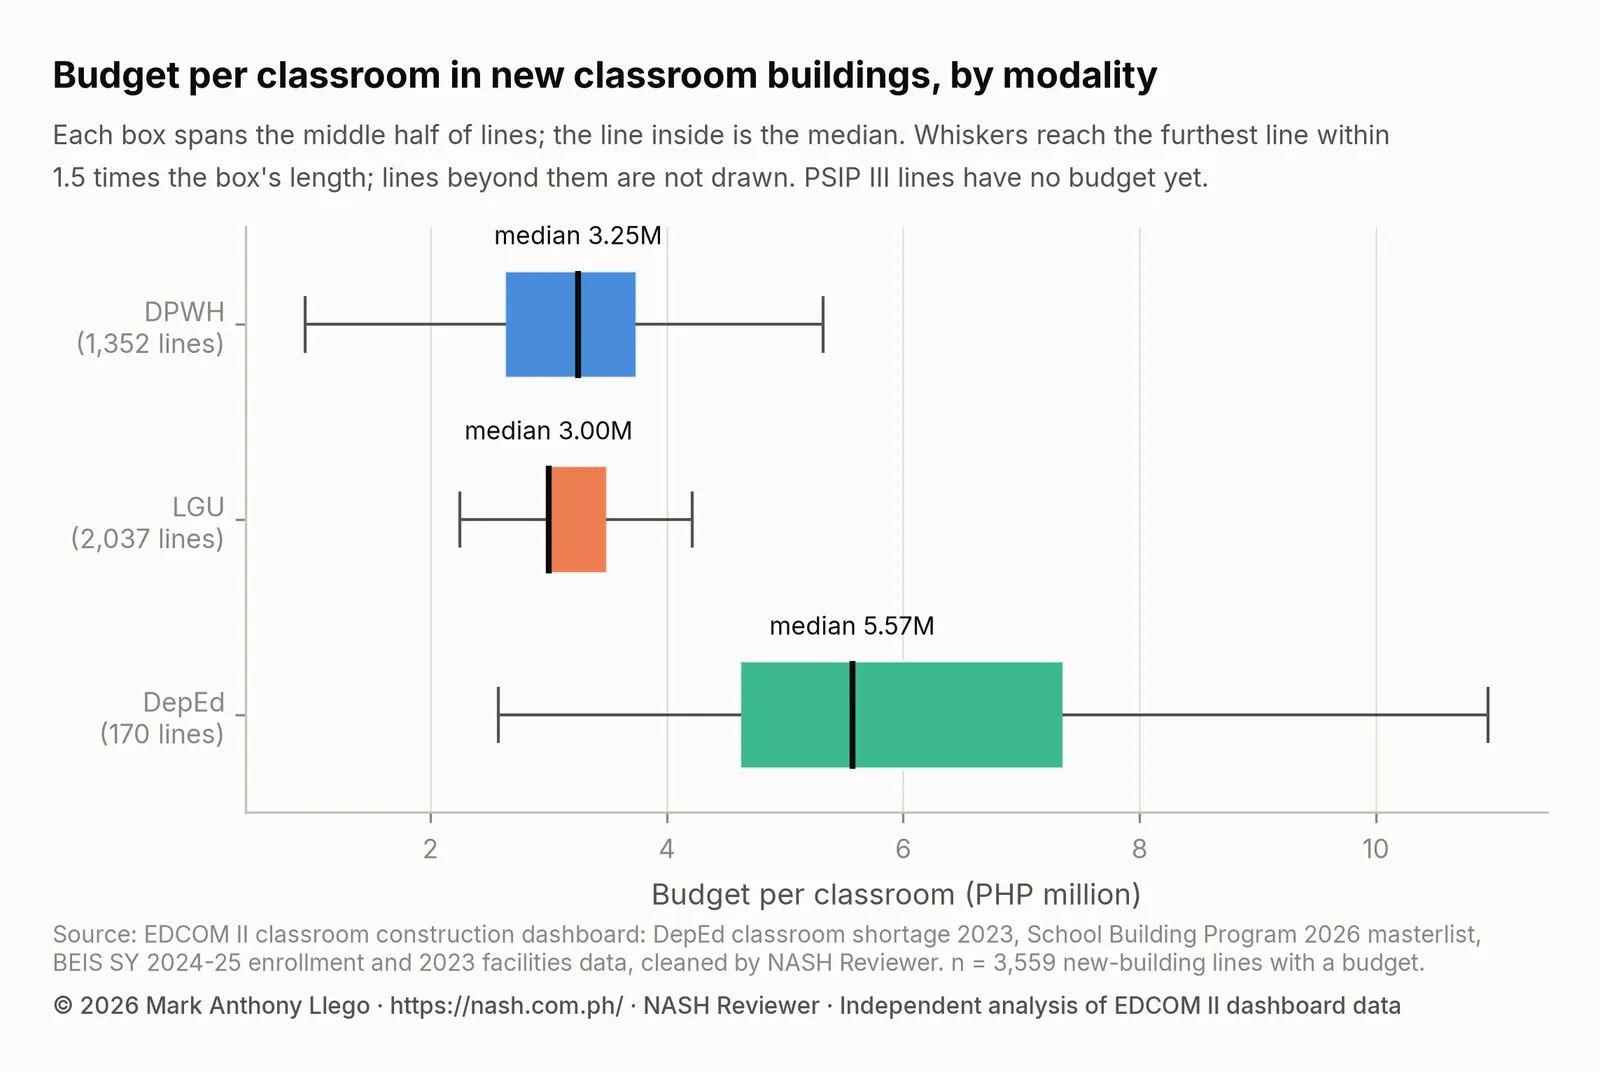
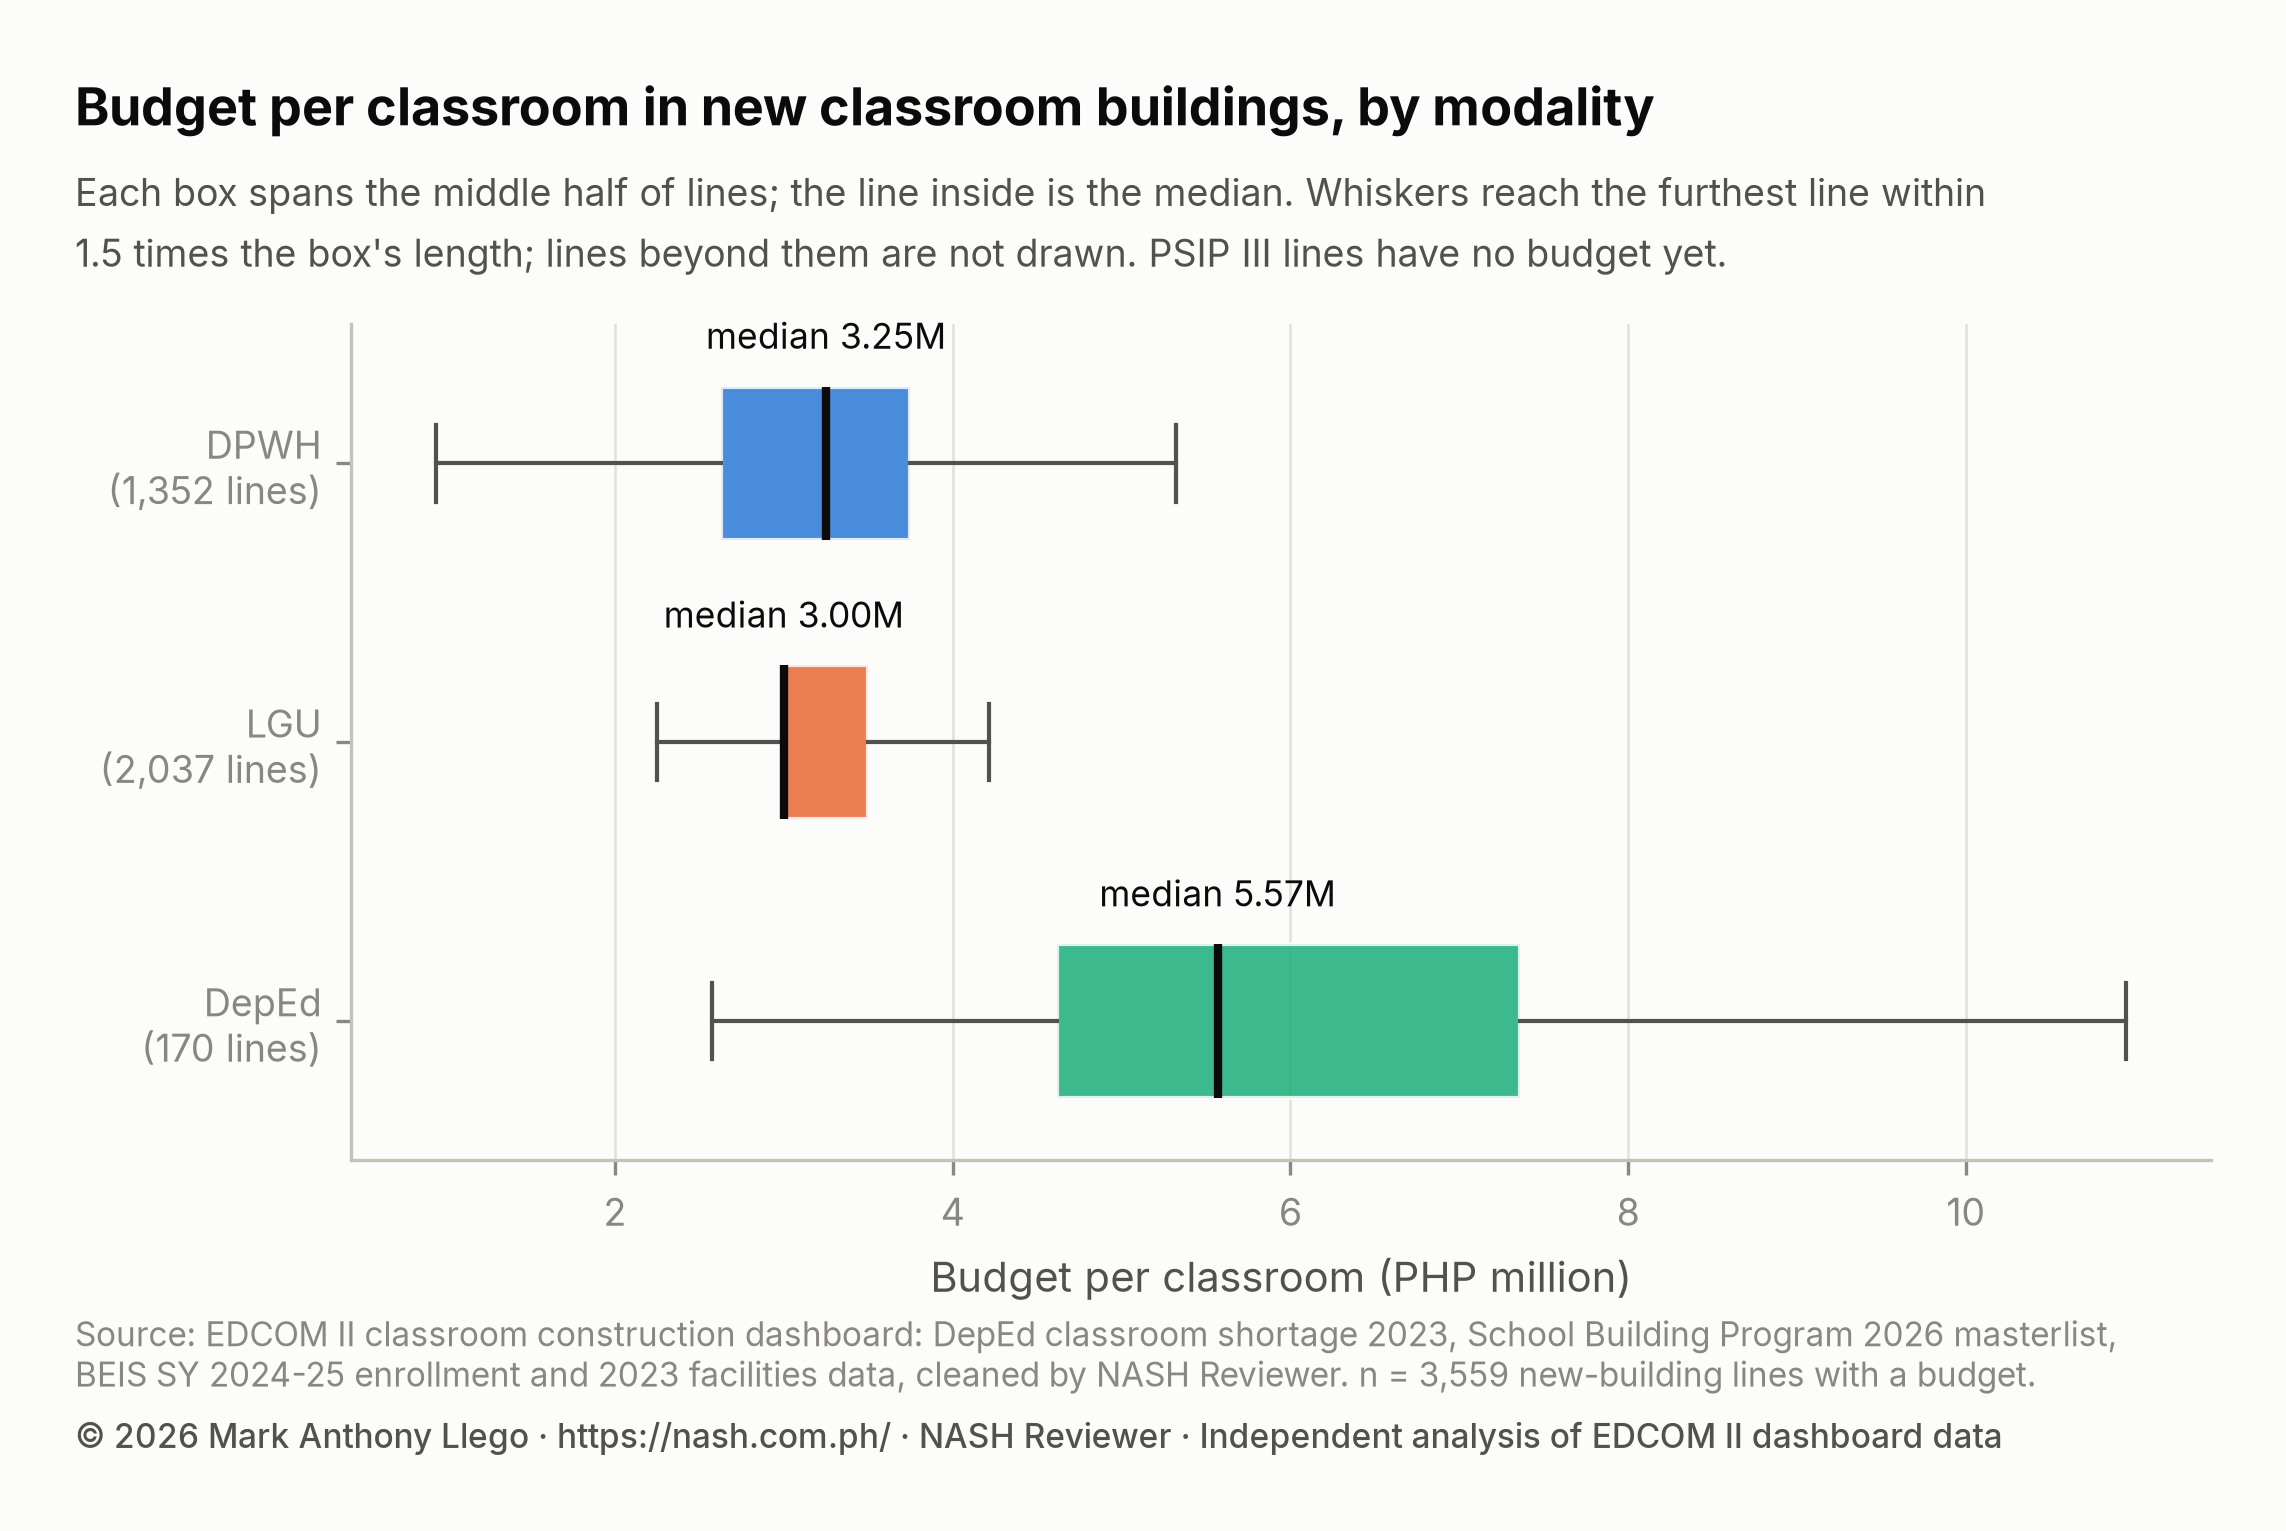
DepEd’s middle half, PHP 4.62 million to PHP 7.36 million, lies wholly above the other two groups. The LGU box is the narrowest, and its median equals its lower quartile, PHP 3.00 million: a large block of LGU lines is allocated exactly that amount per classroom, which looks like a standard rate rather than a costed design. DPWH lines spread wider.
| Modality group | Lines with a budget | Median budget per classroom | Middle half (interquartile range) |
|---|---|---|---|
| DPWH | 1,352 | PHP 3.25 million | PHP 2.63 million to PHP 3.75 million |
| LGU | 2,037 | PHP 3.00 million | PHP 3.00 million to PHP 3.50 million |
| DepEd | 170 | PHP 5.57 million | PHP 4.62 million to PHP 7.36 million |
Budgets per classroom are skewed: most lines sit near the middle, but a few run far higher. An average would be pulled up by those few, and tests built on averages assume a bell-shaped spread these budgets do not have. A rank test avoids both problems. It lines up all 3,559 lines from the lowest budget per classroom to the highest and asks whether one group’s lines sit higher in that order than chance would allow. A very expensive line simply takes the top rank, so it cannot drive the result.
The Kruskal-Wallis test (Kruskal & Wallis, 1952) does this for three or more groups and finds a clear difference: H = 384.5 with 2 degrees of freedom, p < 0.001. The effect size, the H-based eta-squared, is 0.11: about a tenth of the variation in the lines’ ranks goes with their modality group (Tomczak & Tomczak, 2014). Dunn’s test (Dunn, 1964) then compares each pair, with p-values adjusted by Holm’s method (Holm, 1979) for making three comparisons at once. All three pairs differ: DPWH lines rank above LGU lines (z = 4.27), and DepEd lines rank above DPWH lines (z = -17.38) and LGU lines (z = -19.59), each with p < 0.001. The DPWH-LGU gap is small in pesos; the gap to DepEd is large.
The masterlist cannot say why DepEd’s lines cost more, but their scope texts show what the budgets are meant to cover. Most DepEd Last Mile School lines list, besides the building, a common toilet, school furniture, a solar power system and a water system or rainwater collector, at schools that are by definition remote or conflict-affected. Most DPWH and LGU lines give only a building code, so what else their budgets include is not recorded, and the gap is not a measure of efficiency. On 25 Last Mile School lines, the scope text names more classrooms than the count used here; counting them by the text lowers their budget per classroom but still leaves DepEd’s median well above the others.
Taller buildings cost slightly more per classroom. Across the 3,418 lines with a known height, Spearman’s rank correlation (Spearman, 1904) between stories and budget per classroom is 0.23, a weak positive association; the median is PHP 3.00 million for one-story buildings and PHP 3.50 million for two stories. All of these figures are allocations, not contract prices; the final cost is set at bidding and award.
SBP 2026 classrooms against each region’s 2023 shortage
Coverage is a region’s SBP 2026 classrooms divided by its 2023 classroom shortage: 19.6% nationally, or 9.7% counting only funded classrooms. Figure 3 sets each region’s share of the SBP classrooms beside its share of the shortage; if the program followed the shortage, the two would match. Sulu’s schools division moved from MBHTE-BARMM to DepEd Region IX on 20 October 2026, so its schools are counted in Region IX here.
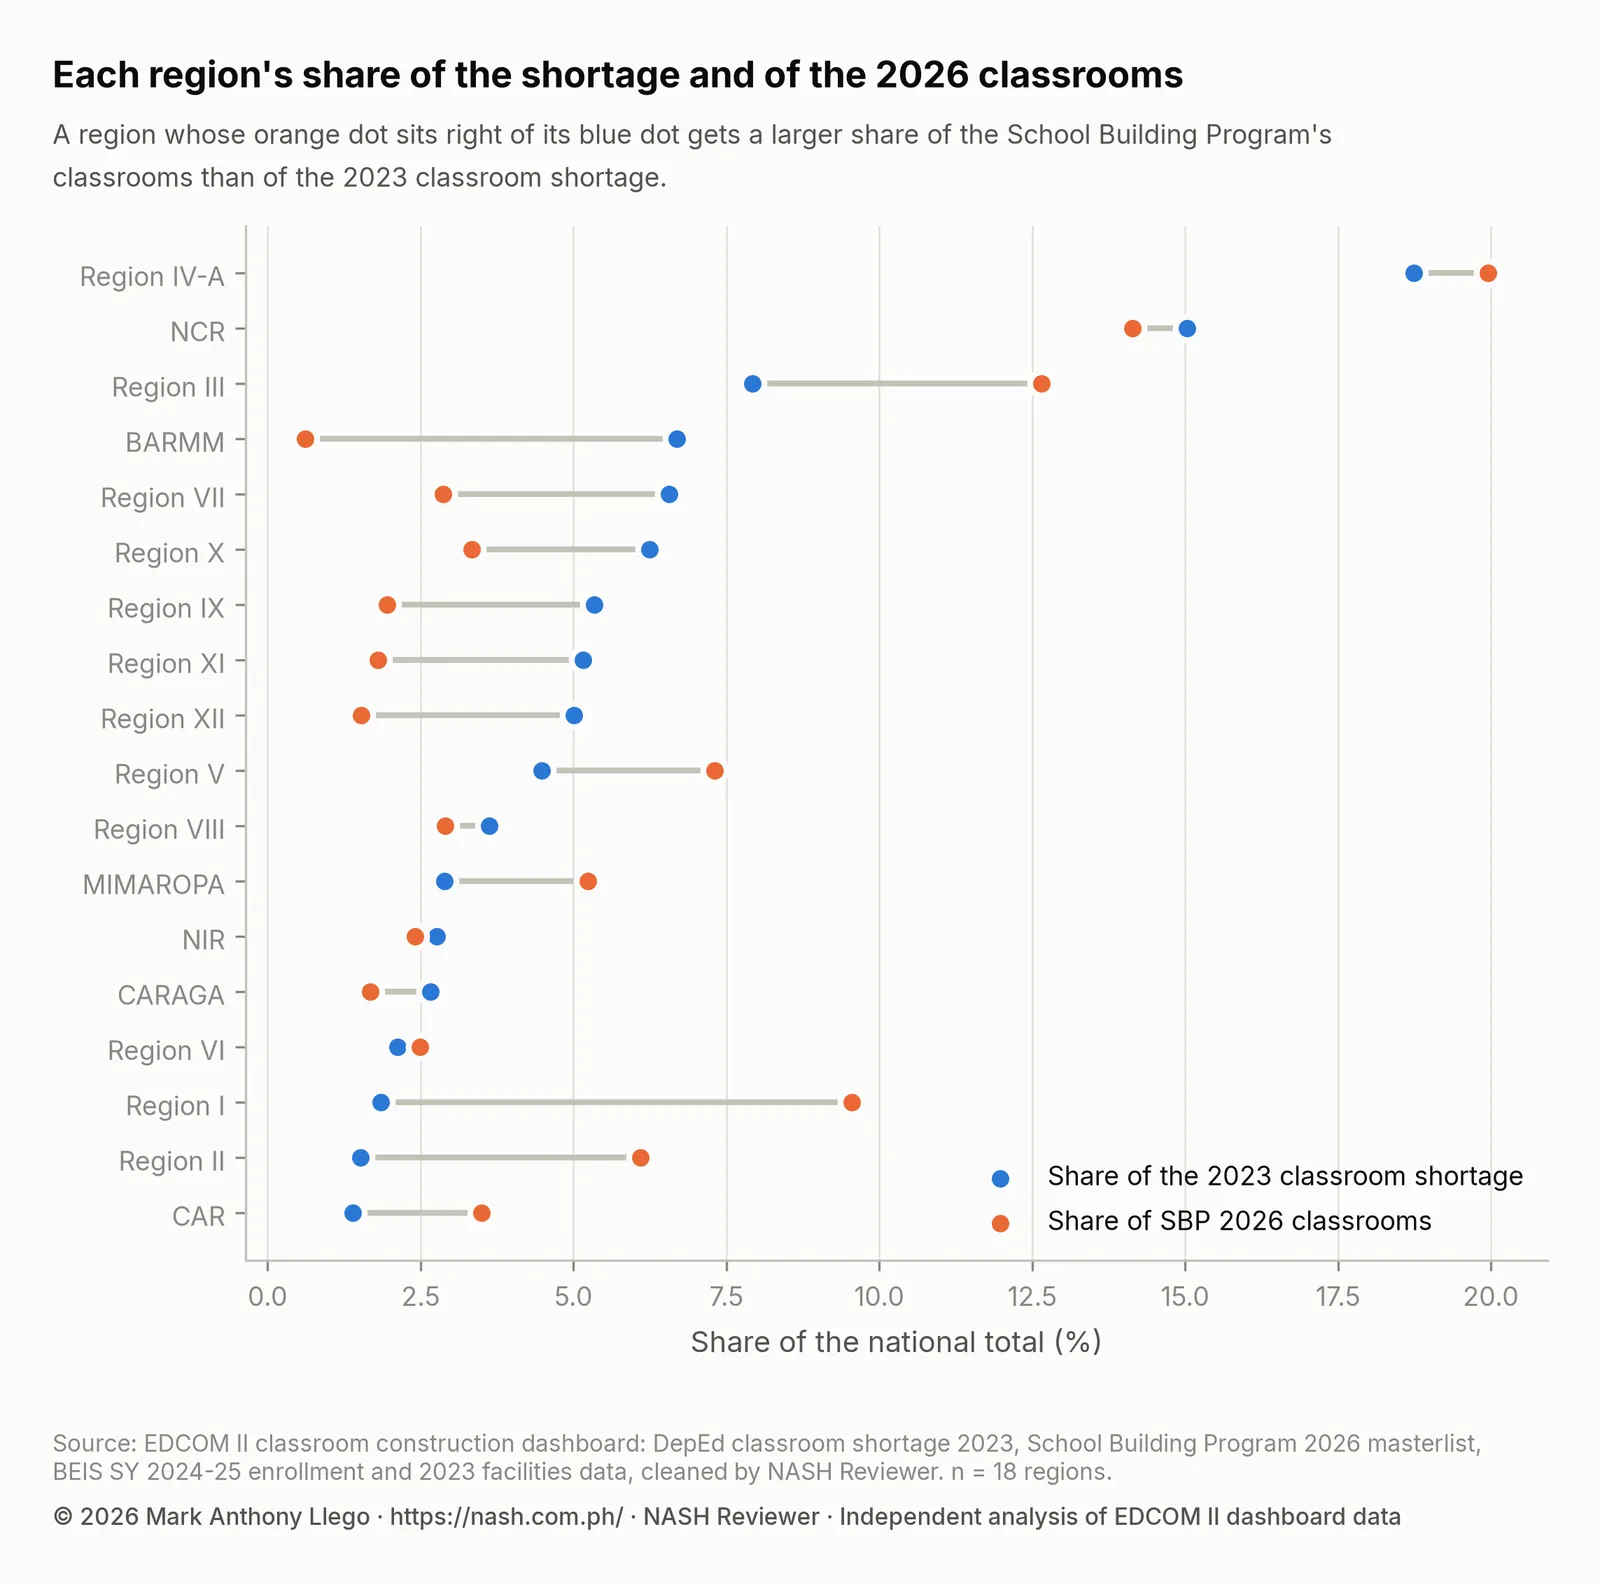
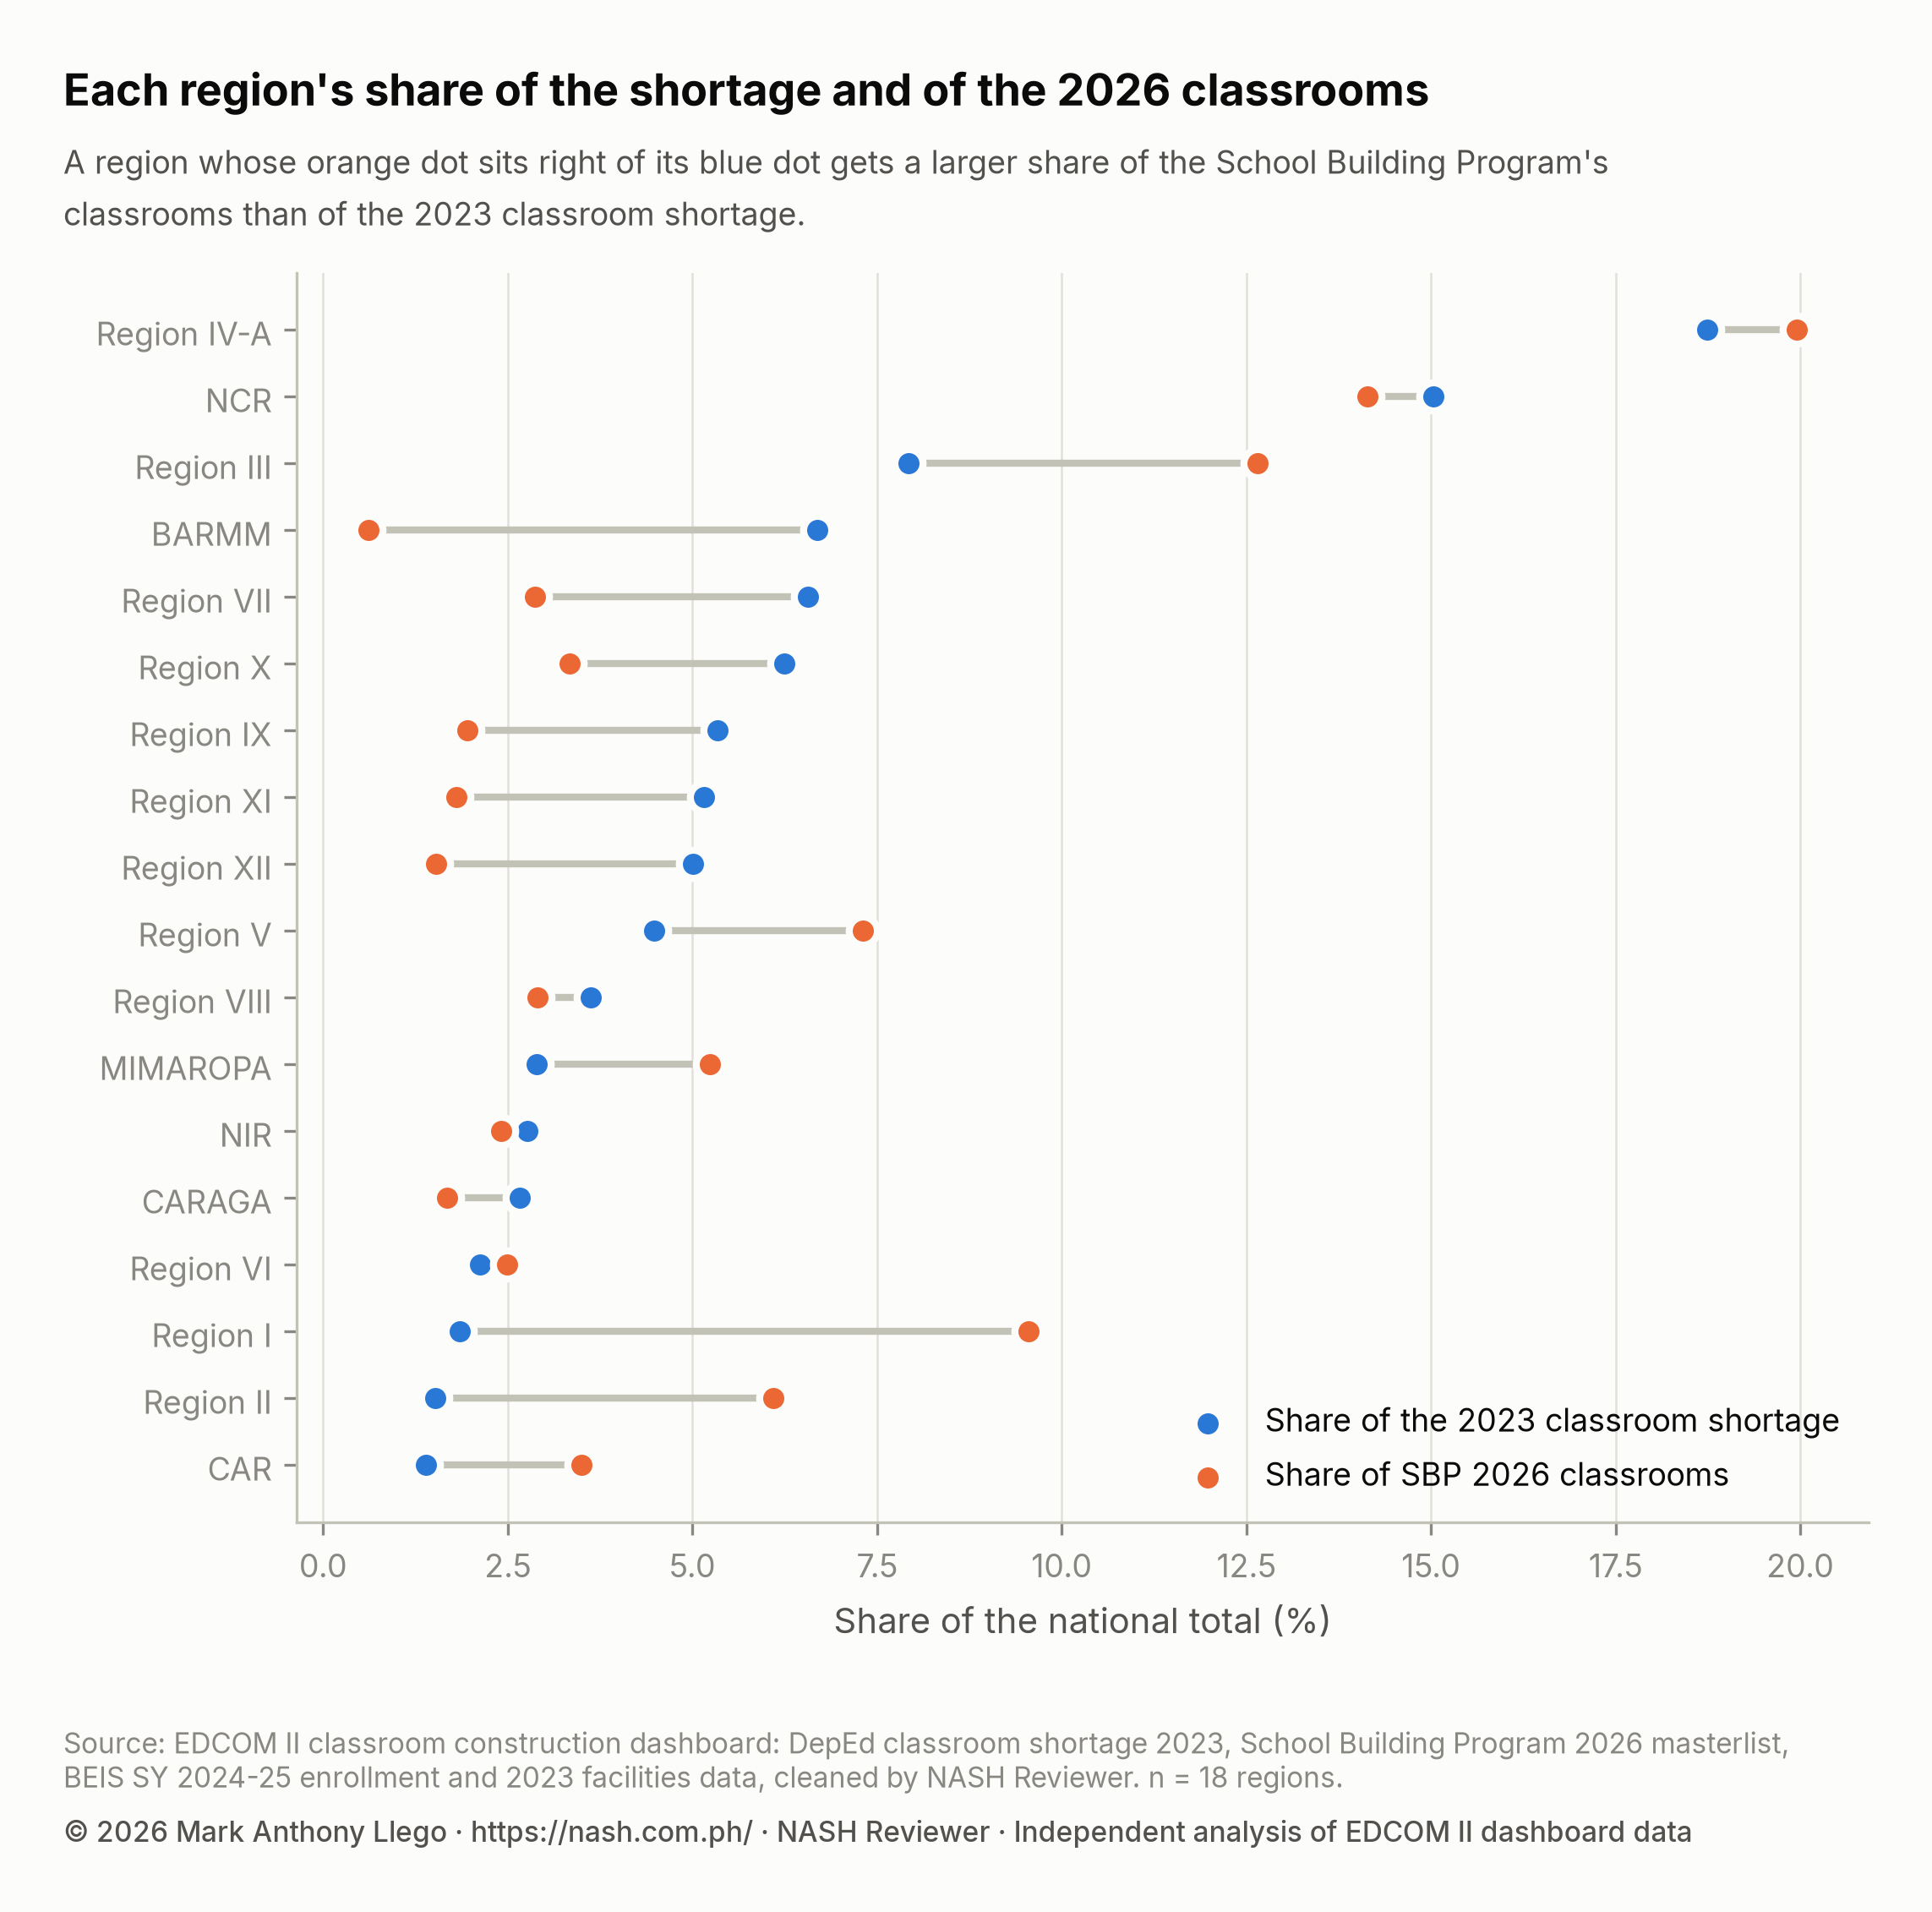
Several Luzon regions receive far larger shares of the classrooms than of the shortage. Region I has 3,097 SBP classrooms against a 2023 shortage of 3,061, a coverage of 101.2%; Region II’s coverage is 79.0% and CAR’s 49.2%. The two regions with the largest shortages are close to proportion: Region IV-A has 20.0% of the classrooms and 18.7% of the shortage, NCR 14.1% and 15.0%. Most Visayas and Mindanao regions fall below: Region VII has 2.9% of the classrooms against 6.6% of the shortage, Region IX 2.0% against 5.3% and Region XII 1.5% against 5.0%.
| Region | Classroom shortage, 2023 | SBP 2026 classrooms | Share of national shortage | Share of SBP classrooms | Coverage (SBP / shortage) |
|---|---|---|---|---|---|
| Region I | 3,061 | 3,097 | 1.9% | 9.6% | 101.2% |
| Region II | 2,501 | 1,977 | 1.5% | 6.1% | 79.0% |
| CAR | 2,301 | 1,133 | 1.4% | 3.5% | 49.2% |
| MIMAROPA | 4,777 | 1,696 | 2.9% | 5.2% | 35.5% |
| Region V | 7,415 | 2,370 | 4.5% | 7.3% | 32.0% |
| Region III | 13,119 | 4,103 | 7.9% | 12.7% | 31.3% |
| Region VI | 3,522 | 806 | 2.1% | 2.5% | 22.9% |
| Region IV-A | 31,010 | 6,470 | 18.7% | 20.0% | 20.9% |
| NCR | 24,866 | 4,584 | 15.0% | 14.1% | 18.4% |
| NIR | 4,579 | 782 | 2.8% | 2.4% | 17.1% |
| Region VIII | 5,990 | 940 | 3.6% | 2.9% | 15.7% |
| CARAGA | 4,410 | 542 | 2.7% | 1.7% | 12.3% |
| Region X | 10,333 | 1,082 | 6.2% | 3.3% | 10.5% |
| Region VII | 10,857 | 929 | 6.6% | 2.9% | 8.6% |
| Region IX | 8,826 | 634 | 5.3% | 2.0% | 7.2% |
| Region XI | 8,532 | 583 | 5.2% | 1.8% | 6.8% |
| Region XII | 8,281 | 494 | 5.0% | 1.5% | 6.0% |
| BARMM | 11,064 | 197 | 6.7% | 0.6% | 1.8% |
Region I’s coverage above 100% does not mean every Region I school’s shortage is met. Coverage adds up classrooms across a region, so rooms at schools with no shortage count against need elsewhere; nationally, 14,741 SBP classrooms go beyond the receiving school’s own 2023 shortage, as Do 2026 Classrooms Go Where the Shortage Is? shows.
BARMM has the widest gap: 197 SBP classrooms against a 2023 shortage of 11,064, a coverage of 1.8%, the lowest of any region, although it has the largest shortage relative to its learners (Philippine Classroom Shortage 2023: Where the Gap Is). In a 13 November 2025 news release, EDCOM II noted that the Bangsamoro Organic Law (RA 11054), Article VI, Section 13, says national programs and projects such as the School Building Program “shall continue to be funded by the National Government”, and reported, from its BARMM hearing with The Asia Foundation, that some national programs pulled back from BARMM after the law because of unclear interpretation. The masterlist cannot show whether that explains BARMM’s small share. It may also leave out classrooms built through the Bangsamoro government’s own budget, so the 1.8% describes the national program, not all classroom construction in the region.
How SBP 2026 compares with EDCOM II’s classroom figures
EDCOM II’s 20 October 2026 news release, Put classrooms where they’re needed most, EDCOM 2 tells DepEd, says DepEd targeted the construction of 18,950 classrooms in 2026 through multiple channels, under a special provision of the GAA 2026. That target and the masterlist’s 32,419 count different things at different dates: the masterlist includes PSIP III classrooms to be built in 2027 and 2028 and prefabricated Learning Continuity Spaces, and EDCOM II’s own analysis used DepEd’s School Building Plan as of 20 August 2026. These data cannot reconcile the two, so quote each with its source.
The same release reports that at the 16 October 2026 hearing, of the PHP 21.45 billion for 6,000 DPWH-led classrooms under the FY 2026 program, only PHP 1.87 billion, covering 533 classrooms, had reached the award or near-award stage; another PHP 7 billion, about 2,000 classrooms, had been advertised. The masterlist’s DPWH lines carry 6,142 classrooms and PHP 20.90 billion, close to those figures, but the masterlist has no column for procurement status.
It adds that for FY 2027, the National Expenditure Program proposes PHP 30.55 billion for classroom construction, and DepEd has requested an additional PHP 23.5 billion, for 2,385 new classrooms, 69 Last Mile School buildings, 500 Learning Continuity Spaces and the repair of 3,500 classrooms, among others. EDCOM II is also building a public classroom tracker, which could show what this masterlist cannot: whether each line has been bid, awarded and built. National Education Plan 2026-2035: Guide for School Heads summarizes the plan’s classroom targets.
What this means for school heads and teachers
- Check whether your school is on the list. Search the SBP lines file in the download section below for your school ID. Each line gives the modality, scope, classrooms, budget or “for bidding”, and expected dates.
- Write an allocation into the SIP and AIP as planned, not built. A PSIP III line is expected to be built from March 2027 to July 2028, so the school improvement plan still needs a plan for crowded rooms or shifts in the meantime.
- Know who builds your classrooms and talk to them early. A DPWH line goes through the DPWH, an LGU line through the province, city or municipality. Ask what the site needs, and plan Brigada Eskwela work around it; PPSSH Domain 2: Managing School Operations With DepEd Data covers this kind of facilities planning.
- Use the budget figures with care. They are allocations, and DepEd’s Last Mile School lines include items other lines may not. Do not use one modality’s figure as a cost estimate for another.
- If your school has a shortage but no line, document the gap for the division and the LGU, with the year and source of each figure: the shortage is DepEd’s 2023 estimate and the allocations are for 2026.
How these numbers were made
The data are the SBP 2026 masterlist and DepEd’s 2023 classroom shortage, as published in the EDCOM II classroom construction dashboard and cleaned for this series. Schools are counted by their current school ID, and classrooms are the masterlist’s classroom count, summed. A line is funded when it carries a GAA 2026 year (4,378 lines); PSIP III lines carry neither a GAA year nor a budget. The scope of work is classified from its text, and the number of stories is read from codes such as 2STY4CL or spelled-out text, taking the tallest building a line names.
Budget per classroom is budget divided by classrooms, for new-building lines with a budget and at least one classroom. The Kruskal-Wallis effect size is the H-based eta-squared: H minus the number of groups plus one, divided by the number of lines minus the number of groups (Tomczak & Tomczak, 2014). Epsilon-squared, H divided by the number of lines minus one, also rounds to 0.11 here. Dunn’s test compares average ranks with a correction for ties; Holm’s method multiplies the smallest of the three p-values by three, the next by two and the largest by one, keeping them in order. A region’s share of the shortage is its 2023 shortage divided by the national 165,443, its share of SBP classrooms is its classrooms divided by 32,419, and coverage is its classrooms divided by its shortage, counting every line, as the dashboard does. The analysis was done in Python with pandas and SciPy, and the charts drawn with Matplotlib.
Notes on the data:
- Totals. The cleaned data reproduce the dashboard’s 32,419 classrooms, the 16,114 funded and the coverage of 19.6%.
- Duplicates. 103 PSIP III lines repeat an earlier line in every column (1,554 classrooms). With no project ID, a second identical building cannot be told from a double entry, so they are kept; totals without them are 30,865.
- Missing counts. 10 lines have no classroom count, such as completions, a slope protection and a workshop. They are left empty, not zero.
- Scope mismatches. On 25 Last Mile School lines, the scope text names more classrooms than the count column, typically two buildings where the column counts one. Totals use the count column, as the dashboard does.
Limits
The masterlist is a plan: a line shows an allocation, not a signed contract or a finished building, and PSIP III classrooms are not yet bid out. Budgets are allocations, not contract prices, and they cover different items, so the cost comparison shows how allocations differ, not why. The shortage is DepEd’s own 2023 estimate and the allocations are for 2026, so some shortages may have changed in between. The totals include 103 PSIP III lines that may be double entries. Classrooms built through other budgets, such as the Bangsamoro government’s own, may not appear in the masterlist, and regional coverage hides how classrooms are spread among a region’s schools.
Frequently asked questions
How many classrooms are in DepEd’s School Building Program 2026?
The SBP 2026 masterlist in the EDCOM II classroom construction dashboard lists 32,419 classrooms at 5,231 public schools. Of these, 16,114 (49.7%) are funded under the GAA 2026 with PHP 55.47 billion, and 16,305 (50.3%) are PSIP III classrooms still for bidding.
What is PSIP III?
PSIP III is the third Public-Private Partnership for School Infrastructure Project. EDCOM II reported that it uses an “availability payment” model and targets over 16,000 classrooms. In the SBP 2026 masterlist, it holds 16,305 classrooms on 1,274 lines, all still for bidding.
How much does a classroom cost in the 2026 School Building Program?
The masterlist gives allocated budgets, not contract prices. In new classroom buildings, the median budget per classroom is PHP 3.25 million on DPWH lines, PHP 3.00 million on LGU lines and PHP 5.57 million on DepEd’s Last Mile School lines, whose scope texts usually add toilets, furniture, solar power and water systems.
Why does BARMM have so few SBP 2026 classrooms?
The masterlist does not say. BARMM has 197 SBP classrooms, 0.6% of the list, against 6.7% of the 2023 shortage. EDCOM II has reported that some national programs pulled back from BARMM after the Bangsamoro Organic Law because of unclear interpretation. The masterlist may also leave out classrooms built through the Bangsamoro government’s own budget.
Download the data and cite this post
The cleaned EDCOM II classroom data behind this series are free to download for personal study; to reuse them, email support@nash.com.ph for written permission first. How the EDCOM Classroom Data Was Cleaned explains every table and cleaning rule. The files are at data.nash.com.ph: start with the README, then the school table (Parquet, or CSV), the School Building Program lines (CSV), the city and municipality table (CSV), and every table for Stata and SPSS. Every figure quoted in this series, with the data behind each chart, is in analysis_tables.zip.
Every file, with its rows, columns and checksum, is listed on the EDCOM II classroom data page. To cite the data: Llego, M. A. (2026). EDCOM II classroom construction dashboard data, cleaned, version 1.1. NASH Reviewer. https://nash.com.ph/edcom-classroom-data
To cite this post: Llego, M. A. (2026, October 28). DepEd School Building Program 2026 in numbers. NASH Reviewer Blog. https://nash.com.ph/blog/deped-school-building-program-2026
References
- Dunn, O. J. (1964). Multiple comparisons using rank sums. Technometrics, 6(3), 241–252.
- Holm, S. (1979). A simple sequentially rejective multiple test procedure. Scandinavian Journal of Statistics, 6(2), 65–70.
- Kruskal, W. H., & Wallis, W. A. (1952). Use of ranks in one-criterion variance analysis. Journal of the American Statistical Association, 47(260), 583–621.
- Llego, M. A. (2026). EDCOM II classroom construction dashboard data, cleaned, version 1.1 [Data set]. NASH Reviewer. https://nash.com.ph/edcom-classroom-data
- Second Congressional Commission on Education (EDCOM II). (2025, November 13). Clarity needed on the implementation of 23 national education laws in BARMM [News release].
- Second Congressional Commission on Education (EDCOM II). (2026). National Education Plan 2026–2035 (Year Three report).
- Second Congressional Commission on Education (EDCOM II). (2026, February 9). EDCOM II: 51,000 classrooms likely to be condemned by 2028 [News release].
- Second Congressional Commission on Education (EDCOM II). (2026, October 20). Put classrooms where they’re needed most, EDCOM 2 tells DepEd [News release]. https://edcom2.gov.ph/put-classrooms-where-theyre-needed-most-edcom-2-tells-deped/
- Spearman, C. (1904). The proof and measurement of association between two things. American Journal of Psychology, 15(1), 72–101.
- Tomczak, M., & Tomczak, E. (2014). The need to report effect size estimates revisited. Trends in Sport Sciences, 21(1), 19–25.
More in this series
- How the EDCOM Classroom Data Was Cleaned
- Philippine Classroom Shortage 2023: Where the Gap Is
- DepEd School Building Program 2026 in Numbers
- Do 2026 Classrooms Go Where the Shortage Is?
- Classroom Allocation by LGU Income Class, 2026
- Class Shifts and Crowded Classrooms in DepEd Schools
- Last Mile Schools: Classroom Need and 2026 Allocation
- Regional reports: NCR, CAR, Region I, Region II, Region III, Region IV-A, MIMAROPA, Region V, Region VI, NIR, Region VII, Region VIII, Region IX, Region X, Region XI, Region XII, Caraga, BARMM
- Rankings and deep dives: Congressional districts, Top 20 cities and municipalities, Rizal, Quezon City, City of Manila, Tawi-Tawi, Cavite, Cost of a classroom
- Explainers: PSIP III, Senior high shortage, Junior high shortage, Excess classrooms, Learning Continuity Spaces, How learners reach school
- For teachers and school heads: Action research and thesis topics
- Related: DepEd Classroom and School Building Data, SY 2023-2024, EDCOM II Final Report: Guide for Aspiring School Heads, National Education Plan 2026-2035: Guide for School Heads, DepEd School Improvement Plan (SIP): Steps, AIP and SRC, How to Read DepEd Data: A Guide for Aspiring School Heads
Analysis and charts by Mark Anthony Llego for NASH Reviewer. Data: EDCOM II classroom construction dashboard and Department of Education data. NASH Reviewer is not affiliated with EDCOM II or DepEd. Charts may be reused only with written permission from support@nash.com.ph.