The chi-square test answers questions about counts: are urban schools more likely than rural schools to lack classrooms, are boys more likely than girls to choose a reading club, do learners in one section pass more often than in another? The Department of Education’s (DepEd) Action Research Toolkit names the chi-square test as the inferential statistic “for examining frequencies” (section 5.3) and describes causal-comparative research, which compares groups that already differ (section 3.3), but it does not show how to run the test. Here it is in Excel, with real DepEd data on the 2023 classroom shortage.
It is written for teachers and school heads doing a causal-comparative study or the “assessing the situation” stage of an action research, and for graduate students.
Key points
- For counts in categories. Use the chi-square test of independence when both variables are categories, such as urban or rural and with or without a shortage. For scores, use a t-test.
- Three steps in Excel. Put the observed counts in a table, compute the expected counts (row total × column total ÷ grand total), and use
=CHISQ.TEST(observed, expected)for the p-value. - Report the size of the difference. Nationally, 67.2% of urban public schools and 50.3% of rural ones had a classroom shortage in 2023: chi-square = 975.6, p < 0.001, but phi = 0.14, a weak association. With 47,495 schools, even weak associations are significant.
- Small samples change the verdict, not the difference. In Kidapawan City’s 75 schools, the urban-rural gap was as large as the national one (90.0% against 73.3%, phi = 0.20), yet chi-square = 3.12, p = 0.077: not significant with so few schools.
- Check the expected counts. Every expected count should be at least 5; if not, combine categories or use Fisher’s exact test.
When to use the chi-square test
| Your variables | Example | Test |
|---|---|---|
| Two categorical variables | School type (urban or rural) and shortage (yes or no) | Chi-square test of independence |
| A category and a score | Section and test score | t-test (two groups) or ANOVA (three or more) |
| Two scores | Literacy and numeracy scores | Pearson correlation |
In a causal-comparative study, the groups already exist, as the toolkit explains: the “presumed cause” has already happened, so the researcher compares groups after the fact. The chi-square test asks whether the share with some outcome differs between groups by more than chance would produce.
Hypotheses. Null: the two variables are independent (for example, the share of schools with a shortage is the same in urban and rural schools). Research: the variables are related.
The chi-square test in Excel, step by step
The example: of the 47,495 public schools in DepEd’s 2023 classroom shortage data with an urban or rural type, how many had a shortage?
Step 1. Enter the observed counts in a table, with totals:
| Shortage | No shortage | Total | |
|---|---|---|---|
| Urban | 7,341 | 3,578 | 10,919 |
| Rural | 18,383 | 18,193 | 36,576 |
| Total | 25,724 | 21,771 | 47,495 |
In Excel, put the four counts in B2:C3; the row totals in D2:D3 with =SUM(B2:C2); the column totals in B4:C4 with =SUM(B2:B3); and the grand total in D4.
Step 2. Compute the expected counts, what each cell would hold if school type made no difference: row total × column total ÷ grand total. In B7, for urban schools with a shortage: =$D2*B$4/$D$4, then copy it across and down to C8.
| Shortage | No shortage | |
|---|---|---|
| Urban | 5,913.9 | 5,005.1 |
| Rural | 19,810.1 | 16,765.9 |
Urban schools have more shortages than expected (7,341 against 5,913.9), and rural schools fewer.
Step 3. Get the p-value: =CHISQ.TEST(B2:C3, B7:C8). It returns a value far below 0.001.
Step 4. Get the chi-square statistic, which CHISQ.TEST does not show. Either add up (observed − expected)² ÷ expected for every cell, with =SUMPRODUCT((B2:C3-B7:C8)^2/B7:C8), or recover it from the p-value with =CHISQ.INV.RT(p-value, 1). Here, chi-square = 975.6.
Step 5. Compare and decide. The degrees of freedom are (rows − 1) × (columns − 1) = 1. The critical value at alpha = 0.05 is 3.841 (=CHISQ.INV.RT(0.05, 1)). Since 975.6 > 3.841 and p < 0.05, reject the null hypothesis: in 2023, urban public schools were more likely than rural ones to have a classroom shortage.
Step 6. Measure the size of the association. For a two-by-two table, phi = √(chi-square ÷ N) = √(975.6 ÷ 47,495) = 0.14. A common rough guide calls 0.1 small, 0.3 medium and 0.5 large, so this is a small association. In plain terms: 67.2% of urban schools had a shortage, against 50.3% of rural ones.
Excel’s CHISQ.TEST does not apply a continuity correction, which some statistics programs add for two-by-two tables; with large counts the difference is negligible.
The same gap with 75 schools
A teacher or division researcher usually works with one division. In the Schools Division of Kidapawan City, with 75 public schools in the same data, the gap between urban and rural schools is about the same size as nationally:
| Shortage | No shortage | Total | Expected shortage | Expected no shortage | |
|---|---|---|---|---|---|
| Urban | 27 | 3 | 30 | 24.0 | 6.0 |
| Rural | 33 | 12 | 45 | 36.0 | 9.0 |
90.0% of urban schools and 73.3% of rural schools had a shortage, a gap of about 17 points, as nationally. But chi-square = 3.12 and p = 0.077: not significant at 0.05. The association is, if anything, stronger (phi = 0.20 against 0.14), yet with 75 schools a gap of this size can arise by chance. Fisher’s exact test, which does not rely on the chi-square approximation, gives p = 0.139.
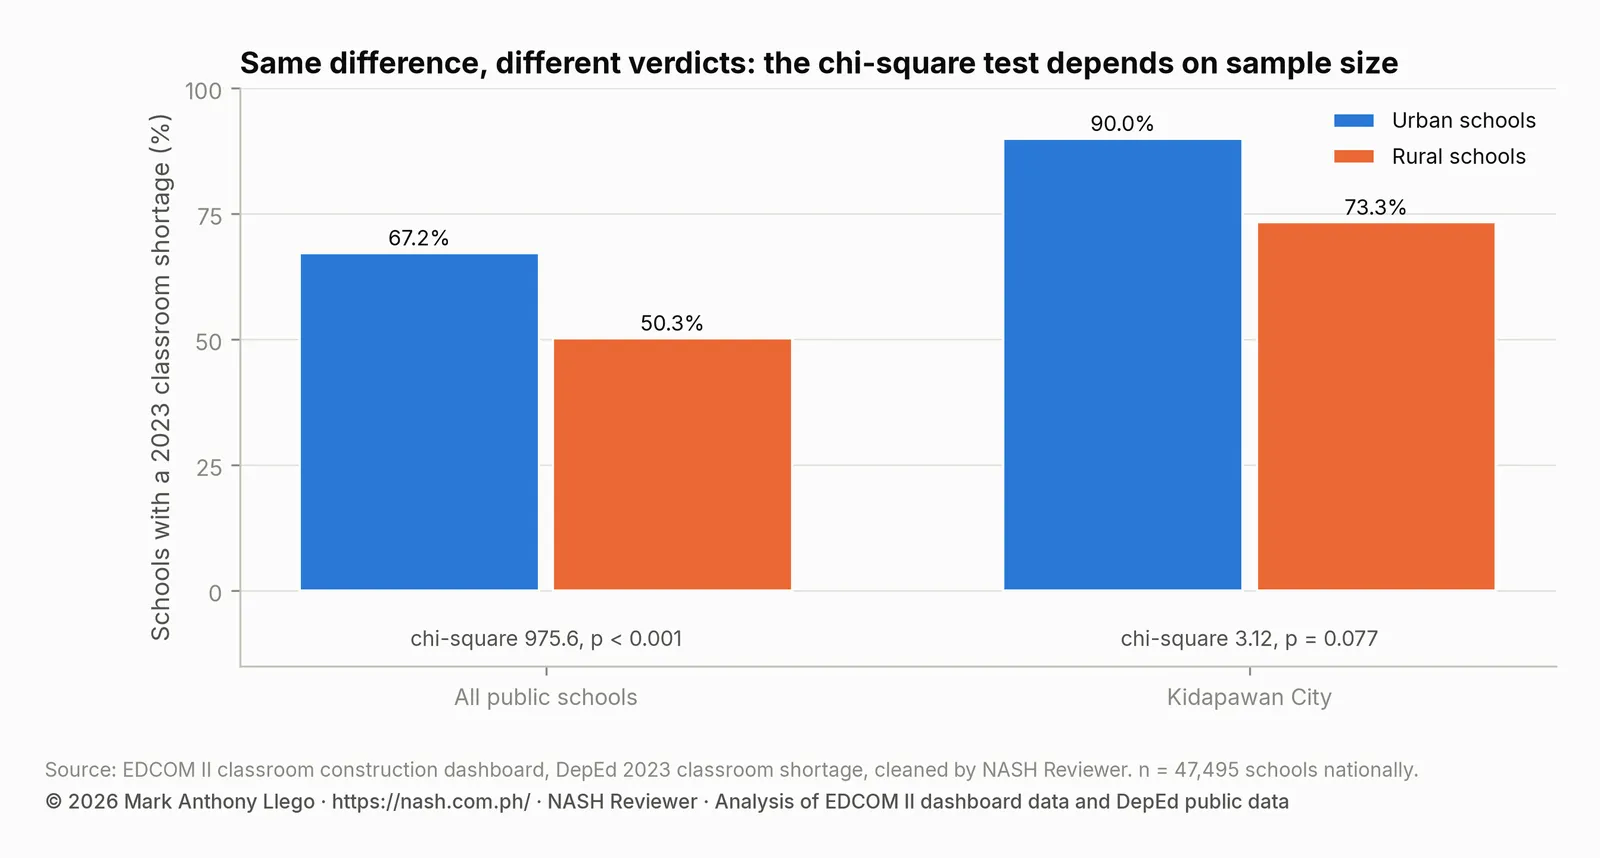
The lesson for action research: a non-significant result in a small study does not mean there is no difference. Report the percentages and the effect size, and say that the sample was too small to tell. Among divisions with 60 to 90 schools and at least 10 urban and 10 rural schools, Kidapawan City’s urban-rural gap is the closest to the national gap.
Larger tables and Cramér’s V
The test works the same way for larger tables. By school size, nationally:
| Learners in the school | With a shortage | No shortage | Schools | Share with a shortage | Expected with a shortage |
|---|---|---|---|---|---|
| 100 or fewer | 4,802 | 4,128 | 8,930 | 53.8% | 4,836.6 |
| 101 to 500 | 13,172 | 14,367 | 27,539 | 47.8% | 14,915.5 |
| Over 500 | 7,750 | 3,276 | 11,026 | 70.3% | 5,971.8 |
With three rows and two columns, the degrees of freedom are (3 − 1) × (2 − 1) = 2, and the critical value at 0.05 is 5.991. Chi-square = 1,600.2, p < 0.001. For tables larger than two-by-two, use Cramér’s V = √(chi-square ÷ (N × (k − 1))), where k is the smaller of the number of rows and columns: here V = 0.18, a small association. The largest schools are the most likely to have a shortage, 70.3% of them.
Assumptions to check
- Counts, not percentages. Enter the number of cases in each cell, never percentages or means.
- Each case once. Every school, learner or response belongs to exactly one cell. Questions where respondents can choose several answers break this rule.
- Independent cases. Pretest and posttest answers from the same learners are not independent; for a yes-or-no outcome measured twice, McNemar’s test is the right one.
- Expected counts of at least 5. If any expected count is below 5, merge categories that make sense together, or use Fisher’s exact test for a two-by-two table (Excel has no built-in function for it; free programs such as JASP and jamovi do).
How to report a chi-square test
Urban schools were more likely than rural schools to have a classroom shortage in 2023 (67.2% against 50.3%), χ²(1, N = 47,495) = 975.6, p < 0.001, φ = 0.14.
Give the percentages in each group, chi-square with its degrees of freedom and N, the p-value, and phi or Cramér’s V. Show the table of observed counts.
Common mistakes
- Using percentages instead of counts in the observed table.
- Reporting only the p-value. With large samples, weak associations are significant; with small ones, real differences are not.
- Ignoring small expected counts. Check them before you trust the p-value.
- Reading cause into the result. A causal-comparative study shows that groups differ, not why; urban schools are also larger, for example.
- Using chi-square for scores. Turning test scores into “passed” and “failed” throws away information; compare the scores with a t-test.
Frequently asked questions
How do you do a chi-square test in Excel?
Enter the observed counts, compute each expected count as row total × column total ÷ grand total, and use =CHISQ.TEST(observed range, expected range), which returns the p-value. For the chi-square statistic, use =CHISQ.INV.RT(p-value, degrees of freedom) or add up (observed − expected)² ÷ expected for every cell.
What are the degrees of freedom for a chi-square test of independence?
(Number of rows − 1) × (number of columns − 1). A two-by-two table has 1 degree of freedom, and its critical value at 0.05 is 3.841; a three-by-two table has 2, with a critical value of 5.991.
What is the minimum expected count for a chi-square test?
A common rule is at least 5 in every cell. If some expected counts are smaller, combine categories or use Fisher’s exact test for a two-by-two table.
What is the difference between phi and Cramér’s V?
Both measure the strength of an association in a table of counts, from 0 (none) to 1. Phi is used for two-by-two tables; Cramér’s V extends it to larger tables. For a two-by-two table, the two are equal.
More on DepEd research
- Start here: DepEd Action Research Guide: From Topic to Report
- Pearson Correlation in Excel for Action Research
- One-Way ANOVA in Excel for Action Research
- Paired and Independent t-Test in Excel for Action Research
- Weighted Mean and Likert Scale Interpretation in Excel
- Action Research Sample Size: Slovin, Power and Sampling
- Action Research Questions and Hypotheses, With Examples
- Related: Action Research and Thesis Topics on Classroom Shortage, Philippine Classroom Shortage 2023: Where the Gap Is
Sources
- Department of Education and the Basic Education Sector Transformation (BEST) Program. (2019). Action Research Toolkit: Teacher’s Guide, sections 3.3 (causal-comparative research) and 5.3 (inferential statistics), with support from the Australian Government.
- Classroom shortage: the EDCOM II classroom data, DepEd’s 2023 classroom shortage by school, cleaned by NASH Reviewer.
- Microsoft. CHISQ.TEST function.
- Cohen, J. (1988). Statistical power analysis for the behavioral sciences (second edition). Lawrence Erlbaum Associates.
Analysis and chart by Mark Anthony Llego for NASH Reviewer. NASH Reviewer is not affiliated with DepEd.