A correlational study asks whether two things go together: learners’ literacy and numeracy scores, a school’s Grade 1 and Grade 3 reading results, class size and achievement. The Department of Education’s (DepEd) Action Research Toolkit uses correlational research to assess the situation before an intervention (section 3.4) and shows the correlation coefficient in its section on descriptive statistics (5.2). Below, Pearson’s r is computed in Excel with the toolkit’s own data, with the p-value the toolkit leaves out, and then real Comprehensive Rapid Literacy Assessment (CRLA) data show what a correlation can and cannot tell you.
It is written for teachers planning a correlational study or the “assessing the situation” stage of an action research, and for graduate students.
Key points
- One function.
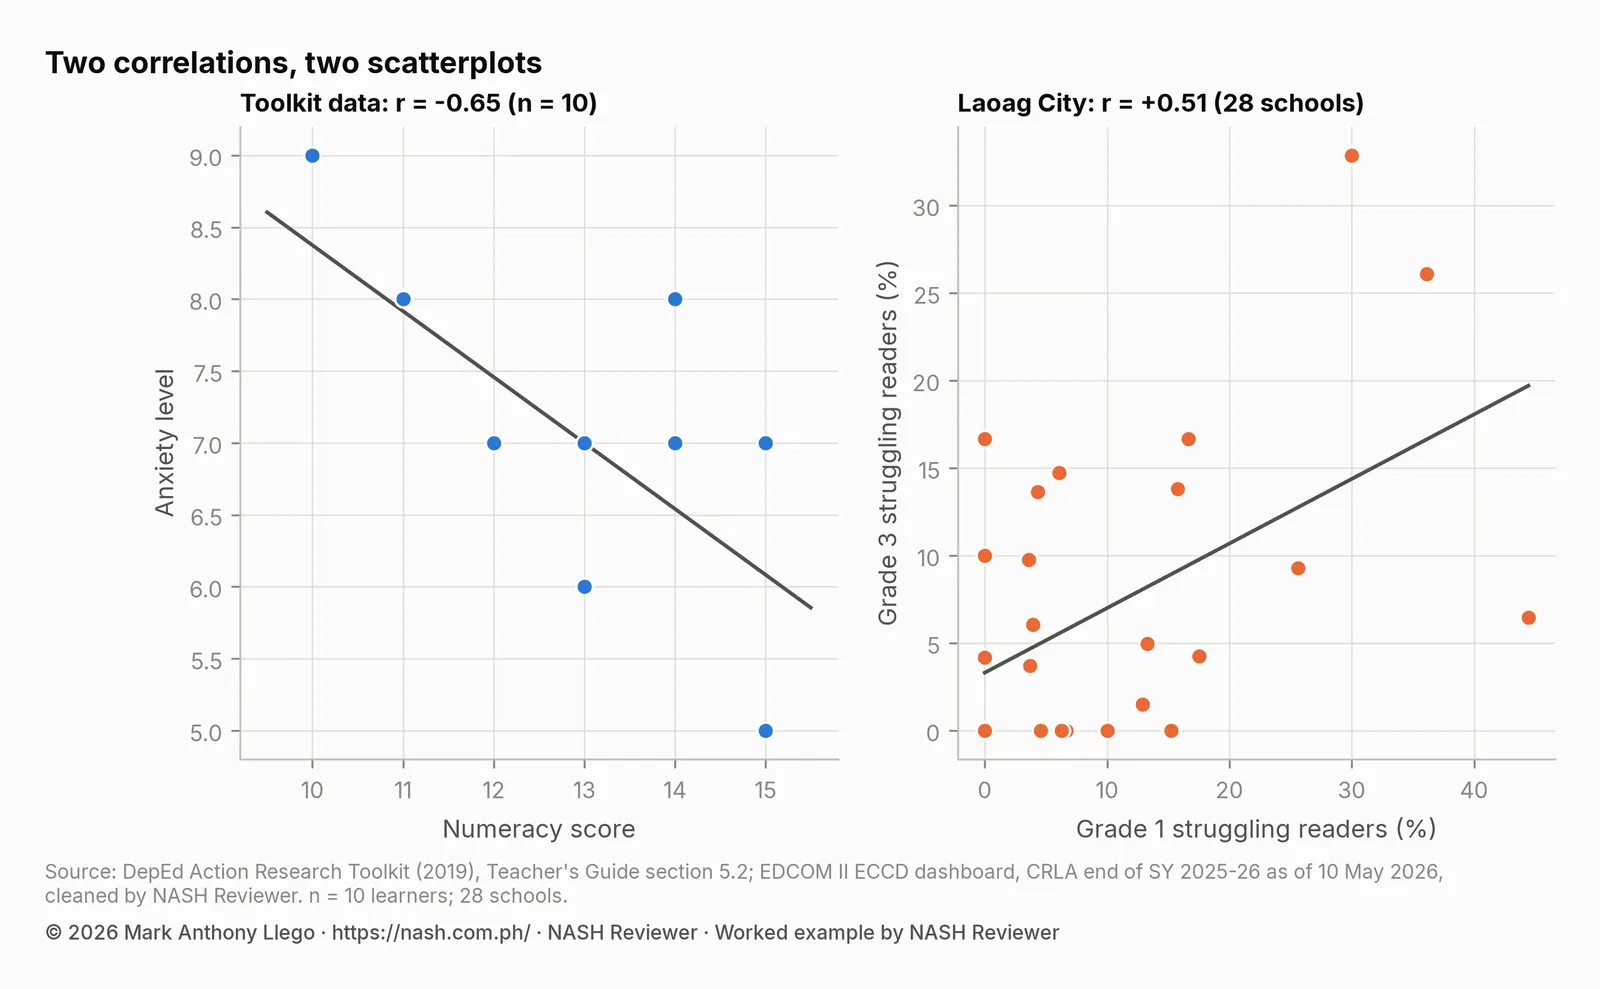
=CORREL(B2:B11, C2:C11)gives Pearson’s r;=PEARSONgives the same value, and=RSQgives r². - Check significance too. With the toolkit’s 10 learners, numeracy and anxiety correlate at r = −0.65 (p = 0.043), but literacy and numeracy at r = +0.35 only (p = 0.316): with 10 people, r must reach about 0.63 to pass the 0.05 test.
- Plot first. A scatterplot shows whether the relationship is a straight line, curved, or driven by one unusual point.
- Use Spearman’s rho for ranks or skewed data: rank both columns with
RANK.AVG, then useCORRELon the ranks. - Correlation is not cause. Across 29,999 schools, the share of struggling readers in Grade 1 goes with the share in Grade 3 (r = 0.50), but they are different learners: the link reflects what the schools share. Learners per classroom, often blamed for low reading results, correlates at only 0.08.
What a correlation measures
The correlation coefficient describes how two variables move together. The toolkit describes its two parts:
- Direction. Positive (direct): as one rises, so does the other. Negative (inverse): as one rises, the other falls.
- Strength. From 0 (no relationship) to 1 (a perfect relationship). The toolkit’s guide: 0.1 to 0.3 is weak, 0.4 to 0.6 moderate, and 0.7 to 0.9 strong. Values between these bands, such as 0.35 or 0.65, sit at the borders; describe them as “weak to moderate” or “moderate to strong”.
Pearson’s r measures a straight-line relationship between two measured variables, such as test scores. For ranks, ordered categories or very skewed data, use Spearman’s rho, which is Pearson’s r on the ranks.
Pearson’s r in Excel, step by step
The toolkit’s data are the literacy and numeracy scores and anxiety levels of 10 Grade 3 pupils:
| Pupil | Literacy | Numeracy | Anxiety |
|---|---|---|---|
| 1 | 26 | 12 | 7 |
| 2 | 25 | 15 | 7 |
| 3 | 27 | 14 | 7 |
| 4 | 24 | 10 | 9 |
| 5 | 25 | 15 | 5 |
| 6 | 24 | 11 | 8 |
| 7 | 25 | 14 | 8 |
| 8 | 23 | 13 | 6 |
| 9 | 25 | 13 | 7 |
| 10 | 26 | 13 | 6 |
With literacy in B2:B11, numeracy in C2:C11 and anxiety in D2:D11:
- Compute r.
=CORREL(B2:B11, C2:C11)returns 0.35 for literacy and numeracy.=CORREL(C2:C11, D2:D11)returns −0.65 for numeracy and anxiety, and=CORREL(B2:B11, D2:D11)−0.17 for literacy and anxiety. These match the toolkit’s answer key. - Compute the t-value. For r in cell F2 and n = 10:
=F2*SQRT((10-2)/(1-F2^2)). - Compute the p-value. For the t-value in G2:
=T.DIST.2T(ABS(G2), 10-2). - Compute r², the share of variation the two variables have in common:
=RSQ(C2:C11, D2:D11), or=F2^2.
For several variables at once, the Analysis ToolPak’s Correlation tool (Data, Data Analysis, Correlation) prints a matrix of every pair. Paired and Independent t-Test in Excel for Action Research shows how to turn on the ToolPak.
| Pair | r | t | p (two-tailed) | r² | Reading |
|---|---|---|---|---|---|
| Literacy and numeracy | +0.35 | 1.07 | p = 0.316 | 0.12 | Weak to moderate, positive; not significant |
| Literacy and anxiety | −0.17 | −0.48 | p = 0.645 | 0.03 | Weak, negative; not significant |
| Numeracy and anxiety | −0.65 | −2.41 | p = 0.043 | 0.42 | Moderate to strong, negative; significant at 0.05 |
The toolkit describes the numeracy-anxiety link as “a moderate inverse relationship”, and the p-value backs it, narrowly: with only 10 pupils, a correlation must be at least 0.63 in size to reach p < 0.05. The literacy-numeracy correlation of 0.35 could easily arise by chance in a group this small, so it should be described as an observation to follow up, not a finding. Numeracy and anxiety share 42% of their variation (r² = 0.42); literacy and numeracy only 12%.
Make the scatterplot
Select the two columns, then Insert, Scatter. Right-click a point, choose Add Trendline, and check Display R-squared value on chart. Always look at the plot before you report r: one unusual pupil can create or hide a correlation in a small group, and a curved relationship can have an r near zero.
A real example: Grade 1 and Grade 3 reading in Laoag City
The CRLA counts the learners at each reading level in every public school. For each of the 28 schools in the Schools Division of Laoag City with at least 10 learners assessed in both Grade 1 (Mother Tongue) and Grade 3 (English), the table gives the share of struggling readers, those at Low or High Emerging, at the end of SY 2025-26. Schools are coded, not named.
| School | Grade 1 learners | Grade 1 struggling (%) | Grade 3 learners | Grade 3 struggling (%) |
|---|---|---|---|---|
| School 1 | 45 | 44.4 | 31 | 6.5 |
| School 2 | 36 | 36.1 | 46 | 26.1 |
| School 3 | 20 | 30.0 | 70 | 32.9 |
| School 4 | 82 | 25.6 | 97 | 9.3 |
| School 5 | 40 | 17.5 | 47 | 4.3 |
| School 6 | 12 | 16.7 | 12 | 16.7 |
| School 7 | 19 | 15.8 | 29 | 13.8 |
| School 8 | 46 | 15.2 | 79 | 0.0 |
| School 9 | 158 | 13.3 | 202 | 5.0 |
| School 10 | 62 | 12.9 | 67 | 1.5 |
| School 11 | 10 | 10.0 | 14 | 0.0 |
| School 12 | 15 | 6.7 | 23 | 0.0 |
| School 13 | 16 | 6.2 | 17 | 0.0 |
| School 14 | 33 | 6.1 | 34 | 14.7 |
| School 15 | 22 | 4.5 | 20 | 0.0 |
| School 16 | 23 | 4.3 | 22 | 13.6 |
| School 17 | 102 | 3.9 | 99 | 6.1 |
| School 18 | 27 | 3.7 | 54 | 3.7 |
| School 19 | 28 | 3.6 | 41 | 9.8 |
| School 20 | 22 | 0.0 | 23 | 0.0 |
| School 21 | 20 | 0.0 | 24 | 4.2 |
| School 22 | 30 | 0.0 | 26 | 0.0 |
| School 23 | 26 | 0.0 | 24 | 0.0 |
| School 24 | 11 | 0.0 | 20 | 10.0 |
| School 25 | 15 | 0.0 | 19 | 0.0 |
| School 26 | 18 | 0.0 | 13 | 0.0 |
| School 27 | 26 | 0.0 | 12 | 0.0 |
| School 28 | 19 | 0.0 | 12 | 16.7 |
Copy the two percentage columns into Excel and follow the steps: r = 0.51, t = 3.03 with 26 degrees of freedom, p = 0.006, and r² = 0.26. Schools with more struggling readers in Grade 1 tend to have more in Grade 3: a moderate, positive relationship.
Among the 41 divisions with 20 to 30 such schools, Laoag City’s correlation is the closest to the national value. The others range from −0.27 to 0.78, so the answer in your own division may differ; run it there.
Spearman’s rho for skewed data
Many of these shares are zero, and a few schools are far from the rest, which can sway Pearson’s r. Spearman’s rho uses ranks instead. In Excel, rank each column with =RANK.AVG(C2, $C$2:$C$29, 1) (copied down, and the same for the Grade 3 column), then use CORREL on the two rank columns. In Laoag City, rho = 0.43, close to r, so the relationship is not just the work of one or two schools.
Correlation is not cause
Across all 29,999 public schools with at least 10 learners in both grades, the Grade 1 and Grade 3 shares correlate at r = 0.50 (rho = 0.47). But a school’s Grade 1 learners do not cause its Grade 3 learners to struggle; they are different children. The correlation reflects what the two grades share: the community and its languages, the school’s resources, its teachers and its leadership. A correlational study can point to such shared conditions; it cannot say which one matters.
The opposite lesson comes from class size. Learners per classroom, a common suspect for low reading results, correlates with a school’s share of struggling readers at only r = 0.08 (rho = 0.14) across schools with at least 30 learners assessed, and almost not at all within divisions, as Action Research and Thesis Topics on Reading (CRLA) shows. A weak correlation is a finding too: whatever separates schools with many struggling readers, crowding alone is not it.
These are the reasons the toolkit places correlational research at the first stage of action research, “assessing the situation”. A correlation points to where an intervention might help; an experiment, with a comparison group, tests whether it does.
Correlation, sample size and significance
With few cases, only strong correlations reach significance. With 30 pairs, r must be at least 0.36 to reach p < 0.05; with 50 pairs, 0.28; with 100 pairs, 0.20. The toolkit suggests at least 50 for correlational studies for this reason. With thousands of cases, the reverse problem appears: almost any correlation is significant, so report r and r², not only the p-value. Action Research Sample Size: Slovin, Power and Sampling has more.
How to report a correlation
There was a moderate positive correlation between the shares of struggling readers in Grade 1 and Grade 3 across the 28 schools, r(26) = 0.51, p = 0.006; Spearman’s rho was 0.43.
Give r with its degrees of freedom (n − 2), the p-value, the number of cases and, for skewed data, Spearman’s rho. Show the scatterplot.
Common mistakes
- Reporting r without looking at the scatterplot. One outlier can make or break a correlation in a small group.
- Calling a correlation in a small group significant without testing it. With 10 cases, r = 0.35 is well within chance.
- Reading cause into correlation. Say “is associated with”, not “affects”.
- Using Pearson’s r on ranks or ordered categories. Use Spearman’s rho.
- Correlating a variable with something computed from it. A school’s learners per classroom is built from its enrollment, so the two are linked by arithmetic, not only by what happens in the school.
- Mixing levels. A correlation across schools describes schools, not individual learners.
Frequently asked questions
How do you compute Pearson’s r in Excel?
Use =CORREL(range1, range2) or =PEARSON(range1, range2) on two columns of paired values. For the p-value, compute t = r × √((n − 2) ÷ (1 − r²)) and use =T.DIST.2T(ABS(t), n-2).
How do you interpret the correlation coefficient?
By direction and strength. A positive r means the variables rise together; a negative r means one falls as the other rises. DepEd’s Action Research Toolkit describes 0.1 to 0.3 as weak, 0.4 to 0.6 as moderate and 0.7 to 0.9 as strong. Check the p-value and r² too.
When should I use Spearman’s rho instead of Pearson’s r?
When your data are ranks or ordered categories (such as reading levels or Likert answers), when they are very skewed, or when a few extreme values could sway the result. In Excel, rank both columns with RANK.AVG and use CORREL on the ranks.
Is a correlation enough for an action research?
No. DepEd’s Action Research Toolkit places correlational research in the first stage, assessing the situation. It can show which conditions go together and point to an intervention; an experimental or qualitative action research then tests the intervention.
More on DepEd research
- Start here: DepEd Action Research Guide: From Topic to Report
- Chi-Square Test in Excel for Action Research
- Weighted Mean and Likert Scale Interpretation in Excel
- Validity, Reliability and Cronbach’s Alpha in Excel
- Paired and Independent t-Test in Excel for Action Research
- Action Research Questions and Hypotheses, With Examples
- Related: CRLA Variation: School, Division or Region?, School Resources and CRLA Reading Results
Sources
- Department of Education and the Basic Education Sector Transformation (BEST) Program. (2019). Action Research Toolkit: Teacher’s Guide, sections 3.4 (correlational research) and 5.2 (descriptive statistics), with support from the Australian Government.
- CRLA results: the EDCOM II early-childhood dashboard data, cleaned by NASH Reviewer, end of SY 2025-26 as of 10 May 2026, with DepEd’s SY 2023-24 school files for learners per classroom.
- Microsoft. CORREL function.
Analysis and chart by Mark Anthony Llego for NASH Reviewer. NASH Reviewer is not affiliated with DepEd.