Most surveys in Philippine action research use a Likert scale, and most of them report a weighted mean with a verbal interpretation: 4.25, “strongly agree”. Below are the Excel steps for descriptive statistics and the weighted mean, the origin of the usual interpretation scale, and a way to report Likert results so that they mean what they seem to. They follow the Department of Education’s (DepEd) Action Research Toolkit, sections 4.2 (paper-and-pencil instruments) and 5.2 (descriptive statistics), and correct two slips in them.
The three examples are the toolkit’s own literacy, numeracy and anxiety scores; a 30-teacher survey on using Comprehensive Rapid Literacy Assessment (CRLA) results, made up for this guide so the arithmetic is easy to follow; and the real CRLA reading levels of 1,594,608 Grade 1 learners, which show why an average of ordered categories can mislead.
Key points
- Six Excel functions cover descriptive statistics.
AVERAGE,MEDIAN,MODE.SNGL,MAXandMIN(for the range),VAR.SandSTDEV.S. - The weighted mean is one formula. For an item with counts in cells B2 to F2 for “strongly agree” (5) to “strongly disagree” (1):
=SUMPRODUCT({5,4,3,2,1},B2:F2)/SUM(B2:F2). - The interval scale divides 4 by 5. On a five-point scale, each band is (5 − 1) ÷ 5 = 0.80 wide: 1.00–1.80, 1.81–2.60, 2.61–3.40, 3.41–4.20 and 4.21–5.00. The toolkit’s printed list begins “From 1 to 0.80” and stops at 4.20; the full scale is above.
- Reverse-score negatively worded items before combining them: in Excel,
=6-B2on a five-point scale. - Report the distribution, not only the mean. Likert answers are ordered categories. An item with a mean of 4.30, “strongly agree” by the scale, had a median answer of only “agree”.
Descriptive statistics in Excel
The toolkit’s section 5.2 uses the literacy and numeracy scores and anxiety levels of 10 Grade 3 pupils. Type them in three columns (rows 2 to 11), then use these formulas for each column:
| Statistic | What it tells you | Excel formula (literacy in B2:B11) |
|---|---|---|
| Mean | The average | =AVERAGE(B2:B11) |
| Median | The middle value when sorted | =MEDIAN(B2:B11) |
| Mode | The most frequent value | =MODE.SNGL(B2:B11) |
| Maximum and minimum | The highest and lowest values | =MAX(B2:B11), =MIN(B2:B11) |
| Range | Highest minus lowest | =MAX(B2:B11)-MIN(B2:B11) |
| Variance | The average squared distance from the mean | =VAR.S(B2:B11) |
| Standard deviation | The typical distance from the mean | =STDEV.S(B2:B11) |
The results match the toolkit’s answer key:
| Variable | Mode | Median | Mean | Maximum | Minimum | Range | Variance | Standard deviation |
|---|---|---|---|---|---|---|---|---|
| Literacy | 25.00 | 25.00 | 25.00 | 27.00 | 23.00 | 4.00 | 1.33 | 1.15 |
| Numeracy | 13.00 | 13.00 | 13.00 | 15.00 | 10.00 | 5.00 | 2.67 | 1.63 |
| Anxiety | 7.00 | 7.00 | 7.00 | 9.00 | 5.00 | 4.00 | 1.33 | 1.15 |
The toolkit’s text gives the literacy range as 5; 27 minus 23 is 4, as its answer key shows. Use VAR.S and STDEV.S, the versions for a sample, as the toolkit’s answers do; VAR.P and STDEV.P divide by the number of scores instead of one less, and give slightly smaller values.
The Analysis ToolPak gives all of these at once: Data, Data Analysis, Descriptive Statistics, select the columns, and check Summary statistics. Paired and Independent t-Test in Excel for Action Research shows how to turn on the ToolPak.
The Likert scale
The toolkit describes the Likert scale as the most popular rating scale, asking “respondents to indicate the degree of their agreement or disagreement with statements, from strongly agree to strongly disagree”. Scales that ask about frequency (always to never) or extent are “Likert-type” scales. Its advice on writing them:
- have “about equal number of positively stated” and “negatively stated items”, so that respondents do not fall into a “response set”, answering every item the same way;
- give positive items the highest value for a positive answer, and reverse the scoring for negative items; and
- have a subject-matter expert, and if possible a measurement expert, check the draft.
Validity, Reliability and Cronbach’s Alpha in Excel covers checking whether the items work together.
Computing the weighted mean
A weighted mean averages the answers using their codes as weights: 5 for strongly agree down to 1 for strongly disagree.
Weighted mean = (5 × f₅ + 4 × f₄ + 3 × f₃ + 2 × f₂ + 1 × f₁) ÷ N
where f is the number of respondents choosing each option and N is the number who answered. For the first item of our example survey, 9 teachers strongly agreed, 13 agreed, 5 were neutral, 2 disagreed and 1 strongly disagreed:
(5 × 9 + 4 × 13 + 3 × 5 + 2 × 2 + 1 × 1) ÷ 30 = 117 ÷ 30 = 3.90
In Excel, with the counts in B2 (strongly agree) to F2 (strongly disagree):
=SUMPRODUCT({5,4,3,2,1},B2:F2)/SUM(B2:F2)
If you have each respondent’s answer instead of counts, the weighted mean is simply =AVERAGE of the answers, and =MEDIAN, =MODE.SNGL and =STDEV.S work on the same column. Keeping each respondent’s answers is better: you can then reverse-score items, compute scale totals and check reliability.
Interpreting the weighted mean: the 0.80 scale
The toolkit explains the usual interpretation scale: the range of a five-point scale is 5 − 1 = 4, divided into five equal bands of 4 ÷ 5 = 0.80, starting from 1.
| Weighted mean | Agreement scale | Frequency scale (example) |
|---|---|---|
| 4.21 – 5.00 | Strongly agree | Always |
| 3.41 – 4.20 | Agree | Often |
| 2.61 – 3.40 | Neutral (undecided) | Sometimes |
| 1.81 – 2.60 | Disagree | Rarely |
| 1.00 – 1.80 | Strongly disagree | Never |
The toolkit’s printed list has two slips. Its first band reads “From 1 to 0.80 represents (strongly disagree)”, which should be 1.00 to 1.80, and the list stops at “From 3.41 until 4.20 represents agree”, leaving out the top band, 4.21 to 5.00, strongly agree.
Some researchers instead round the mean to the nearest whole point (1.00–1.49, 1.50–2.49, and so on), which gives different bands. Neither is an official DepEd standard; choose one, state it in your methods section, and use the labels that match your answer options. DepEd’s own 2026 teacher workload survey shows why: its decks report weighted means with verbal labels but print no scale (DepEd 2026 Teacher Workload Survey). For a four-point scale, the band width is (4 − 1) ÷ 4 = 0.75.
A worked example: 30 teachers and the CRLA
The table shows a survey, made up for this guide, of 30 Grades 1 to 3 teachers on using the CRLA results. Item 5 is negatively worded.
| Item | Statement | Strongly agree (5) | Agree (4) | Neutral (3) | Disagree (2) | Strongly disagree (1) | Weighted mean | SD | Median | Interpretation |
|---|---|---|---|---|---|---|---|---|---|---|
| Item 1 | I use the CRLA results to group learners for reading instruction. | 9 | 13 | 5 | 2 | 1 | 3.90 | 1.03 | 4 | Agree |
| Item 2 | I understand what each CRLA reading level means. | 12 | 12 | 4 | 2 | 0 | 4.13 | 0.90 | 4 | Agree |
| Item 3 | I have enough time to give the CRLA to every learner. | 3 | 7 | 6 | 10 | 4 | 2.83 | 1.23 | 3 | Neutral |
| Item 4 | The CRLA results match what I see in class. | 6 | 14 | 6 | 3 | 1 | 3.70 | 1.02 | 4 | Agree |
| Item 5 | I find the CRLA results hard to use in planning lessons. | 4 | 8 | 7 | 8 | 3 | 3.07 | 1.23 | 3 | Neutral |
| Item 6 | I would like more training on using the CRLA results. | 14 | 12 | 3 | 1 | 0 | 4.30 | 0.79 | 4 | Strongly agree |
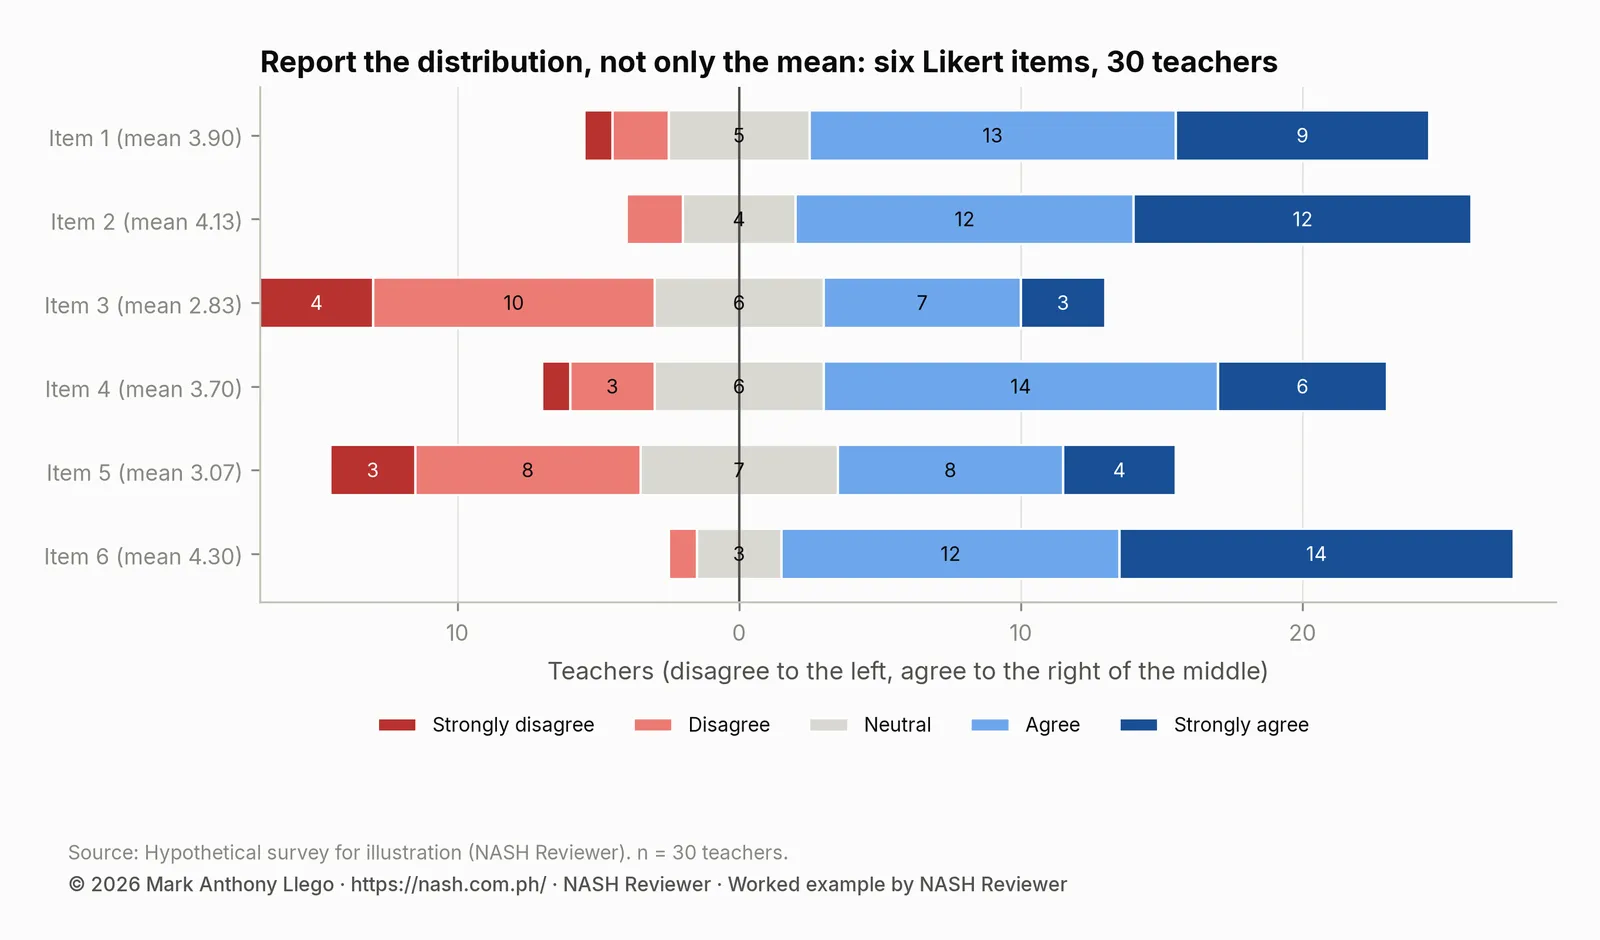
Three things in this table are easy to miss if you report only the means:
- Item 6 is “strongly agree” by the scale, but most teachers chose “agree” or less. Its mean of 4.30 falls in the top band, yet only 14 of the 30 teachers chose “strongly agree” and its median answer is 4, “agree”. The band describes the average, not the typical respondent.
- Item 3 is “neutral” because teachers split. Its mean of 2.83 sits in the neutral band, but only 6 of 30 teachers chose neutral: 14 disagreed or strongly disagreed and 10 agreed or strongly agreed. A neutral mean can hide a divided group, which is often the more useful finding.
- Item 5 runs the other way. Agreeing that the results are “hard to use” is a negative answer. Before combining it with the other items, reverse-score it: in Excel,
=6-B2turns 5 into 1 and 1 into 5. Its mean becomes 6 − 3.07 = 2.93, and the overall mean of the six items, with item 5 reversed, is 3.63, “agree”.
Likert data are ordered categories
The codes 1 to 5 are labels in order, not measured amounts: no one knows whether the step from “agree” to “strongly agree” is the same size as the step from “neutral” to “agree”. A mean treats them as equal steps. That is why careful reports:
- give the count or percentage of each answer for every item, or a chart like Figure 1;
- report the median (and the percentage who agree or strongly agree) beside the mean;
- use the mean mainly to rank items or to summarize a scale made of several items, where totals behave more like measured scores; and
- use rank-based tests, or tests on scale totals, rather than t-tests on single items.
The real CRLA results show the same issue with a different ordered scale. The CRLA places each learner at one of five reading levels:
| Level | Code | Learners | Share | Cumulative share |
|---|---|---|---|---|
| Low Emerging | 1 | 149,415 | 9.4% | 9.4% |
| High Emerging | 2 | 79,604 | 5.0% | 14.4% |
| Developing | 3 | 206,539 | 13.0% | 27.3% |
| Transitioning | 4 | 434,764 | 27.3% | 54.6% |
| At Grade Level | 5 | 724,286 | 45.4% | 100.0% |
Coded 1 to 5, the 1,594,608 Grade 1 learners assessed in Mother Tongue at the end of SY 2025-26 have a “weighted mean level” of 3.94. The median level is Transitioning, because the cumulative share first passes 50% there, and the mode is At Grade Level. None of these single numbers shows the finding that matters most: 14.4% of the learners were struggling readers, at Low or High Emerging. For ordered categories, the shares are the result; the mean is at most a summary.
How to report Likert results
In a table: for each item, the counts or percentages for each answer, the weighted mean, the standard deviation, the median and the interpretation, with the scale and its bands in a note.
In the text, lead with the pattern and the shares: Most teachers wanted more training on using the CRLA results (26 of 30 agreed or strongly agreed; M = 4.30, SD = 0.79). Teachers were divided on whether they had enough time to give the CRLA: 14 of 30 disagreed and 10 agreed (M = 2.83, SD = 1.23).
Common mistakes
- Reporting only the weighted mean and its label. Add the distribution and the median.
- Forgetting to reverse-score negative items. Combining them unreversed pulls the scale toward the middle and weakens its reliability.
- Using the toolkit’s list as printed. Use 1.00–1.80 for the lowest band and add 4.21–5.00 for the highest.
- Calling a mean in the neutral band “neutral” without looking. Check whether respondents were truly neutral or split.
- Using population formulas. For a sample of respondents, use
VAR.SandSTDEV.S. - Running t-tests on single Likert items with small groups. Use scale totals, or rank-based tests.
Frequently asked questions
How do you compute the weighted mean of a Likert scale?
Multiply each answer’s code by the number of respondents who chose it, add the products, and divide by the number of respondents. In Excel, with counts for codes 5 to 1 in B2 to F2: =SUMPRODUCT({5,4,3,2,1},B2:F2)/SUM(B2:F2). With each respondent’s answer in a column, use =AVERAGE.
What is the interpretation scale for a five-point Likert weighted mean?
The common scale divides the range of 4 into five bands of 0.80: 1.00–1.80 strongly disagree, 1.81–2.60 disagree, 2.61–3.40 neutral, 3.41–4.20 agree and 4.21–5.00 strongly agree. It is a convention, not an official DepEd standard; state the scale you use.
Is the Likert scale ordinal or interval?
Single Likert items are ordinal: the answers are in order, but the distances between them are unknown. Totals or averages of several items in a scale are often treated as approximately interval. Report each item’s distribution and median, and use the mean as a summary.
How do I reverse-score a negatively worded item in Excel?
On a five-point scale, use =6-B2 (one more than the highest code, minus the answer). On a four-point scale, use =5-B2. Reverse-score before computing totals, scale means or Cronbach’s alpha.
What is wrong with the Likert interval in the DepEd Action Research Toolkit?
The toolkit’s list of bands begins “From 1 to 0.80 represents (strongly disagree)”, which should read 1.00 to 1.80, and it leaves out the top band, 4.21 to 5.00, strongly agree. The method it describes, dividing the range of 4 by 5, is correct.
More on DepEd research
- Start here: DepEd Action Research Guide: From Topic to Report
- Validity, Reliability and Cronbach’s Alpha in Excel
- Pearson Correlation in Excel for Action Research
- Chi-Square Test in Excel for Action Research
- Paired and Independent t-Test in Excel for Action Research
- Action Research Sample Size: Slovin, Power and Sampling
- DepEd Action Research Report Format, With a Sample
- Related: How to Read a School’s CRLA Results Fairly, CRLA End-of-Year Results SY 2025-26: All 18 Regions
Sources
- Department of Education and the Basic Education Sector Transformation (BEST) Program. (2019). Action Research Toolkit: Teacher’s Guide, sections 4.2 (paper-and-pencil instruments) and 5.2 (quantitative analysis: descriptive statistics), with support from the Australian Government.
- Likert, R. (1932). A technique for the measurement of attitudes. Archives of Psychology, 22(140), 1–55.
- Jamieson, S. (2004). Likert scales: How to (ab)use them. Medical Education, 38(12), 1217–1218.
- CRLA reading levels: the EDCOM II early-childhood dashboard data, cleaned by NASH Reviewer, end of SY 2025-26 as of 10 May 2026.
Analysis and chart by Mark Anthony Llego for NASH Reviewer. NASH Reviewer is not affiliated with DepEd.