A public school’s Maintenance and Other Operating Expenses (MOOE) has been computed by two formulas since 2013. The Boncodin formula, used until fiscal year (FY) 2024, added up five things: a fixed amount, and an amount for every learner, every teacher, every classroom and every graduating learner. The normative formula, used in part for FY 2025 and in full for FY 2026, adds up two: a fixed amount for the school’s curricular offering, and an amount for every learner.
For an elementary school the Boncodin formula at its 2024 amounts was PHP 117,600, plus PHP 300 a learner, PHP 6,000 a teacher, PHP 4,500 a classroom and PHP 376 a graduating learner (Laguda et al., 2025, Tables 4 and 5). The normative formula in FY 2026 is PHP 580,573 plus PHP 1,110 a learner, the equation that reproduces DepEd’s School MOOE allocation list for FY 2026. An elementary school of 300 learners, 44 of them in Grade 6, with 11 teachers and 7 classrooms comes to PHP 322,000 under the first and PHP 914,000 under the second.
The change did two things. It raised nearly every school’s amount, and it ended the payment for teachers and classrooms, which had given a well-provided school more than a crowded school with the same learners. What the money may be spent on is the same under both: DepEd Order No. 008, s. 2019, covered in the guide to school MOOE.
Key findings
- Five parts became two. The Boncodin formula counted learners, teachers, classrooms and graduating learners on top of a fixed amount. The normative formula counts learners on top of a fixed amount set by the school’s curricular offering. An elementary school’s fixed amount went from PHP 117,600 to PHP 580,573, about five times as much, and its amount for each learner from PHP 300 to PHP 1,110 (DO 008, s. 2019, Enclosure, Sec. I, item 1; Laguda et al., 2025, Tables 4 and 5; DepEd, School MOOE Allocation, FY 2026).
- A teacher was worth PHP 6,000 and a classroom PHP 4,500. Those were the elementary amounts of the old formula as of 2024; in a junior high school, PHP 9,600 and PHP 7,200. Under the normative formula both are worth nothing (Laguda et al., 2025, Table 5).
- The old amounts rose unevenly. The World Bank’s table of the formula, from DepEd, gives an elementary school a fixed PHP 40,000 for 2013 to 2015 and PHP 50,000 for 2016; by 2024 it was PHP 117,600. The amount for each learner in the same sources is PHP 200, PHP 250 and PHP 300 (World Bank, 2016, Table 1; Laguda et al., 2025, Tables 4 and 5).
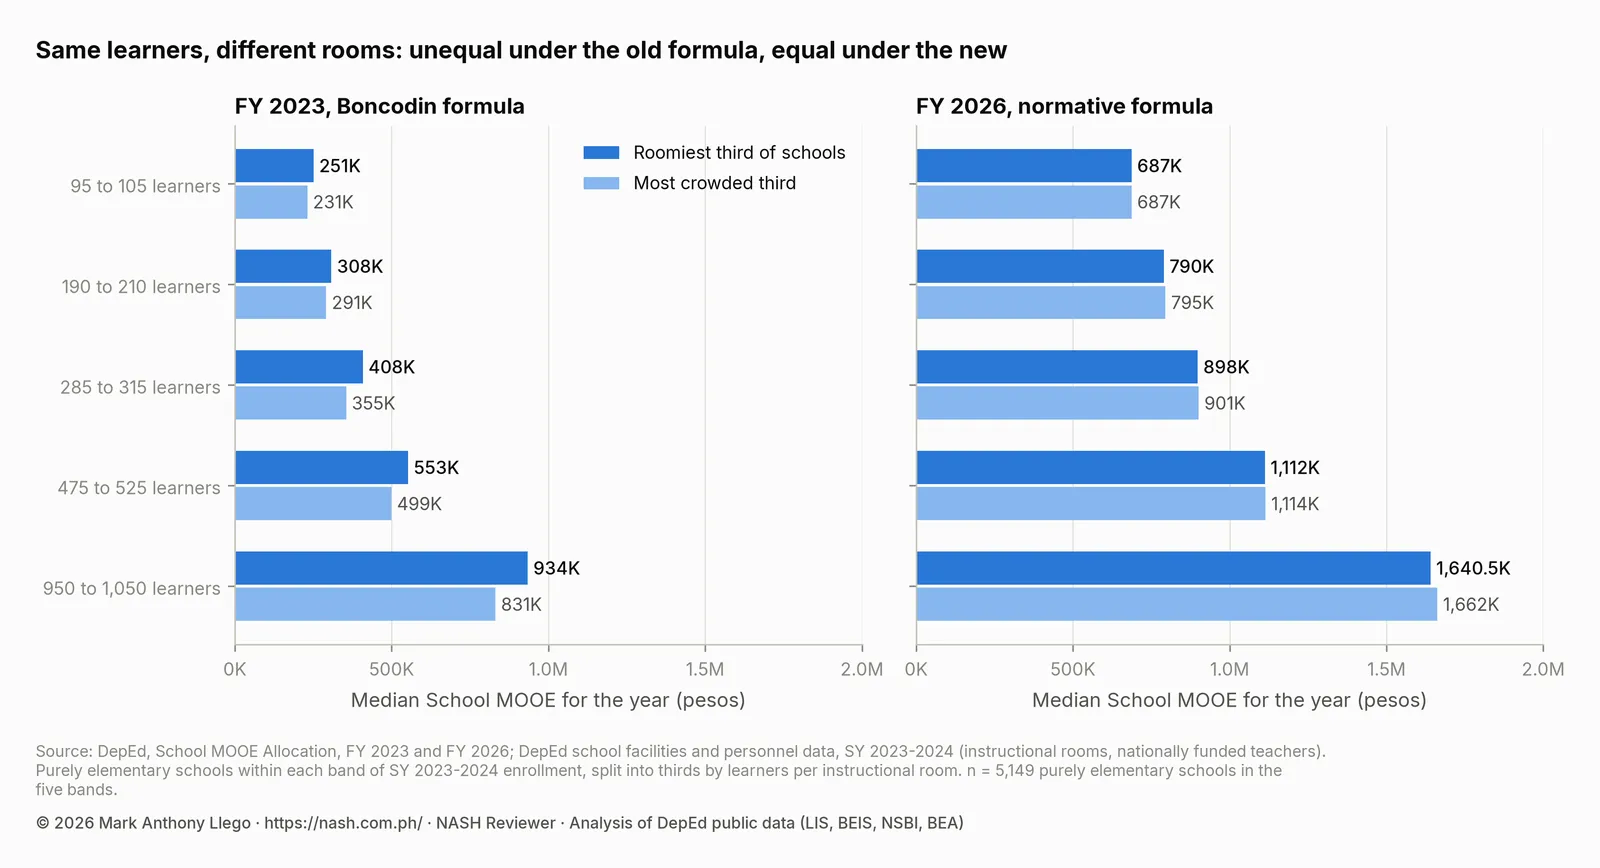
- Same learners, different rooms, different budget. In DepEd’s FY 2023 list, among elementary schools of about 300 learners, the third with the most room received a median PHP 408,000 and the most crowded third PHP 355,000. In the FY 2026 list the two medians are PHP 898,000 and PHP 901,000 (DepEd, School MOOE Allocation, FY 2023 and FY 2026, with DepEd school data for SY 2023-2024).
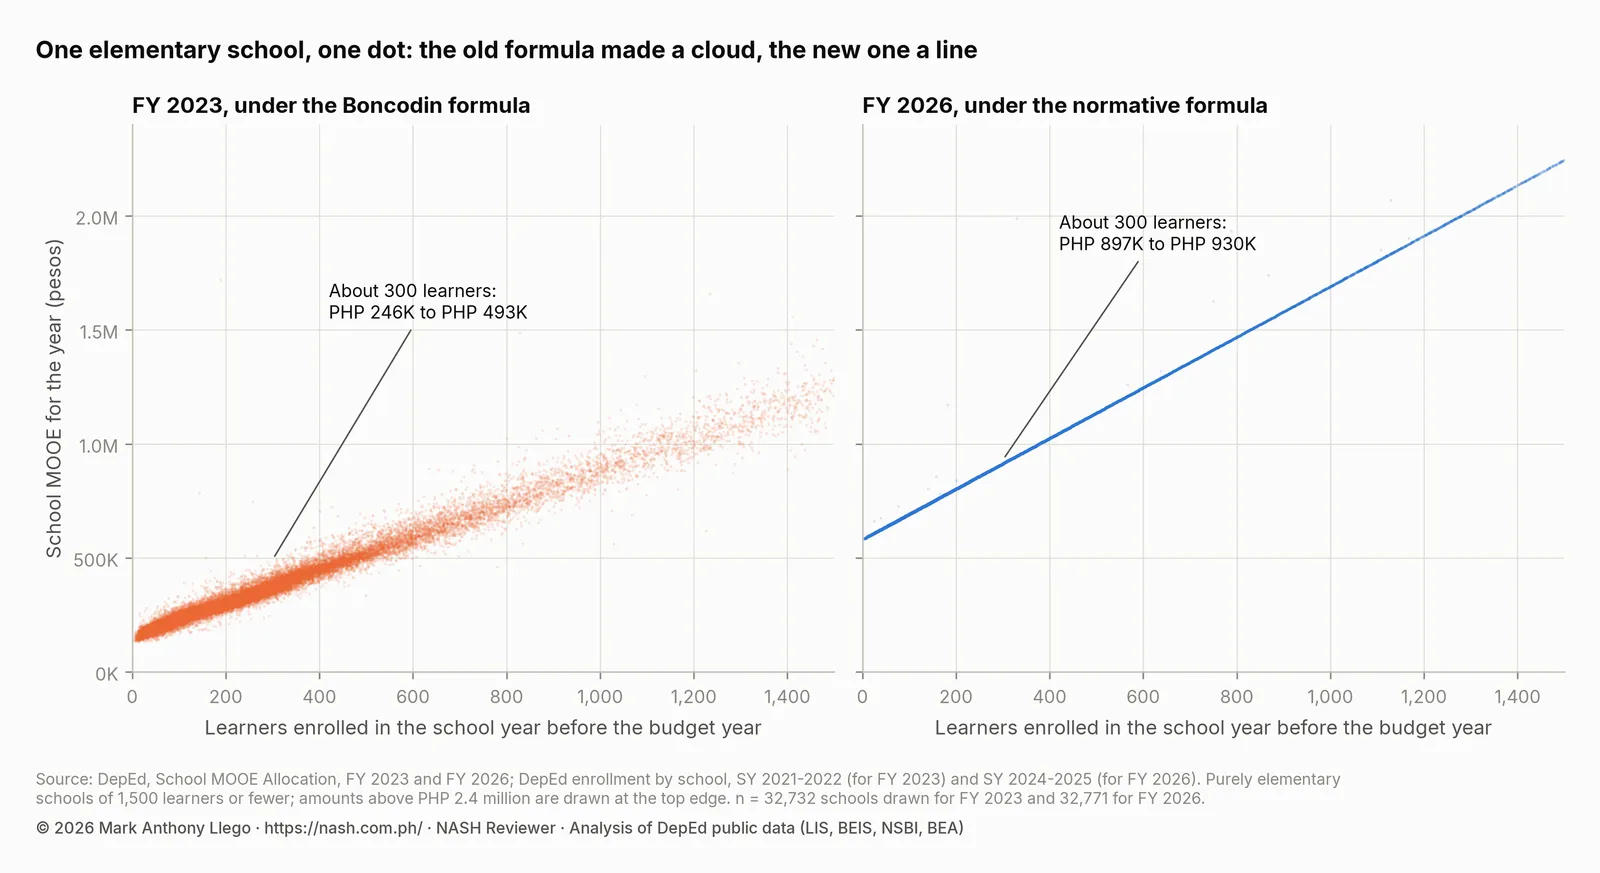
- About 300 learners meant anything from PHP 246,000 to PHP 493,000. That was the range among elementary schools of 285 to 315 learners in FY 2023. In FY 2026 it is PHP 897,000 to PHP 930,000, and all of it follows the learner count (DepEd, School MOOE Allocation, FY 2023 and FY 2026, with DepEd enrollment data for SY 2021-2022 and SY 2024-2025).
- Crowded schools still receive less per learner. Elementary schools with more than 45 learners to a room averaged PHP 1,451 per learner in FY 2024 and PHP 3,253 in FY 2026; those with 25 or fewer averaged PHP 3,563 and PHP 8,430. The gap did not narrow, because crowded schools are large schools and the fixed amount favors small ones (DepEd, School MOOE Allocation, FY 2024 and FY 2026, with DepEd school data for SY 2023-2024).
- Neither formula counts need. Poverty, remoteness and the income class of the local government are in neither. EDCOM II’s National Education Plan asks DepEd to add equity measures, among them the income class of the local government (National Education Plan, Recommendation 6.2.1, p. 97).
The two formulas side by side
The Boncodin formula, as the Second Congressional Commission on Education (EDCOM II) prints it (Year One Report, p. 297):
School MOOE = Fixed Amount + (Enrollment Cost × No. of Learners Enrolled) + (Teachers Cost × No. of Teachers) + (Classroom Cost × No. of Classrooms) + (Graduating Learners Cost × No. of Graduating Learners)
The normative formula, as the Department of Education (DepEd) states it on its official Facebook page, where Bilang ng Mag-aaral is the number of learners:
MOOE Budget = Fixed Coefficient + (Bilang ng Mag-aaral × Enrollment Coefficient)
| Boncodin formula | Normative formula | |
|---|---|---|
| Budgets it set | FY 2013 to FY 2024 | FY 2025 in part, FY 2026 in full |
| Parts | Five | Two |
| Fixed amount | One for each level: elementary, junior high, senior high | One for each of six curricular offerings |
| What it counts in a school | Learners, teachers, classrooms, graduating learners | Learners, by level |
| Data a school’s amount rests on | Enrollment, teachers, classrooms and graduates in DepEd’s school information system | Enrollment of the school year that ended before the budget year |
| Basis of the amounts | A per-learner budget extended in 2013 with new factors; the reasons for later increases were not documented | DepEd’s minimum service standards, costed from a survey of over 10,000 schools |
| Who developed it | A team led by former Budget Secretary Emilia T. Boncodin, in a study of 2008; adopted by DepEd and the Department of Budget and Management (DBM) | The Asian Development Bank (ADB) with DepEd; approved by the DBM |
| What it leaves out | Poverty, remoteness, the income class of the local government | The same |
The sources for the rows are DO 008, s. 2019 (Enclosure, Sec. I, item 1), DepEd’s Financial Management Operations Manual of 2016 (p. 128), the World Bank’s project report of 2013 (Annex 7, p. 62), and the EDCOM II Year Two Report (pp. 356-358) and Final Report (pp. 36 and 363). Where the Boncodin formula came from gives its history.
The amounts, for a school with one level:
| Part of the formula | Elementary: Boncodin, 2024 | Elementary: normative, FY 2026 | Junior high: Boncodin, 2024 | Junior high: normative, FY 2026 | Senior high: Boncodin, 2024 | Senior high: normative, FY 2026 |
|---|---|---|---|---|---|---|
| Fixed amount | PHP 117,600 | PHP 580,573 | PHP 172,800 | PHP 580,055 | PHP 172,800 | PHP 680,566 |
| Every learner | PHP 300 | PHP 1,110 | PHP 480 | PHP 1,715 | PHP 2,076 | PHP 1,797 |
| Every teacher | PHP 6,000 | not counted | PHP 9,600 | not counted | not counted | |
| Every classroom | PHP 4,500 | not counted | PHP 7,200 | not counted | not counted | |
| Every graduating learner | PHP 376 | not counted | PHP 300 | not counted | not counted |
The Boncodin columns are from Laguda et al. (2025, p. 37, Tables 4 and 5); the EDCOM II Year Two Report prints the same fixed, learner, teacher and classroom amounts (Table 8, p. 357). The normative columns are the equations that reproduce DepEd’s FY 2026 list for schools with one level. Schools with two or three levels have their own equations, set out in New MOOE Normative Formula: How to Compute School MOOE with a calculator.
A stand-alone senior high school is the one case where the amount per learner fell, from PHP 2,076 to PHP 1,797, while its fixed amount nearly quadrupled. Set against the old formula at its 2024 amounts, the new equation gives more to a senior high school of fewer than 1,820 learners and less to a larger one. Where an equation gave a school less than it already had, DepEd’s FY 2026 list kept the level at its FY 2025 amount plus 3%: that floor set the amount of 115 of the 261 stand-alone senior high schools.
What one school receives under each formula
The model works out one school’s MOOE under each formula. Change the teachers or the classrooms and only the upper bar moves. Change the learners and both do. The old formula’s amounts can be set to any of the three dates they are documented for: 2013 to 2015, 2016 and 2024.
Model
One school under both formulas
Set what the school has. The old formula counts all four numbers; the new one counts only the learners. The old formula's amounts are on record at three dates: pick one.
Boncodin formula, 2024 amountsPHP 322,000
Normative formula, FY 2026PHP 914,000
Change a number to see which amount moves.
- Fixed amountBoncodin117,600the same for every school of the levelNormative580,573the same for every school of the level
- LearnersBoncodin90,000300 × PHP 300Normative333,000300 × PHP 1,110
- TeachersBoncodin66,00011 × PHP 6,000NormativeNot counted
- ClassroomsBoncodin31,5007 × PHP 4,500NormativeNot counted
- Graduating learnersBoncodin16,54444 × PHP 376NormativeNot counted
- Total to the nearest PHP 1,000BoncodinPHP 322,000NormativePHP 914,000
- Normative over Boncodin
- 2.8 times
- PHP 592,000 more a year
- For each learner
- PHP 3,047
- a year, against PHP 1,073 under the old formula
- No longer counted
- 35%
- of the old formula amount came from teachers, classrooms and graduating learners:PHP 114,044
| Boncodin | Normative | |
|---|---|---|
| One more learner | PHP 200, or PHP 450 in Grade 6 | PHP 1,110 |
| One more teacher | PHP 4,000 | Nothing |
| One more classroom | PHP 3,000 | Nothing |
| Boncodin | Normative | |
|---|---|---|
| One more learner | PHP 250, or PHP 563 in Grade 6 | PHP 1,110 |
| One more teacher | PHP 5,000 | Nothing |
| One more classroom | PHP 3,750 | Nothing |
| Boncodin | Normative | |
|---|---|---|
| One more learner | PHP 300, or PHP 676 in Grade 6 | PHP 1,110 |
| One more teacher | PHP 6,000 | Nothing |
| One more classroom | PHP 4,500 | Nothing |
| Boncodin | Normative | |
|---|---|---|
| One more learner | PHP 400, or PHP 650 in Grade 10 | PHP 1,715 |
| One more teacher | PHP 8,000 | Nothing |
| One more classroom | PHP 6,000 | Nothing |
| Boncodin | Normative | |
|---|---|---|
| One more learner | PHP 480, or PHP 780 in Grade 10 | PHP 1,715 |
| One more teacher | PHP 9,600 | Nothing |
| One more classroom | PHP 7,200 | Nothing |
| Boncodin | Normative | |
|---|---|---|
| One more learner | PHP 480, or PHP 780 in Grade 10 | PHP 1,715 |
| One more teacher | PHP 9,600 | Nothing |
| One more classroom | PHP 7,200 | Nothing |
Writes the ledger one line at a time, the old formula first.
World Bank (2016), Philippines Education Note No. 6, Table 1; Laguda et al. (2025), Tables 4 and 5; EDCOM II Year Two Report, Table 8; DepEd, School MOOE Allocation, FY 2024 and FY 2026; DepEd school data, SY 2023-2024
Four schools from the model, in two pairs, with the old formula at its 2024 amounts. Each pair has the same learners and the same graduating learners; one school has the rooms and teachers of the roomiest third of such schools, the other those of the most crowded third.
| Elementary school | Teachers | Classrooms | Graduating learners | Boncodin formula, 2024 amounts | Normative formula, FY 2026 | Normative over Boncodin |
|---|---|---|---|---|---|---|
| 300 learners, roomy | 13 | 14 | 44 | PHP 365,000 | PHP 914,000 | 2.5 times |
| 300 learners, crowded | 11 | 7 | 44 | PHP 322,000 | PHP 914,000 | 2.8 times |
| 1,000 learners, roomy | 36 | 34 | 147 | PHP 842,000 | PHP 1,691,000 | 2.0 times |
| 1,000 learners, crowded | 29 | 18 | 147 | PHP 728,000 | PHP 1,691,000 | 2.3 times |
Under the old formula the roomy school of 300 learners is ahead by PHP 43,500 a year, the worth of two teachers and seven classrooms, and the roomy school of 1,000 learners by PHP 114,000. Under the new formula each pair receives the same amount. In the school of 1,000 learners with 34 classrooms, half of the old formula’s amount came from teachers, classrooms and graduating learners.
The old formula’s amounts show how it worked. They are not what a school was listed for in a given year. For the median elementary school the FY 2023 list is 11% above the formula at these amounts, and the FY 2024 list 33% above, counting each school’s nationally funded teachers and instructional rooms of SY 2023-2024. The FY 2024 list also gave every elementary school at least PHP 282,000 and raised FY 2023 amounts by a rate set for each city or municipality, as School MOOE Allocation by School, FY 2020 to FY 2026 shows.
Where the Boncodin formula came from
Before 2013 a school’s MOOE followed its enrollment and nothing else. “Previously, the school MOOE budget was computed solely based on enrollment given a per capita cost” (DepEd Order No. 13, s. 2016, Enclosure, Sec. I, item 1). For FY 2007 the rate was “P209 per pupil for elementary and P507 per student for secondary” (DepEd Order No. 24, s. 2007, Enclosure, par. 4.2).
The formula that replaced the per capita rate began as a study. In 2008 Emilia T. Boncodin, a former Secretary of Budget and Management, and Wilfredo G. Nuqui wrote Equitable Allocation of DepEd MOOE for a DepEd reform program financed by the Australian government (Manasan, Celestino and Cuenca, 2011, pp. 4 and 44). DepEd’s budget strategy of 2010 set as a policy the “adoption of the new formula that rationalizes the grant of MOOE to DepEd offices and schools” (DepEd Order No. 25, s. 2010, par. 2(g)). DepEd’s own account of the FY 2013 budget, summarized in a World Bank project report, credits the formula to “the team of former Secretary Emilia Boncodin” (World Bank, 2013, Annex 7, p. 62).
DepEd’s account of that first budget describes a “partial application” of the formula, with a fixed amount of PhP20,000 a year for elementary schools and PhP40,000 for high schools (World Bank, 2013, Annex 7, p. 62).
DepEd announced the change on March 14, 2013. Secretary Armin A. Luistro said DepEd and the DBM “both agreed to adopt a refined formula for setting the MOOE budgets of public schools, which takes into account not only the number of students in a school, but also the number of classrooms and teachers”. School MOOE rose by 46% that year, and by 68% for elementary schools (DepEd press release, March 14, 2013).
DepEd’s orders on school MOOE call it “the new school MOOE formula” and do not print its amounts (DO 13, s. 2016; DO 008, s. 2019). The name appears in DepEd’s Financial Management Operations Manual of 2016: the “latest formula used was referred to as the Boncodin formula with a fixed component, and variable factors” for each item of school data (p. 128).
The amounts at three dates
| Part of the formula | Elementary, 2013 to 2015 | Elementary, 2016 | Elementary, 2024 | High school, 2013 to 2015 | High school, 2016 | Junior high school, 2024 |
|---|---|---|---|---|---|---|
| Fixed amount | PHP 40,000 | PHP 50,000 | PHP 117,600 | PHP 80,000 | PHP 96,000 | PHP 172,800 |
| Every learner | PHP 200 | PHP 250 | PHP 300 | PHP 400 | PHP 480 | PHP 480 |
| Every teacher | PHP 4,000 | PHP 5,000 | PHP 6,000 | PHP 8,000 | PHP 9,600 | PHP 9,600 |
| Every classroom | PHP 3,000 | PHP 3,750 | PHP 4,500 | PHP 6,000 | PHP 7,200 | PHP 7,200 |
| Every graduating learner | PHP 250 | PHP 313 | PHP 376 | PHP 250 | PHP 300 | PHP 300 |
The 2013 to 2015 and 2016 columns are from the World Bank’s school finance study with DepEd, which has them from DepEd and heads both secondary columns “High Schools” (World Bank, 2016, Table 1, p. 4). The 2024 columns are from Laguda et al. (2025, Tables 4 and 5). DepEd’s orders do not print the amounts of any year, so the three sets are the ones on record, not a count of every change.
In the World Bank’s 2016 column every elementary amount is 25% higher than in its 2013 to 2015 column, and every high school amount 20% higher. The later increases were uneven. Between the 2016 column and the 2024 tables the elementary fixed amount more than doubled, from PHP 50,000 to PHP 117,600, while the other elementary amounts rose by 20%. The junior high fixed amount rose by 80%, and the junior high amounts for learners, teachers, classrooms and graduating learners did not rise at all. This is the pattern the ADB questioned in 2024: an adjustment for inflation “should be to increase all the coefficients by the same factor instead of the different increases adopted by DepEd” (EDCOM II Year Two Report, p. 357).
One amount matches a spending rule. In 2014 the rules on spending MOOE let a school pay for graduation rites at a cost “not to exceed” PHP 250 “per graduating student” (DepEd Order No. 12, s. 2014, Enclosure, Sec. 4, item e). The formula’s amount for a graduating learner was also PHP 250. No issuance says that one was taken from the other.
What the formula counted
A schools division’s instructions for FY 2017 budget proposals show what was counted in practice. Classrooms were instructional rooms of standard size as of December 31, “excluding condemned classrooms”. Teachers were those “Actually Working” as of the same date. Learners were the enrollment at the beginning of the school year, and graduating learners the enrollment in Grade 6 or Grade 10 (Division of Misamis Oriental, memorandum of February 5, 2016). The memorandum, written for FY 2017, still works its example out at the 2013 amounts: 250 learners, 6 teachers, 5 classrooms and 8 graduating pupils come to PHP 131,000.
Senior high and science high schools
Senior high school received MOOE from June 2016, when Grade 11 opened. Its budget “was computed based on” a “per capita cost derived from the rationalized formula for school MOOE applied to Junior High Schools in 2016” and on projected enrollment (DepEd Order No. 31, s. 2016, Enclosure, item 8). By 2024 a stand-alone senior high school had a fixed PHP 172,800 and PHP 2,076 a learner.
A regional science high school is funded apart, at PHP 1,150,000 plus PHP 2,000 a learner in the 2024 tables. Those are the amounts of the subsidy that DepEd Order No. 5, s. 2011 granted to each such school. From 2016, financial assistance for special curricular programs was no longer released separately and became “part of the regular school MOOE budget” (DO 13, s. 2016, Enclosure, Sec. I, item 1).
What the lists added to the formula
A school’s listed amount was not always the formula’s. The World Bank found in 2016 that “the amount of MOOE funds that is actually allocated to each school is frequently different to the amount prescribed by the formula”: in 2013 the elementary allocations differed from it by about 4% of the average allocation. It gave two possible reasons, “confusion over which types of classrooms are included in the formula” and DepEd’s “no diminution policy”, which “prevents a school’s MOOE funds in any given year from being less than the previous year’s level” (World Bank, 2016, pp. 3-4). The policy did not hold in every year: 94% of schools received less in FY 2021 than in FY 2020, and 32% less in FY 2022 than in FY 2021 (DepEd, School MOOE Allocation, FY 2020 to FY 2022).
The same study found that few people knew the formula. Over half of school principals said they were aware of it, but “fewer than one in ten know the formula’s components and hardly any know the funding associated with each component” (p. 4).
A normative formula was planned by 2016
The normative formula of FY 2025 was not the first of its kind. A costing study by the World Bank with DepEd “reviewed existing DepEd service standards and norms for elementary and high schools” and concluded that “overall levels of elementary and high school MOOE funding will need to more than double if existing service standards are to be met” (World Bank, 2016, p. 3). DepEd’s manual of that year said a “newly developed formula that considers costs, norms and standards”, the “Normative Funding Formula”, “will replace the current one” (Financial Management Operations Manual, p. 128). The guidelines for the FY 2018 budget proposal had school MOOE “computed based on the revised Boncodin formula and/or the Normative Financing Formula” (DepEd Order No. 11, s. 2017, Sec. IV.E.1.i).
The Boncodin formula stayed. DO 008, s. 2019 still describes only “the new school MOOE formula starting 2013”, and the normative formula that took its place came from the ADB’s work of 2024.
What the old formula paid for: teachers and classrooms
A teacher and a classroom each brought money, so of two schools with the same learners, the one with more of both received more. The ADB’s review of the formula put it this way: the formula “has a built-in bias against congested schools” (EDCOM II Year Two Report, p. 357). A school short of classrooms holds larger classes in the rooms it has. It is the school the formula paid least for its learners.
DepEd’s own lists show the effect. Purely elementary schools are about three in four of all public schools. The table takes those with nearly the same enrollment in SY 2023-2024 and divides each group into thirds by learners per instructional room. It sets the FY 2023 list beside the FY 2026 list. FY 2023 is used because the FY 2024 list also raised schools by a different rate in each city or municipality, which the formula did not do.
| Elementary schools with | Roomiest third: FY 2023 | Most crowded third: FY 2023 | Roomiest third: FY 2026 | Most crowded third: FY 2026 |
|---|---|---|---|---|
| 95 to 105 learners | PHP 251,000 | PHP 231,000 | PHP 687,000 | PHP 687,000 |
| 190 to 210 learners | PHP 308,000 | PHP 291,000 | PHP 790,000 | PHP 795,000 |
| 285 to 315 learners | PHP 408,000 | PHP 355,000 | PHP 898,000 | PHP 901,000 |
| 475 to 525 learners | PHP 553,000 | PHP 499,000 | PHP 1,112,000 | PHP 1,114,000 |
| 950 to 1,050 learners | PHP 934,000 | PHP 831,000 | PHP 1,640,500 | PHP 1,662,000 |
Each amount is the median school’s. Among schools of 285 to 315 learners, the roomiest third had a median of 14 rooms and 13 teachers, or 22 learners to a room, and the most crowded third 7 rooms and 11 teachers, or 41 learners to a room. In FY 2023 the roomiest third received PHP 53,000 more, or 15%. Among schools of about 1,000 learners the difference was PHP 103,000, or 12%. In FY 2026 the small differences that remain follow the learner count: the crowded schools in each group had slightly more learners in SY 2024-2025.
The FY 2024 list widened these gaps, to 17% at about 300 learners (PHP 467,000 against PHP 399,000) and 19% at about 1,000. Part of that widening is not the formula’s. The FY 2024 list raised FY 2023 amounts by a rate for each city or municipality, and among schools of about 300 learners the roomiest third was raised by 19% and the most crowded third by 11%, at the median. Does School MOOE Reach Poor and Last Mile Schools? sets out those rates.
Across the 34,039 purely elementary schools that are on the lists of FY 2023, FY 2024 and FY 2026 and have their rooms and teachers on record, the FY 2023 amounts rise with teachers and rooms as well as learners. Setting each school’s amount against its learners, its nationally funded teachers, its instructional rooms and its Grade 6 learners, a teacher goes with about PHP 6,400 more and a room with about PHP 2,400 more, for the same learners. The formula’s own amounts in 2024 were PHP 6,000 and PHP 4,500. The same comparison on the FY 2026 list finds almost nothing for either: enrollment alone accounts for 99.95% of the differences among schools.
The result is visible when every school is drawn. In FY 2023, elementary schools of 285 to 315 learners received 149 different amounts, from PHP 246,000 to PHP 493,000. In FY 2026, schools of that size received 31 different amounts, from PHP 897,000 to PHP 930,000, one for each learner count from 285 to 315.
What changed for crowded schools, and what did not
The normative formula stopped paying a school less for being short of rooms. It did not start paying a crowded school more.
The ADB’s evidence for the bias was the average MOOE per learner by learners per classroom: PHP 3,543 per elementary learner in schools with 25 or fewer learners to a classroom, falling to PHP 1,437 in schools with more than 45 (EDCOM II Year Two Report, Figure 18, p. 357). DepEd’s FY 2024 list gives nearly the same figures, and the FY 2026 list can be measured the same way.
| Learners per instructional room, SY 2023-2024 | Elementary schools | Median school’s enrollment | Mean MOOE per learner, FY 2024 | Mean MOOE per learner, FY 2026 | Change in the group’s total, FY 2024 to FY 2026 |
|---|---|---|---|---|---|
| 25 or fewer | 16,824 | 122 | PHP 3,563 | PHP 8,430 | +112% |
| Over 25 to 35 | 9,739 | 280 | PHP 1,692 | PHP 3,799 | +93% |
| Over 35 to 45 | 3,669 | 391 | PHP 1,511 | PHP 3,349 | +87% |
| Over 45 | 3,853 | 432 | PHP 1,451 | PHP 3,253 | +84% |
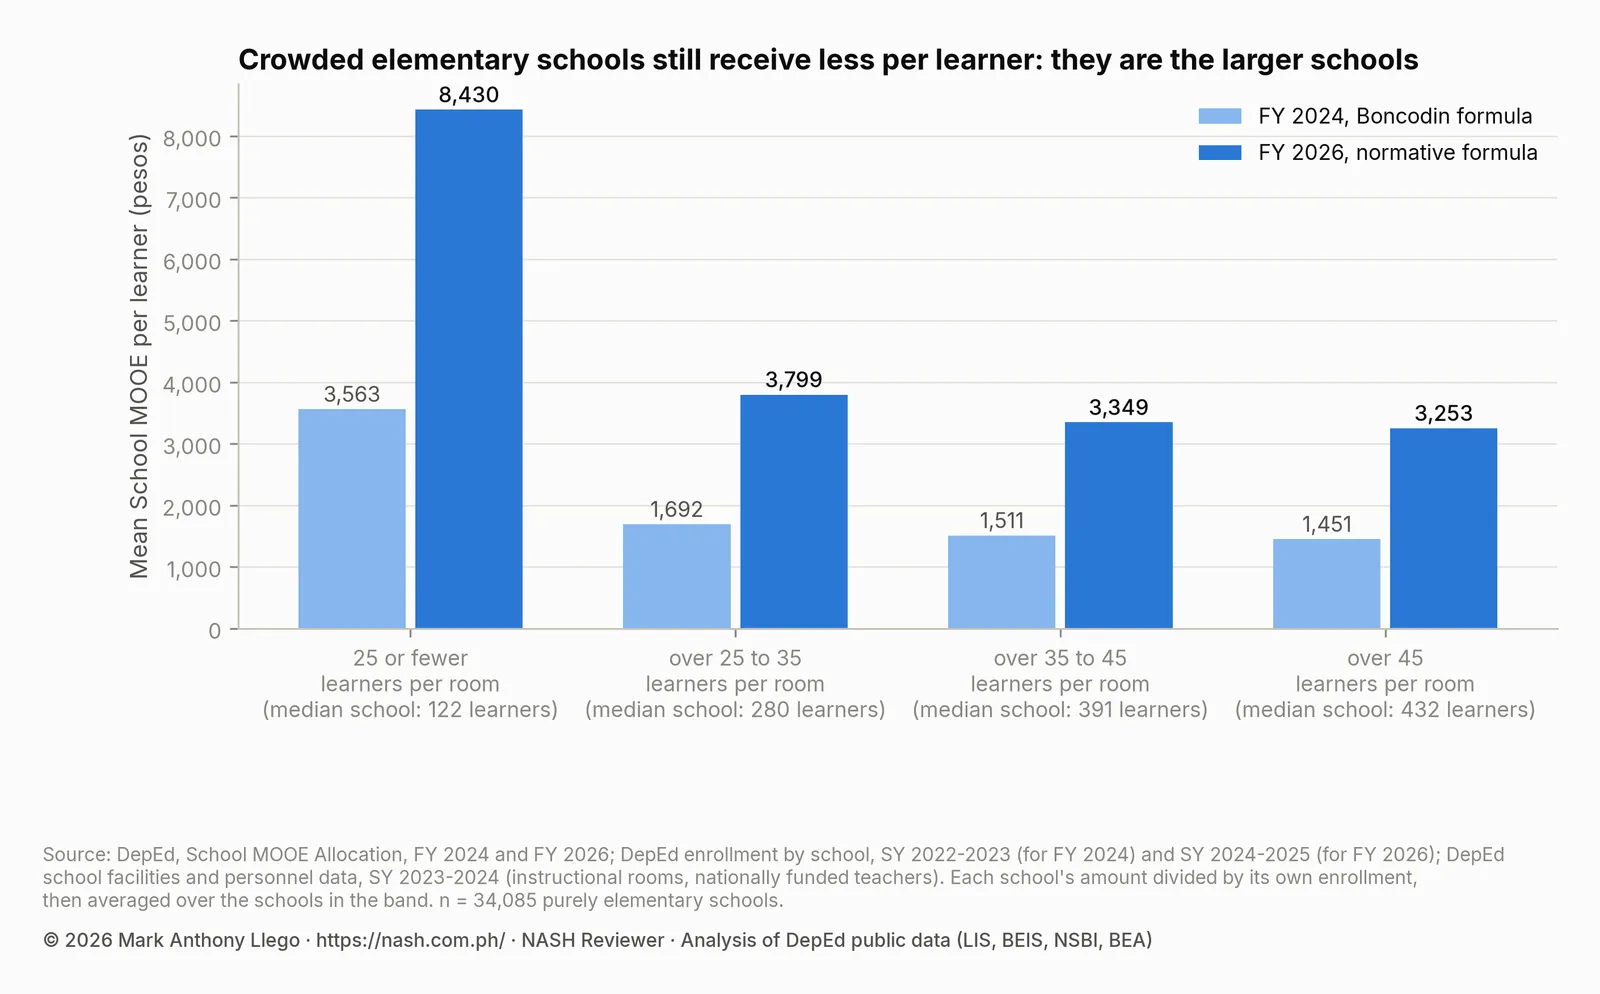
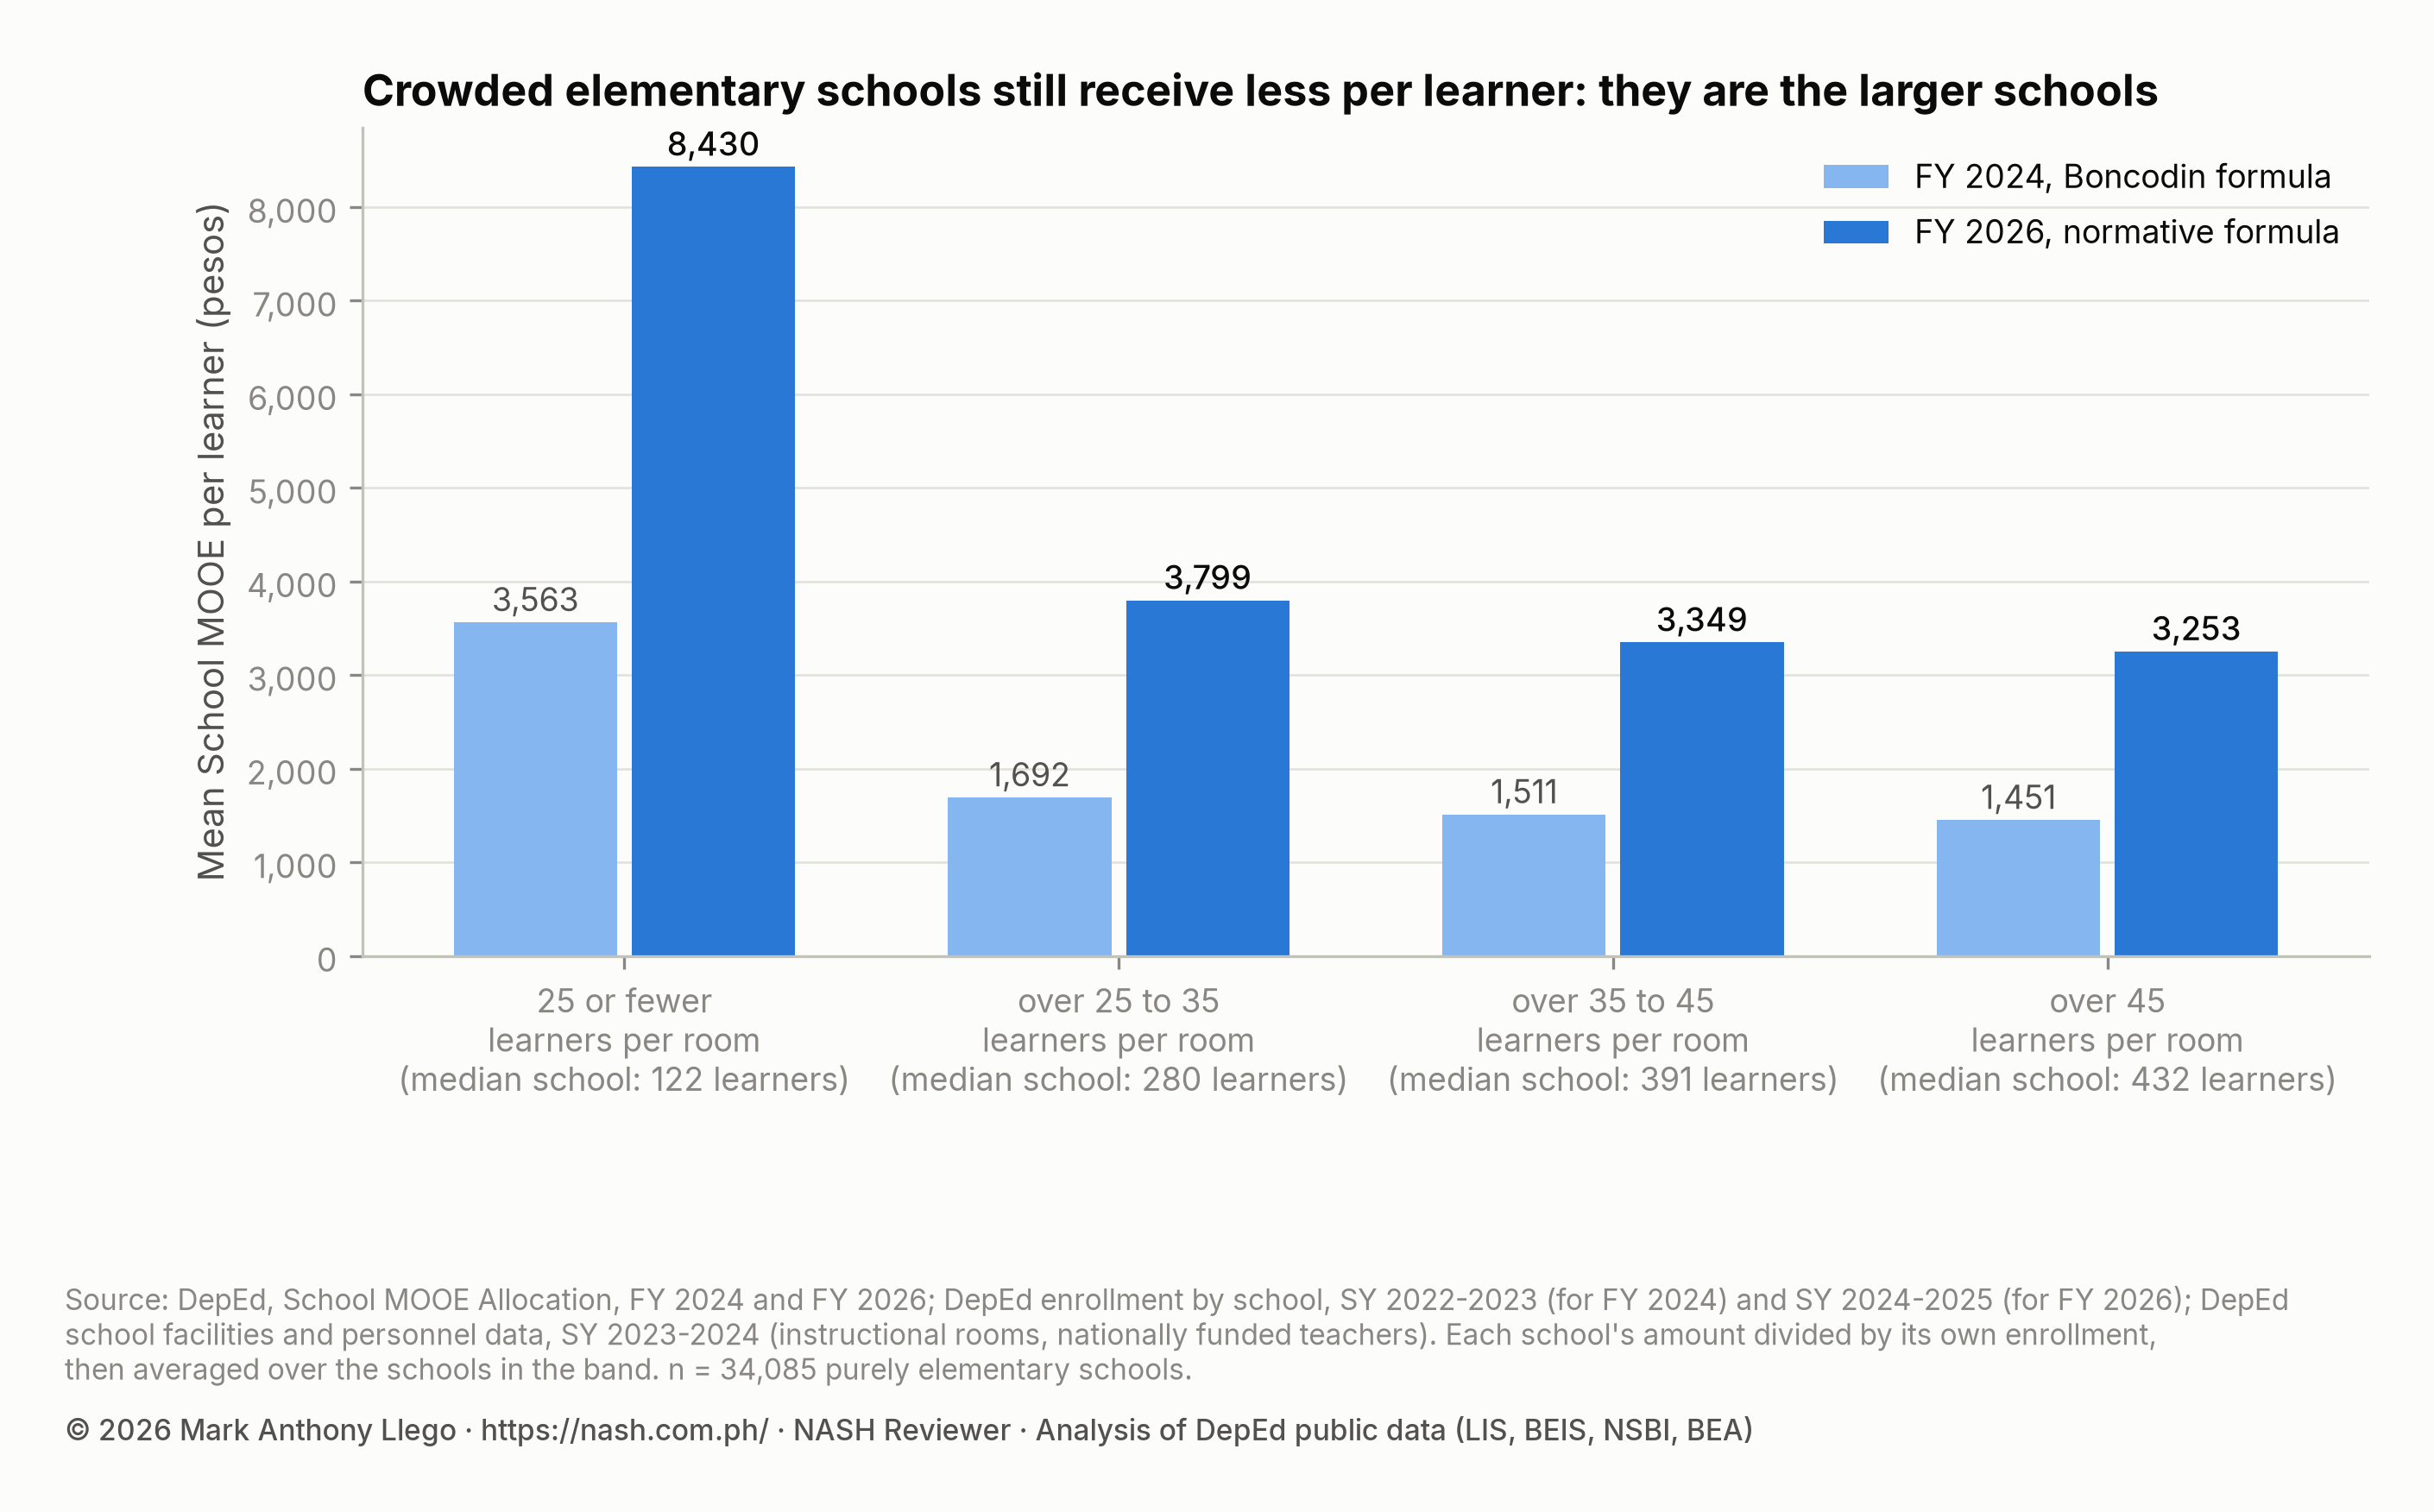
The least crowded schools received 2.5 times as much per learner as the most crowded in FY 2024, and 2.6 times as much in FY 2026. The pattern the ADB found is still in the list.
The reason is size. The schools with 25 or fewer learners to a room are small: their median enrollment is 122. The schools with more than 45 to a room have a median of 432. A fixed amount spread over 122 learners is far more per learner than the same amount spread over 432, under either formula. The new formula’s fixed amount is about five times the old one, so small schools gained the most. The total for the least crowded group rose 112%, and for the most crowded group 84%.
| Elementary schools with, in SY 2023-2024 | Schools | Median school’s MOOE, FY 2024 | Median school’s MOOE, FY 2026 | Median of the schools’ increases |
|---|---|---|---|---|
| 100 learners or fewer | 7,560 | PHP 282,000 | PHP 651,000 | +126% |
| 101 to 200 learners | 10,444 | PHP 315,000 | PHP 735,000 | +133% |
| 201 to 300 learners | 5,423 | PHP 379,000 | PHP 838,000 | +122% |
| 301 to 500 learners | 4,899 | PHP 494,000 | PHP 984,000 | +102% |
| 501 to 1,000 learners | 3,365 | PHP 723,000 | PHP 1,284,000 | +82% |
| Over 1,000 learners | 2,394 | PHP 1,429,500 | PHP 2,299,000 | +64% |
The last column is the median of each school’s own increase, so it is not the change from one median to the other.
Two statements are therefore both true. Between two schools of the same size, the crowded one no longer receives less. Across all schools, the crowded ones are the large ones, and large schools gained least from the change. A school head of a large, crowded school has more money than in FY 2024 and the same share of it per learner as a roomy school of its size, and still far less per learner than a small school. The classroom posts on this blog, beginning with the classroom shortage in 2023 and class shifting in crowded schools, cover the shortage itself, which MOOE does not pay to fix.
Why the Boncodin formula was replaced
The EDCOM II Year Two Report gives three reasons (pp. 356-357).
- It was out of date. The formula “predates the K–12 reform program and is based on service standards and cost estimates that have since become outdated”.
- Its increases were not explained. DepEd raised the fixed and variable amounts over the years, “but the justification for setting these levels was not documented”. The ADB’s review found “a lack of clarity in the logic of increases adopted over time”, and held that an adjustment for inflation should raise every amount by the same factor.
- It worked against crowded schools, as the section above shows. The World Bank had seen the same in 2016: schools in urban areas, “where student-classroom and student-teacher ratios are higher”, received “lower per-student MOOE funding” (World Bank, 2016, p. 9).
The amounts were also too small for what schools pay. School heads from Iloilo province and Davao City told EDCOM II that 30% to 70% of their school MOOE went to utility bills (Year One Report, p. 297).
The replacement was built the other way round. The ADB team “first developed a formula for a normative school MOOE, which is computed based on the current minimum service standards of DepEd”, with 27 variables that drive the cost of running a school, informed by “a survey of over 10,000 schools”. Regression then reduced it to equations “with a fixed cost coefficient and a variable cost coefficient”, one set for each curricular offering (Year Two Report, pp. 356-357). The teachers and classrooms a school happens to have are not among the things it counts. What the formula funds is the cost of running a school of a given offering and enrollment at the standard, whatever the school has now.
The DBM approved it in two steps: “85% on fixed cost and 50% on enrollment cost” for FY 2025, and “a full normative formula with 100% increases for both the fixed and enrollment costs” for the FY 2026 budget proposal (EDCOM II Final Report, p. 363). The Final Report’s heading for the delay is its own summary: eleven years “had passed before the Boncodin formula of 2013 for School MOOE was updated” (p. 362).
The totals moved with it. DepEd’s FY 2024 list, the last under the old formula, comes to PHP 36.20 billion for 45,071 schools. Its FY 2026 list comes to PHP 59.35 billion for 45,801 schools, 63.9% more.
What neither formula counts
Both formulas treat two schools with the same counts alike wherever they are. The Boncodin formula distributed funds “without taking into account needs-based parameters (i.e., LGU income classification, special curricular program offerings, school remoteness)” (EDCOM II Final Report, p. 36). The normative formula counts learners and the school’s offering, and nothing about need either.
The Year One Report saw the old formula as hard on small schools and on schools with costs of their own: it “puts small-sized schools and schools with unique contexts at a disadvantage”, such as schools with computer laboratories or technical-vocational-livelihood workshops, whose power bills the formula did not see (p. 297). The new formula answered the first of these with its larger fixed amount. It has not answered the second: a school with energy-intensive programs receives what any school of its enrollment receives.
EDCOM II’s National Education Plan asks DepEd to “refine its recently implemented School MOOE formula to integrate equity-based measures and allocations, taking into account LGU income class, priority status (e.g., schools with SPED learners), and schools offering SCPs” (Recommendation 6.2.1, target output 6.2.1.a, p. 97). Does School MOOE Reach Poor and Last Mile Schools? measures the FY 2026 allocations against Last Mile status, income class and poverty.
What this means for school heads
Stop planning around teacher and classroom counts. Under the old formula a new teacher item or a new classroom raised the next allocation. It no longer does. A school that gains a building gains the cost of lighting and maintaining it with no change in its MOOE. Put that cost in the Annual Implementation Plan when the building is turned over, and raise it with the Local School Board for the Special Education Fund.
Treat enrollment as the one number that moves the budget. Every learner in the count is worth PHP 1,110 a year to a purely elementary school and PHP 1,715 to a purely junior high school; a school with more than one level has its own amounts. The count used is the one from the school year that ended before the budget year. The guide to school records and school forms covers the records behind it. A padded count is a false entry in an official record, and the school head who signs the school’s reports answers for it.
Know what the fixed amount does for a school of your size. In an elementary school of 100 learners the fixed amount is 84% of the allocation; in one of 1,000 learners, 34%. A small school’s budget barely moves with enrollment. A large school’s does, and a large, crowded school has the least per learner to work with. Leading a small or multigrade school covers the small school’s side.
Explain the change to stakeholders in one sentence. The school is no longer funded for the teachers and rooms it has, but for the learners it serves and the kind of school it is. Parents and local officials who remember the old basis may assume that a new classroom brings its own operating money. It does not.
Use the comparison when asking for local support. A crowded school can show that its MOOE per learner is the same as any school of its size and that its rooms are not. That is a case for classrooms and for Special Education Fund support, not for MOOE, which may not pay for construction.
What a school head may not do. Neither formula gives authority to spend MOOE outside DO 008, s. 2019, to adjust enrollment figures, or to treat the formula amount as the allocation. The amount a school may spend is the one on DepEd’s list and in the division’s written notice.
These duties sit in Domain 2, Managing School Operations and Resources, of the Philippine Professional Standards for School Heads (DepEd Order No. 024, s. 2020), which covers the management of school funds.
Frequently asked questions
What is the difference between the Boncodin formula and the normative formula?
The Boncodin formula added a fixed amount to an amount for each learner, teacher, classroom and graduating learner. The normative formula adds a fixed amount for the school’s curricular offering to an amount for each learner, and counts nothing else. Its amounts come from the cost of meeting DepEd’s minimum service standards, where the old formula’s came from a per-learner budget with factors added in 2013 (DO 008, s. 2019, Enclosure, Sec. I, item 1; EDCOM II Year Two Report, pp. 356-357).
Why is it called the Boncodin formula?
Emilia T. Boncodin, a former Secretary of Budget and Management, led the team that developed it. With Wilfredo G. Nuqui she wrote the 2008 study Equitable Allocation of DepEd MOOE, and DepEd’s account of the FY 2013 budget credits the formula to “the team of former Secretary Emilia Boncodin” (World Bank, 2013, Annex 7, p. 62; Manasan, Celestino and Cuenca, 2011, p. 44). DepEd’s orders call it “the new school MOOE formula”; its Financial Management Operations Manual of 2016 uses the name.
Is the Boncodin formula still used?
No. DepEd’s FY 2024 allocation was the last under it. The DBM approved the normative formula in part for FY 2025 and in full for the FY 2026 budget (EDCOM II Final Report, p. 363).
Do teachers and classrooms still affect a school’s MOOE?
No. The old formula paid PHP 6,000 for each teacher and PHP 4,500 for each classroom in an elementary school, as of 2024 (Laguda et al., 2025, Table 5). In DepEd’s FY 2026 list, enrollment alone accounts for 99.95% of the differences among purely elementary schools.
Why does a crowded school still get less MOOE per learner?
Because crowded schools are mostly large schools, and the fixed amount is the same for a large school as for a small one. Elementary schools with more than 45 learners to a room averaged PHP 3,253 per learner in FY 2026, and those with 25 or fewer, PHP 8,430. Between two schools of the same enrollment there is no longer a difference (DepEd, School MOOE Allocation, FY 2026, with DepEd school data for SY 2023-2024).
Download the data
- Roomiest and most crowded thirds, by enrollment band (CSV): the median rooms, teachers and School MOOE of each third in five bands, FY 2023, FY 2024 and FY 2026. Source: DepEd, School MOOE Allocation, FY 2023, FY 2024 and FY 2026; DepEd school data, SY 2023-2024.
- MOOE per learner by learners per room (CSV): the mean and median School MOOE per learner in four bands of crowding, for purely elementary schools, FY 2024 and FY 2026. Source: DepEd, School MOOE Allocation, FY 2024 and FY 2026; DepEd enrollment and school data.
- Schools of about 300 learners (CSV): the lowest, median and highest School MOOE of purely elementary schools of 285 to 315 learners, FY 2023 and FY 2026. Source: DepEd, School MOOE Allocation, FY 2023 and FY 2026; DepEd enrollment by school.
The CSVs and charts may be reused only with written permission: email support@nash.com.ph. The rules themselves come from DepEd’s issuances, which you can cite directly. Every school’s allocation from FY 2020 to FY 2026 is in School MOOE Allocation by School, and the cleaned enrollment and school files are in Download Cleaned DepEd School Data.
Sources
DepEd issuances and data
- DepEd Order No. 008, s. 2019, Revised Implementing Guidelines on the Direct Release, Use, Monitoring and Reporting of Maintenance and Other Operating Expenses Allocation of Schools, Including Other Funds Managed by Schools (May 2, 2019), Enclosure, Sec. I, item 1.
- DepEd Order No. 13, s. 2016, Implementing Guidelines on the Direct Release and Use of Maintenance and Other Operating Expenses (MOOE) Allocations of Schools, Including Other Funds Managed by Schools (March 11, 2016), Enclosure, Sec. I, item 1.
- DepEd Order No. 31, s. 2016, Implementing Guidelines on the Release and Utilization of Maintenance and Other Operating Expenses (MOOE) Allocations of Senior High Schools (May 23, 2016), Enclosure, item 8.
- DepEd Order No. 11, s. 2017, Guidelines on the Preparation of Budget Proposals for Fiscal Year 2018 (March 3, 2017), Sec. IV.E.1.i.
- DepEd Order No. 12, s. 2014, Implementing Guidelines on the Direct Release of Maintenance and Other Operating Expenses (MOOE) Allocations of Schools to the Respective Implementing Units (March 6, 2014), Enclosure, Sec. 4, item e.
- DepEd Order No. 5, s. 2011, Guidelines on the Utilization of the Additional Subsidy for the Regional Science High Schools for CY 2011 (January 19, 2011), item 1.
- DepEd Order No. 25, s. 2010, Budget Strategy for Basic Education, FYs 2010-2015 (March 8, 2010), par. 2(g).
- DepEd Order No. 24, s. 2007, Budget Strategy of 2007 for the Basic Education Sector (April 18, 2007), Enclosure, par. 4.2.
- Department of Education, Region X, Division of Misamis Oriental, memorandum of February 5, 2016, Submission of FY 2017 MOOE School Operating Budget Proposal (SOBP).
- DepEd press release, Public schools operating expenses increased (March 14, 2013), Official Gazette.
- DepEd Order No. 60, s. 2016, Implementation of the Financial Management Operations Manual and Orientation of DepEd Financial Management Staff at the Regional, Division and School Levels (September 2, 2016), with the manual, p. 128.
- DepEd Order No. 024, s. 2020, National Adoption and Implementation of the Philippine Professional Standards for School Heads (September 7, 2020).
- DepEd, School MOOE Allocation, FY 2026 (45,801 schools) and Public Schools MOOE Allocation, FY 2024 (45,071 schools), with the lists for FY 2020 to FY 2023, from the DepEd transparency page.
- DepEd enrollment data by school, SY 2021-2022 to SY 2024-2025, and DepEd school facilities and personnel data, SY 2023-2024 (instructional rooms and nationally funded teachers by school). The cleaned files are in Download Cleaned DepEd School Data.
- DepEd Philippines, official Facebook page: Mas malaking suporta para sa bawat paaralan!, three cards on the proposed 2027 budget for school operations and the Simplified Normative Funding Formula (2026).
Reports
- World Bank (2016). Providing Schools with Enough Resources to Deliver Quality Education in the Philippines. Philippines Education Note No. 6, June 2016, pp. 3-4 and 9, with Table 1.
- World Bank (2013). Implementation Completion and Results Report (IBRD-73930) on a Loan in the Amount of US$200 Million to the Republic of the Philippines for a National Program Support for Basic Education Project. Report No. ICR2705, June 26, 2013, Annex 7, p. 62.
- Manasan, R. G., Celestino, A. B., and Cuenca, J. S. (2011). Mobilizing LGU Support for Basic Education: Focus on the Special Education Fund. Philippine Institute for Development Studies, Discussion Paper Series No. 2011-07, pp. 4 and 44.
- Laguda, R., Aquino, G., Cangayao, L., and Tagle, R. (2025). Realizing Shared Governance: Decentralization of Philippine Basic Education. The Asia Foundation and EDCOM II. Box 3 with Tables 4 and 5 (p. 37).
- Second Congressional Commission on Education (2024). Miseducation: The Failed System of Philippine Education, EDCOM II Year One Report, p. 297.
- Second Congressional Commission on Education (2025). Fixing the Foundations: A Matter of National Survival, EDCOM II Year Two Report, pp. 356-358, with Table 8 and Figure 18.
- Second Congressional Commission on Education (2026). Turning Point: A Decade of Necessary Reform (2026-2035), EDCOM II Final Report, pp. 36 and 362-363; and the National Education Plan 2026-2035, Recommendation 6.2.1 with target output 6.2.1.a (p. 97).
Written by Mark Anthony Llego for NASH Reviewer. Sources: DepEd Orders No. 008, s. 2019, No. 13, s. 2016 and No. 31, s. 2016; DepEd’s School MOOE allocation lists for FY 2020 to FY 2026 and its enrollment and school data; World Bank (2013, 2016); Laguda et al. (2025); the EDCOM II Year One, Year Two and Final Reports. Charts may be reused only with written permission from support@nash.com.ph.