The Department of Education (DepEd) allocated PHP 59.35 billion in School Maintenance and Other Operating Expenses (MOOE) to 45,801 public schools for fiscal year (FY) 2026. That is twice the PHP 29.17 billion it allocated to 44,830 schools for FY 2020. With inflation taken out, the increase is 57.8%.
The figures come from DepEd’s School MOOE allocation lists for FY 2020 to FY 2026, which give each school’s amount for the year under the General Appropriations Act (GAA). DepEd’s Finance Service posts them under DepEd Order No. 008, s. 2019, which gives it this duty: “Post the allocations of all public elementary and secondary schools, including those that are IUs and non-IUs, on the DepEd website” (Enclosure, Sec. V.C.1.2). Joined to DepEd’s enrollment data, the seven lists show how much each school was allocated, how much that is per learner, and who gained when the formula changed.
Nearly all of the growth came after FY 2023. From FY 2020 to FY 2023 the total grew more slowly than prices. It then rose 17.3% in FY 2024, when the list first carried a PHP 282,000 minimum, and a further 63.9% in the two years of the normative formula, FY 2025 and FY 2026. New MOOE Normative Formula: How to Compute School MOOE explains the formula. The lists show what it did to the amounts.
Key findings
- School MOOE doubled in six years, and most of the increase came in the last two. The lists total PHP 29.17 billion in FY 2020, PHP 36.20 billion in FY 2024 and PHP 59.35 billion in FY 2026. In FY 2020 pesos the FY 2026 total is PHP 46.04 billion, 57.8% more than in FY 2020 (DepEd, School MOOE Allocation lists, FY 2020 to FY 2026; Philippine Statistics Authority, consumer price index).
- The median school’s allocation rose from PHP 346,000 to PHP 855,000. In FY 2020, 67.5% of schools received less than PHP 500,000. In FY 2026 no school received less than PHP 580,000 (DepEd, School MOOE Allocation lists).
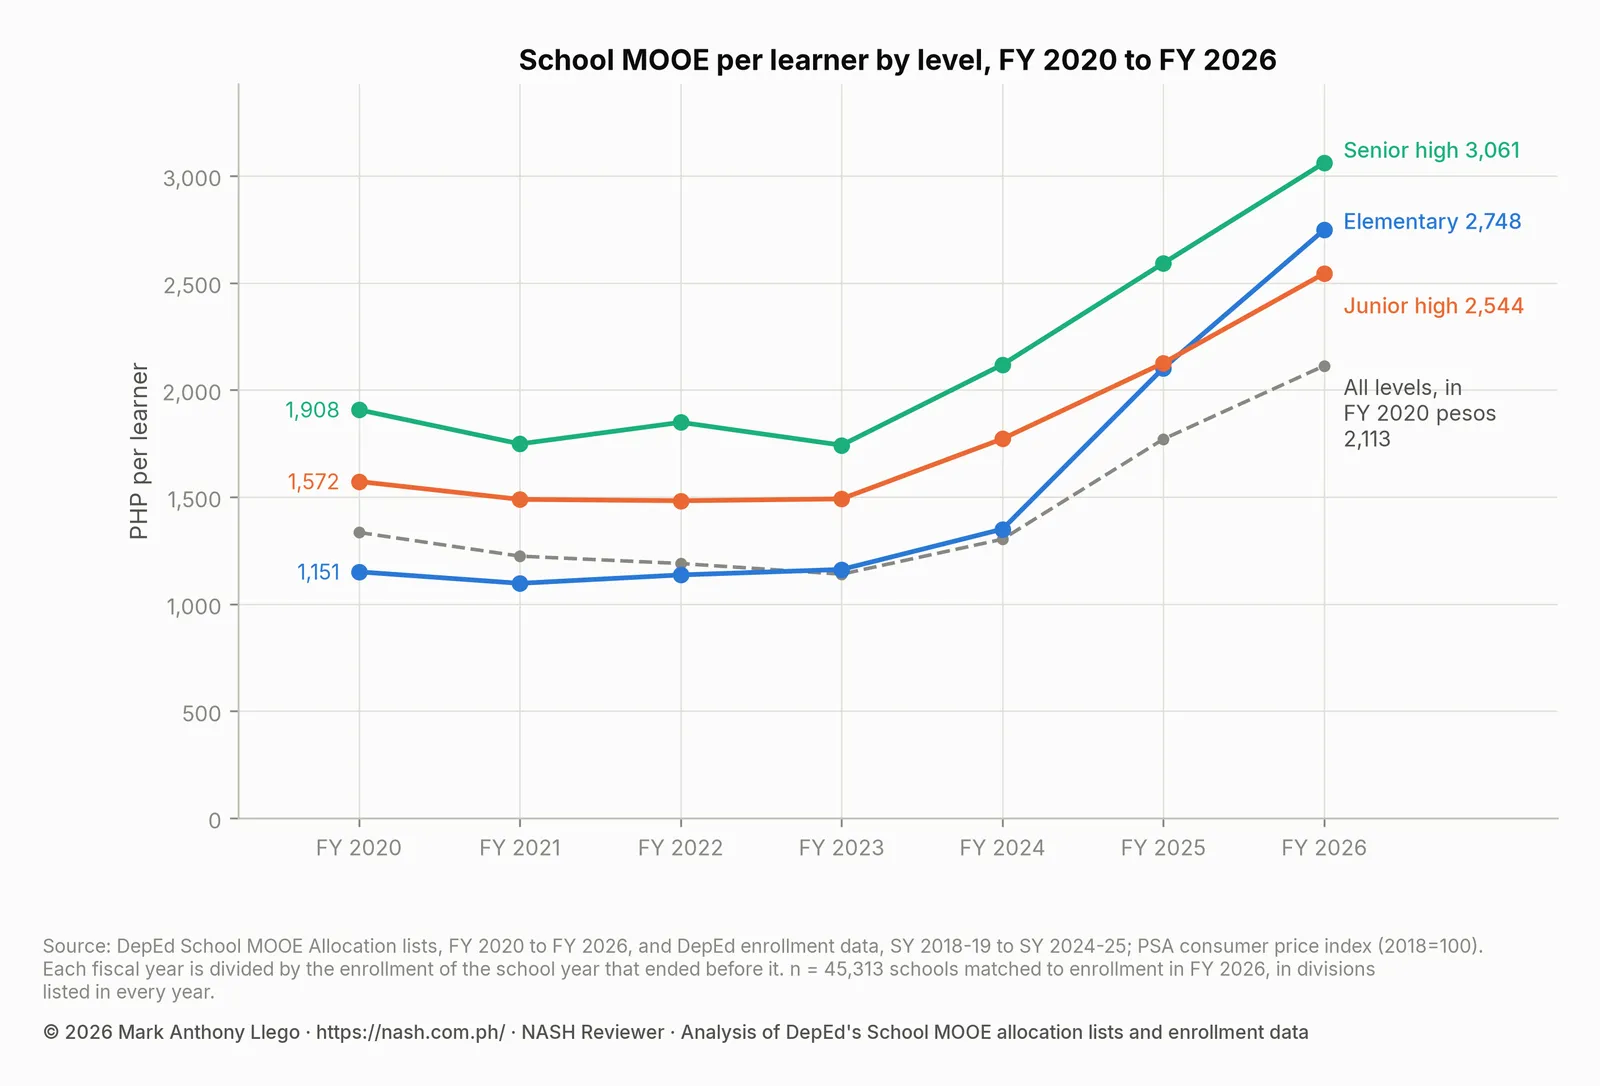
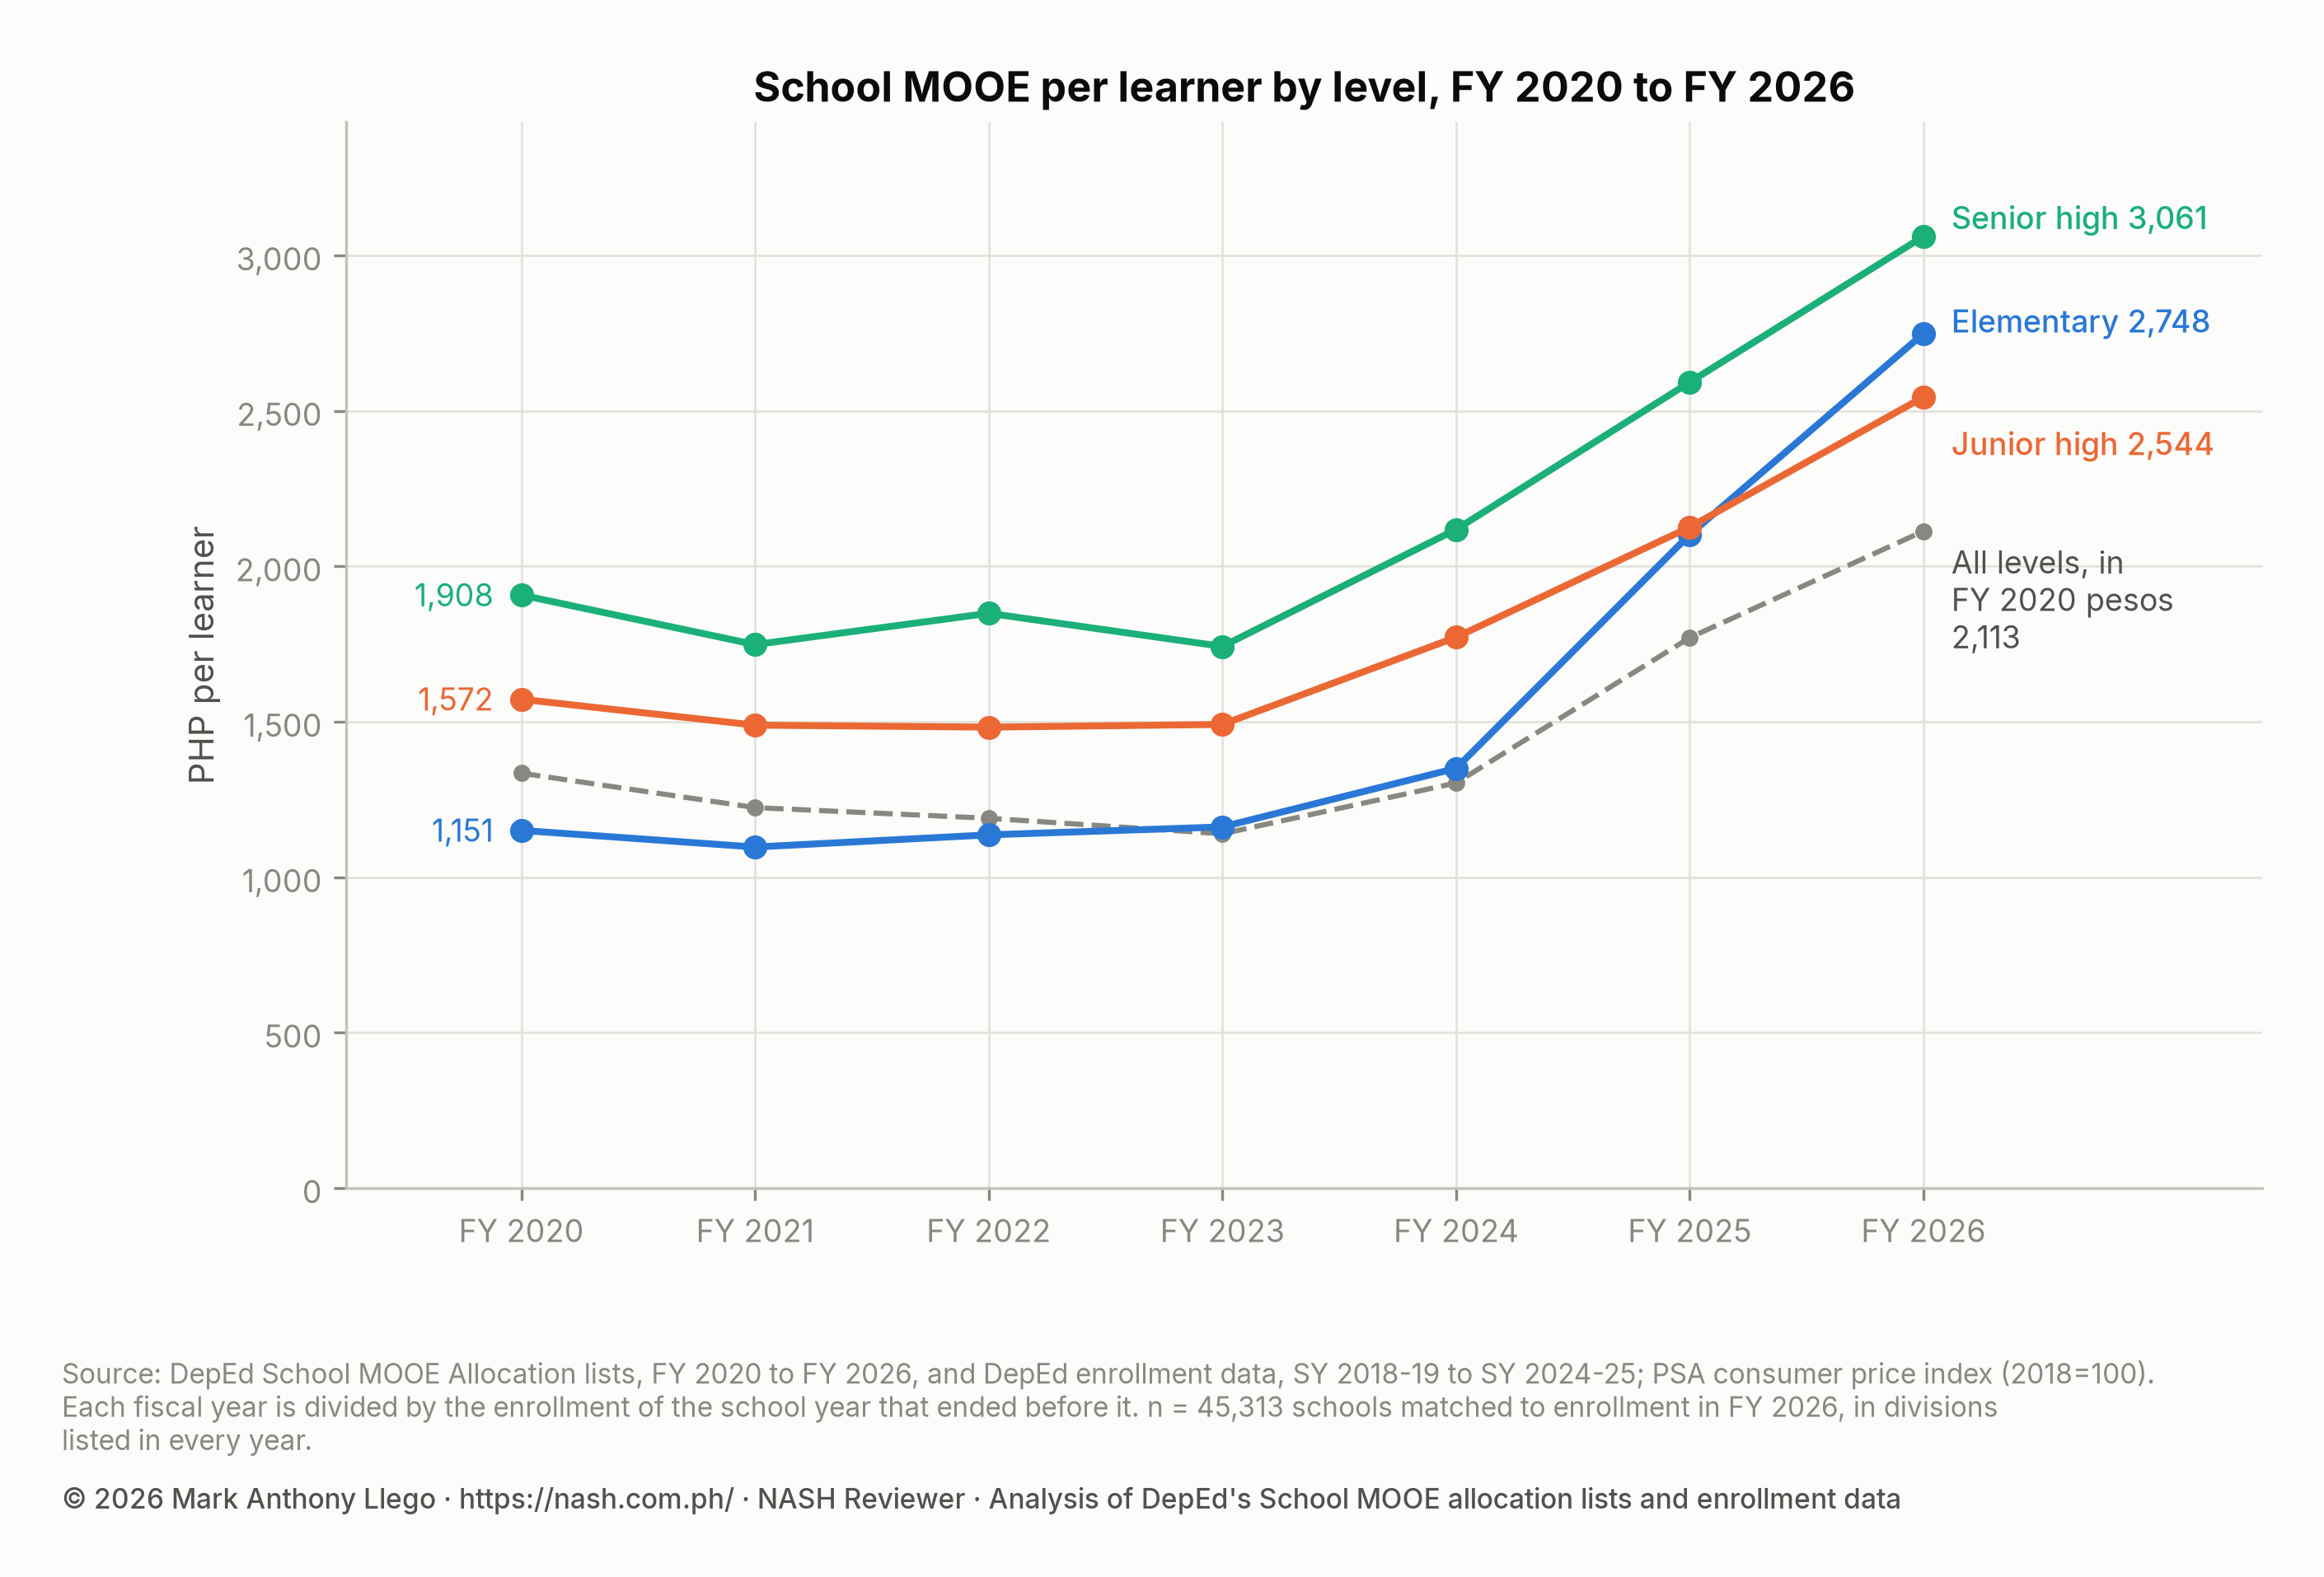
- The amount per learner rose from PHP 1,335 to PHP 2,724. Elementary rose most, from PHP 1,151 to PHP 2,748 per learner, and passed junior high school (PHP 2,544). Senior high school is PHP 3,061 (allocation lists with DepEd enrollment data, SY 2018-2019 to SY 2024-2025).
- Small schools gained the most. Schools of 200 learners or fewer hold 10.7% of learners and receive 25.3% of the money in FY 2026, up from 16.3% in FY 2020. A school of 50 learners or fewer receives PHP 18,598 per learner and a school of more than 2,000 receives PHP 1,826 (allocation lists with DepEd enrollment data).
- Schools of the same size and offering now receive nearly the same amount. Among purely elementary schools of 190 to 210 learners, the school at the 90th percentile received 1.39 times the school at the 10th percentile in FY 2024, and 1.02 times in FY 2026. Enrollment and curricular offering account for 99.7% of the differences among schools in the amount per learner (allocation lists with DepEd enrollment data).
- Regions differ by school size, not by a regional rate. The amount per learner in FY 2026 runs from PHP 1,674 in the National Capital Region (NCR) to PHP 4,670 in the Cordillera Administrative Region (CAR). Across regions it follows the share of schools with 200 learners or fewer almost exactly, a correlation of 0.96 (allocation lists with DepEd enrollment data).
- Three years stand out in the school-by-school record. In FY 2021, 94.3% of schools received less than the year before. In FY 2024, 8,525 schools received exactly PHP 282,000, the lowest amount on that list. In FY 2025 half of the schools on both lists received at least 66.1% more than the year before (DepEd, School MOOE Allocation lists).
How much School MOOE DepEd allocated, FY 2020 to FY 2026
A list has one row for each school, with an elementary (ES), a junior high school (JHS) and a senior high school (SHS) amount and their total. The table adds the rows of each list.
| Fiscal year | Schools | Elementary (PHP billion) | Junior high (PHP billion) | Senior high (PHP billion) | Total (PHP billion) | Change from the year before | Total in FY 2020 pesos (PHP billion) |
|---|---|---|---|---|---|---|---|
| FY 2020 | 44,830 | 15.57 | 10.55 | 3.05 | 29.17 | 29.17 | |
| FY 2021 | 44,637 | 14.44 | 10.17 | 3.02 | 27.63 | -5.3% | 26.58 |
| FY 2022 | 44,813 | 14.84 | 10.18 | 3.59 | 28.61 | +3.6% | 26.01 |
| FY 2023 | 44,940 | 15.55 | 10.96 | 4.34 | 30.85 | +7.8% | 26.47 |
| FY 2024 | 45,071 | 18.07 | 12.50 | 5.64 | 36.20 | +17.3% | 30.09 |
| FY 2025 | 45,229 | 28.04 | 13.67 | 6.61 | 48.32 | +33.5% | 39.51 |
| FY 2026 | 45,801 | 35.70 | 16.15 | 7.50 | 59.35 | +22.8% | 46.04 |
The last column removes inflation. It restates each year’s total in FY 2020 pesos with the Philippine Statistics Authority’s consumer price index, which rose 28.9% from 2020 to 2026. The 2026 index is the average of January to October 2026, so the FY 2026 figures in FY 2020 pesos will fall slightly when November and December are in.
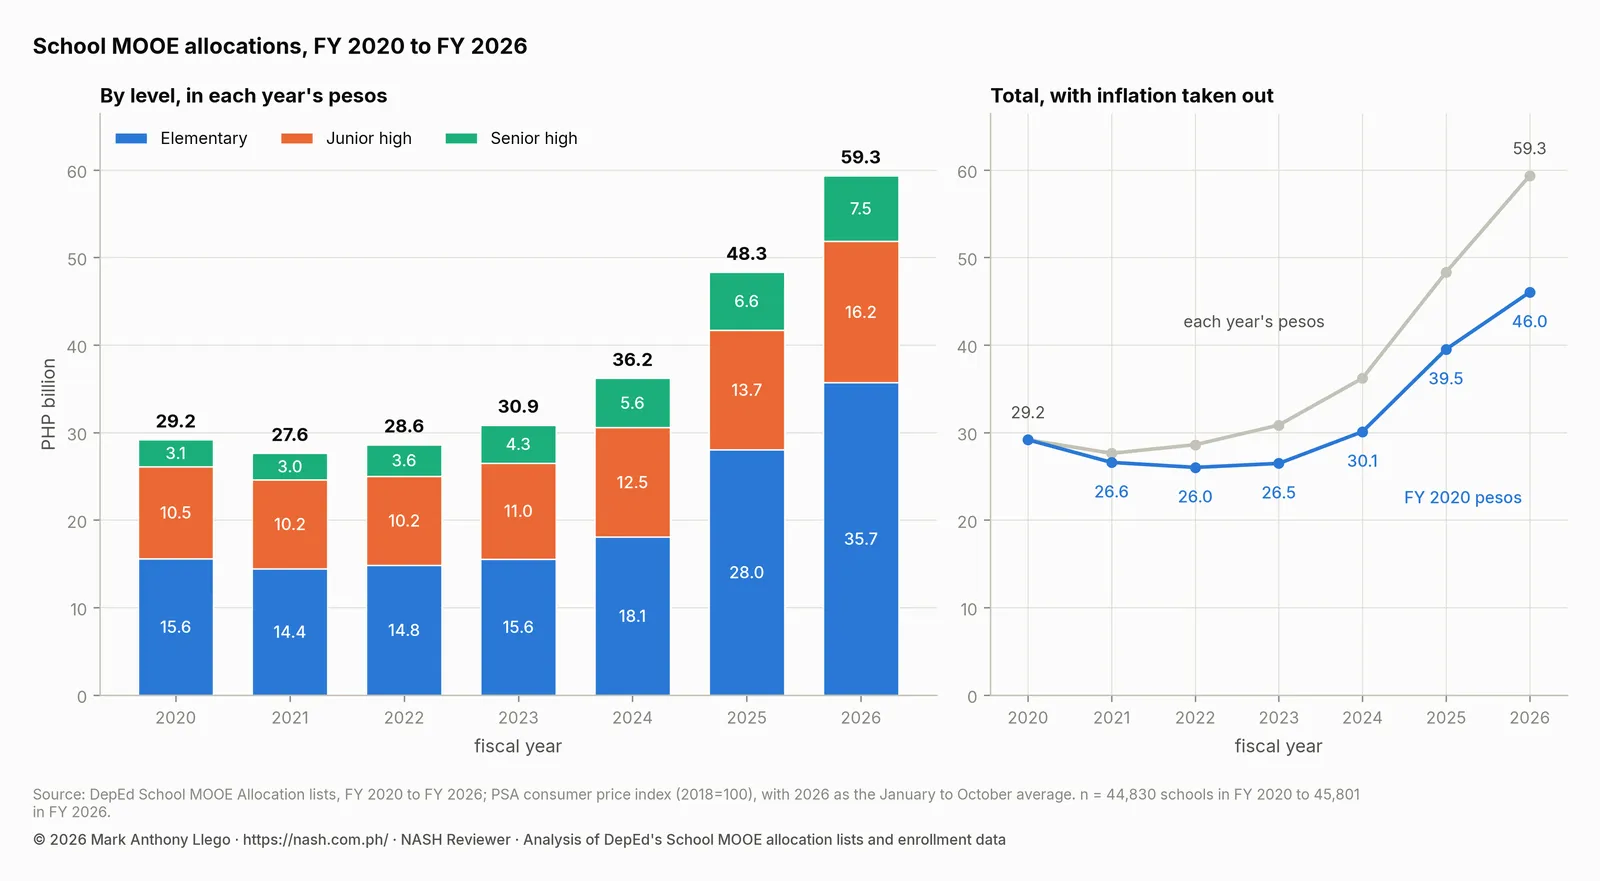
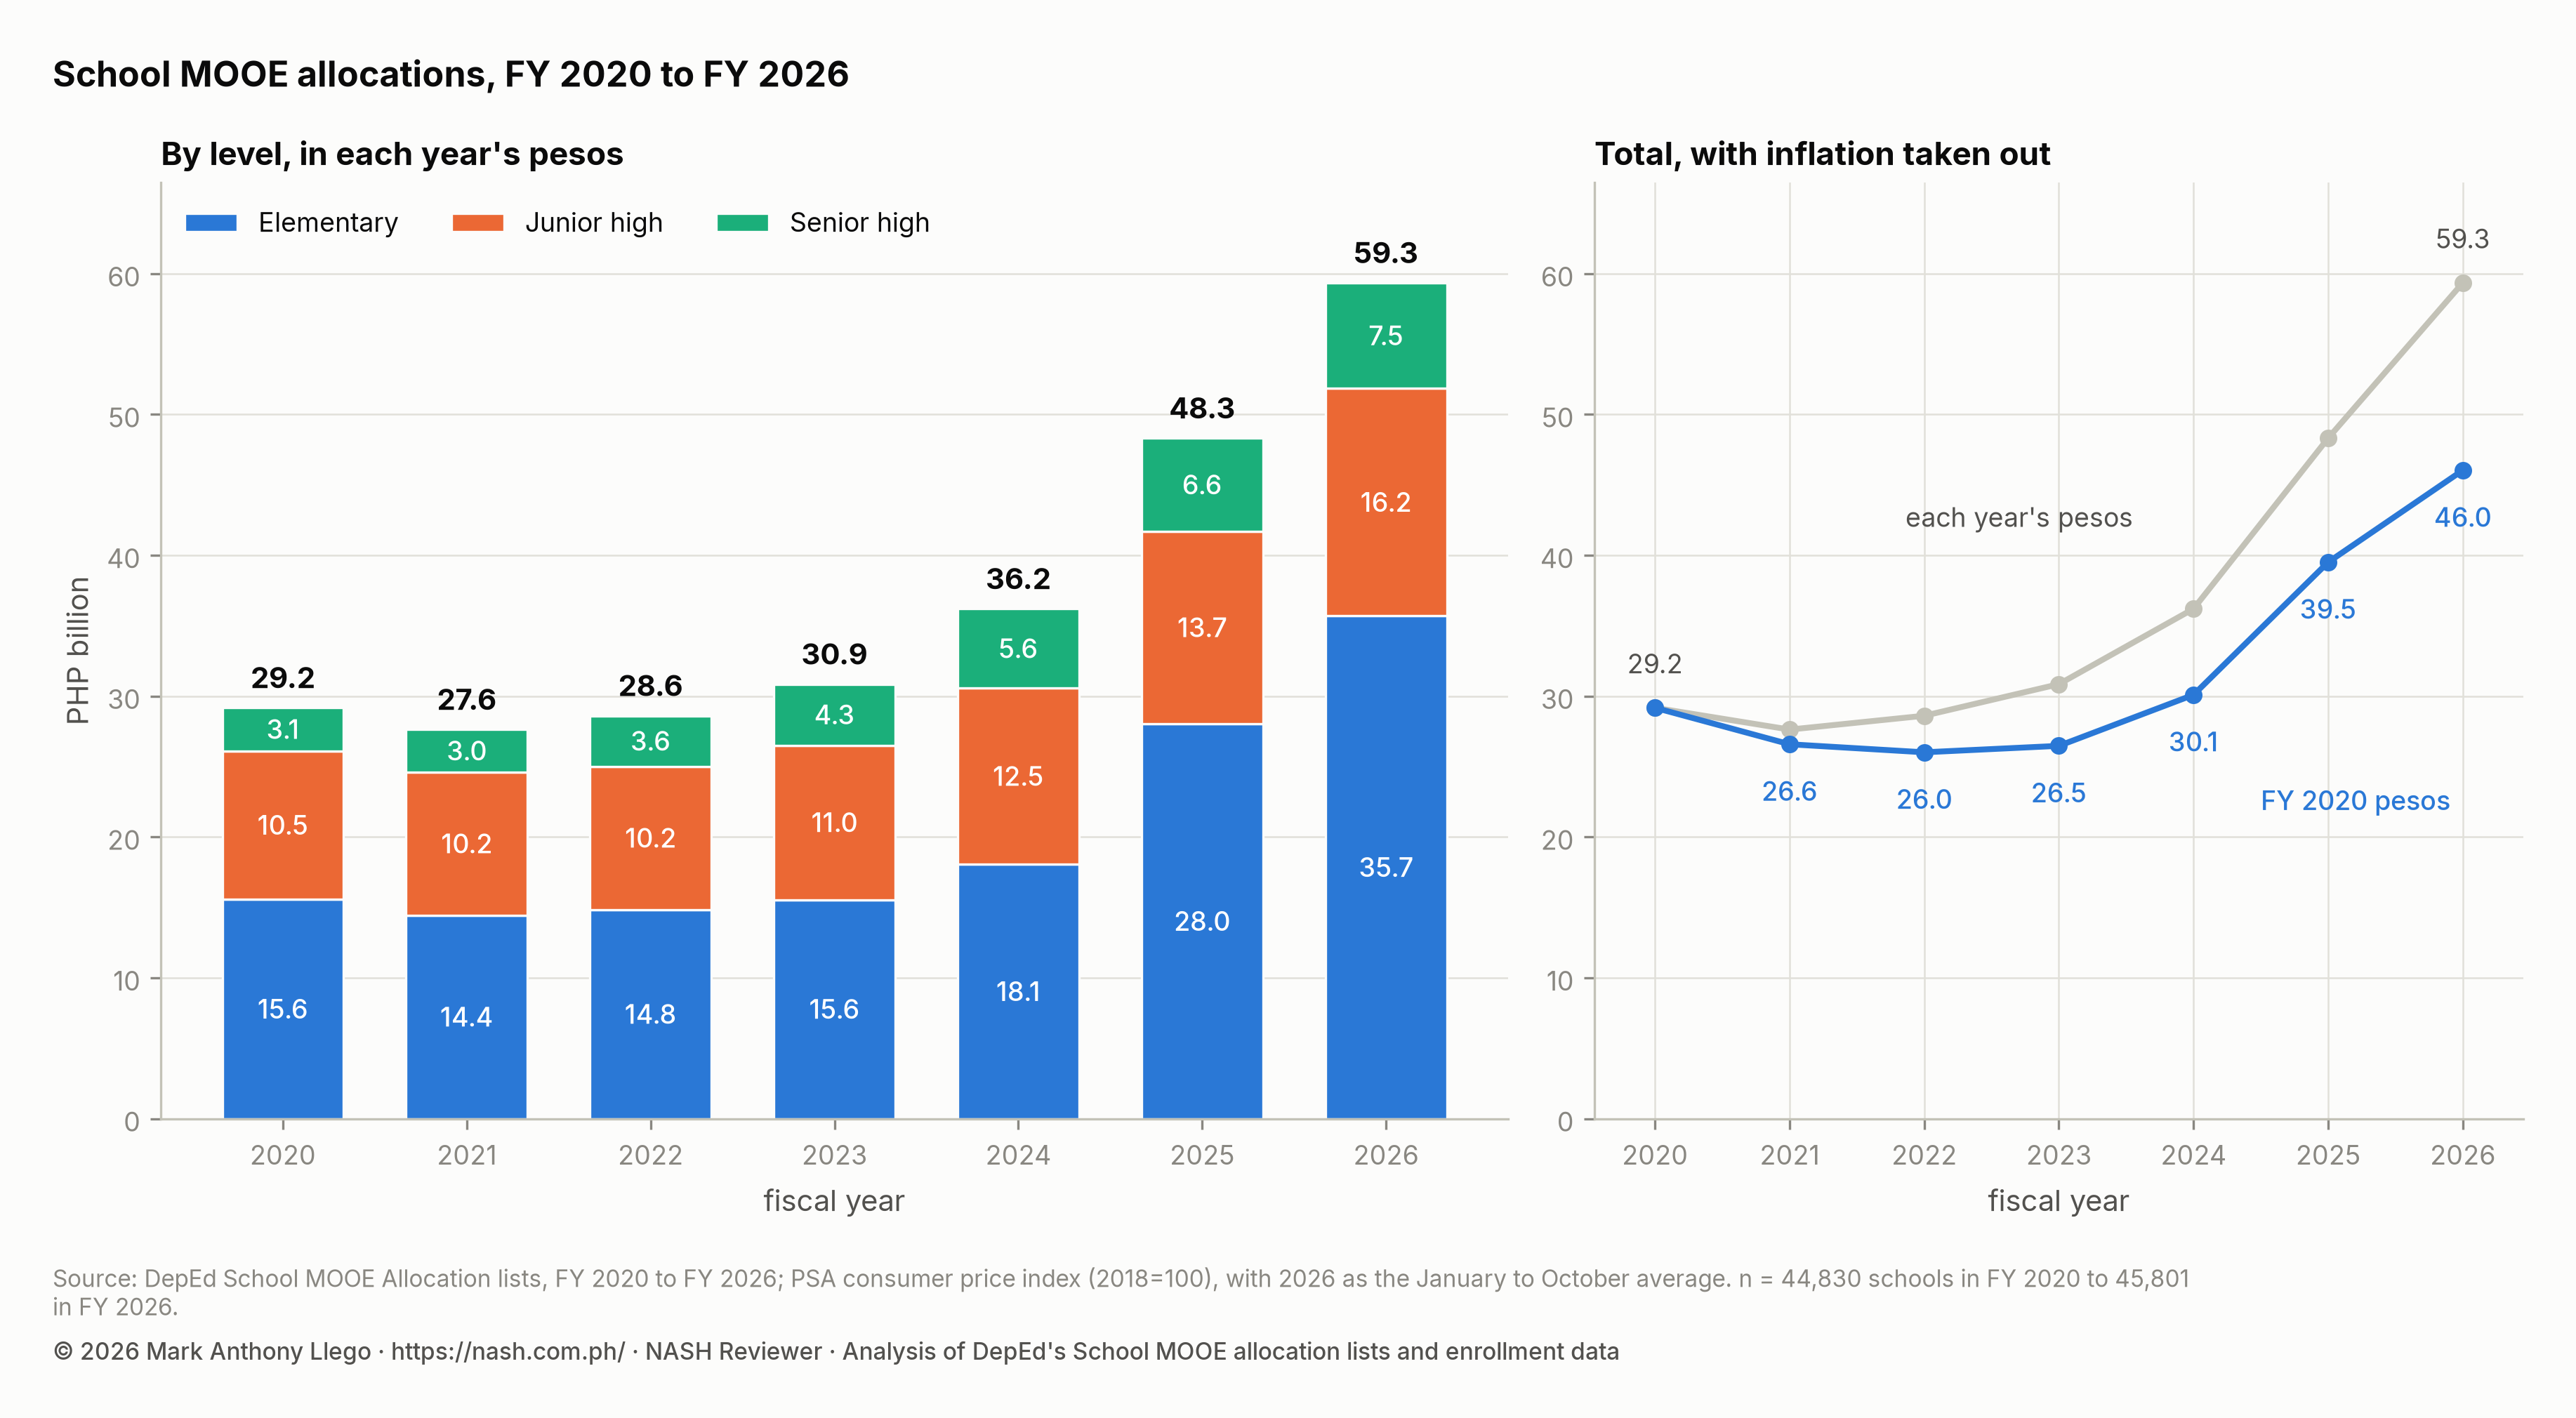
Three periods show in the table.
- FY 2020 to FY 2023: less in real terms. The total rose 5.8% in three years and prices rose 16.6%, so the lists bought 9.3% less in FY 2023 than in FY 2020.
- FY 2024: back above FY 2020. The total rose 17.3%, or 13.7% after inflation, and passed its FY 2020 level in real terms for the first time.
- FY 2025 and FY 2026: the normative formula. The total rose 33.5% and then 22.8%. Elementary amounts nearly doubled in two years, from PHP 18.07 billion to PHP 35.70 billion (97.6%). Junior high rose 29.3% and senior high 32.9%.
The shift toward elementary changed the shares. Elementary was 49.9% of the total in FY 2024 and is 60.1% in FY 2026.
The FY 2026 list is the first to include all the schools of the Division of Sulu, 457 of them, with PHP 453.2 million. Without Sulu, and without the 197 rows of FY 2020 that later lists do not cover, the increase from FY 2020 to FY 2026 is 102.7%, or 57.2% after inflation.
What a school receives
Half of the schools on the FY 2026 list receive PHP 855,000 or less for the year, about PHP 71,250 a month. In FY 2020 the median was PHP 346,000.
| Fiscal year | 10th percentile | 25th percentile | Median school | 75th percentile | 90th percentile | Lowest amount on the list |
|---|---|---|---|---|---|---|
| FY 2020 | PHP 204,000 | PHP 260,000 | PHP 346,000 | PHP 628,000 | PHP 1,304,000 | PHP 15,000 |
| FY 2021 | PHP 190,000 | PHP 243,000 | PHP 324,000 | PHP 614,000 | PHP 1,238,400 | PHP 103,000 |
| FY 2022 | PHP 207,000 | PHP 249,000 | PHP 327,000 | PHP 623,000 | PHP 1,261,800 | PHP 120,000 |
| FY 2023 | PHP 215,000 | PHP 259,000 | PHP 342,000 | PHP 663,000 | PHP 1,370,000 | PHP 124,000 |
| FY 2024 | PHP 282,000 | PHP 302,000 | PHP 401,000 | PHP 774,000 | PHP 1,577,000 | PHP 282,000 |
| FY 2025 | PHP 528,000 | PHP 575,000 | PHP 678,000 | PHP 989,000 | PHP 1,815,000 | PHP 452,000 |
| FY 2026 | PHP 656,000 | PHP 716,000 | PHP 855,000 | PHP 1,255,000 | PHP 2,177,000 | PHP 580,000 |
The bottom of the distribution moved most. A school at the 10th percentile received PHP 204,000 in FY 2020 and PHP 656,000 in FY 2026, 3.2 times as much. A school at the 90th percentile received 1.7 times as much. The share of schools with less than PHP 500,000 fell from 67.5% in FY 2020 to 60.1% in FY 2024, 2.7% in FY 2025 and none in FY 2026. Schools with PHP 1 million or more rose from 14.2% to 37.4%.
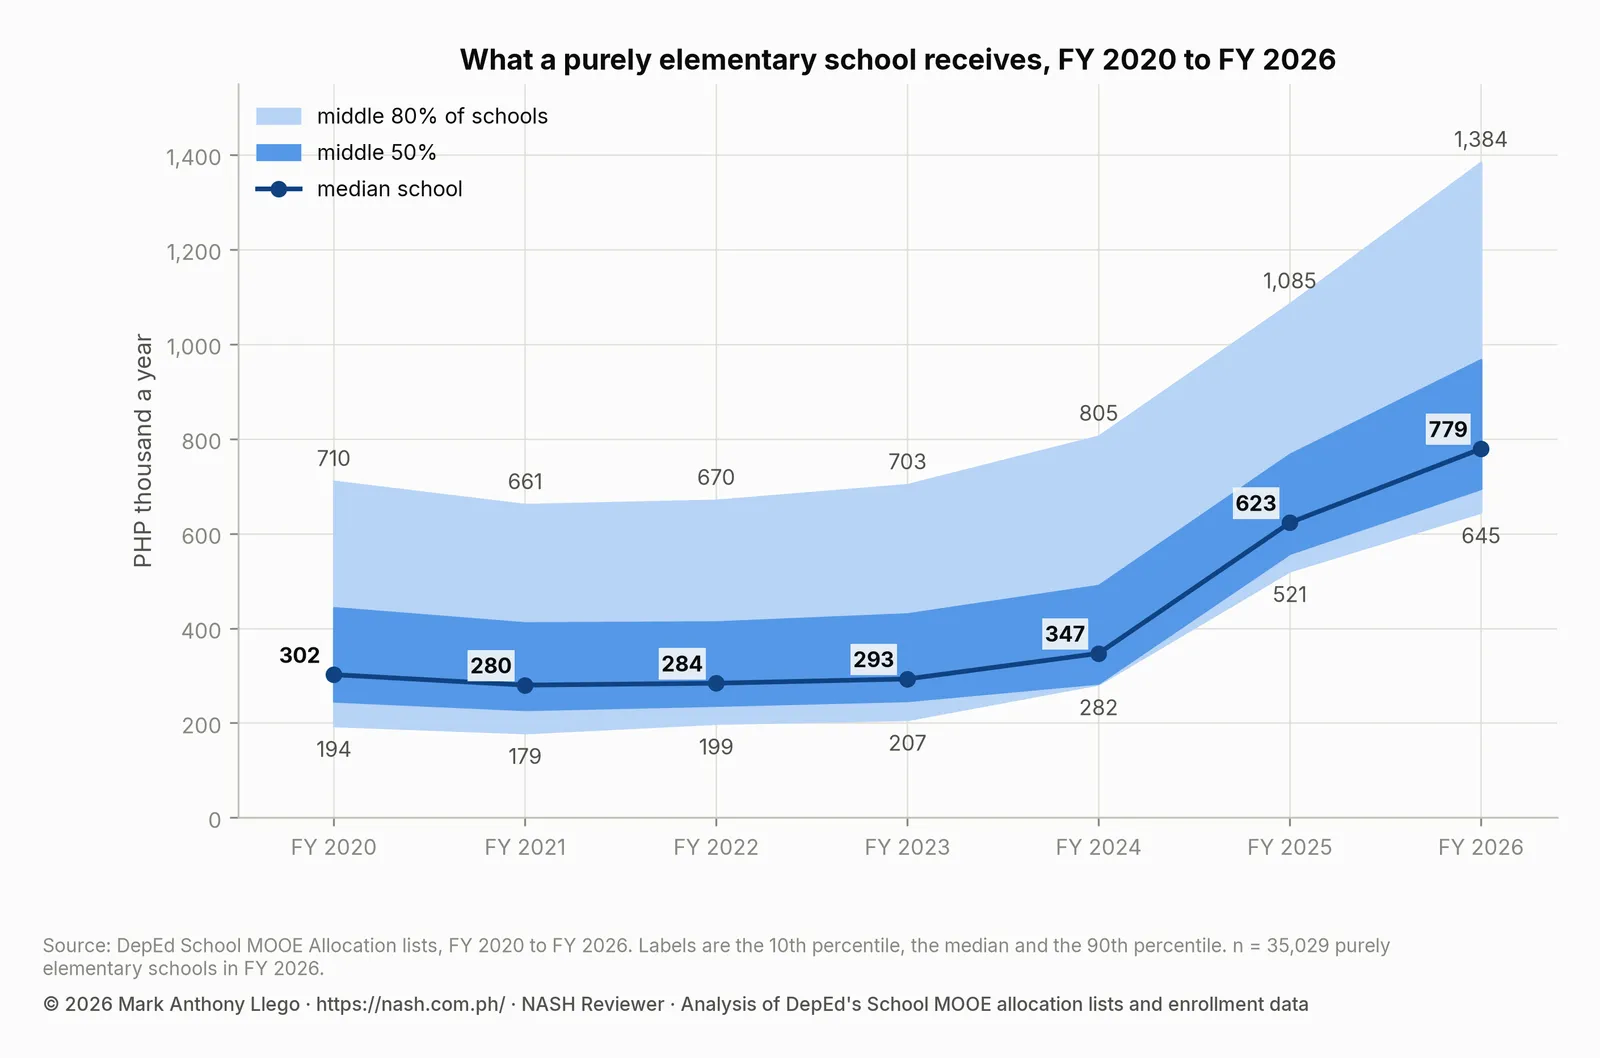
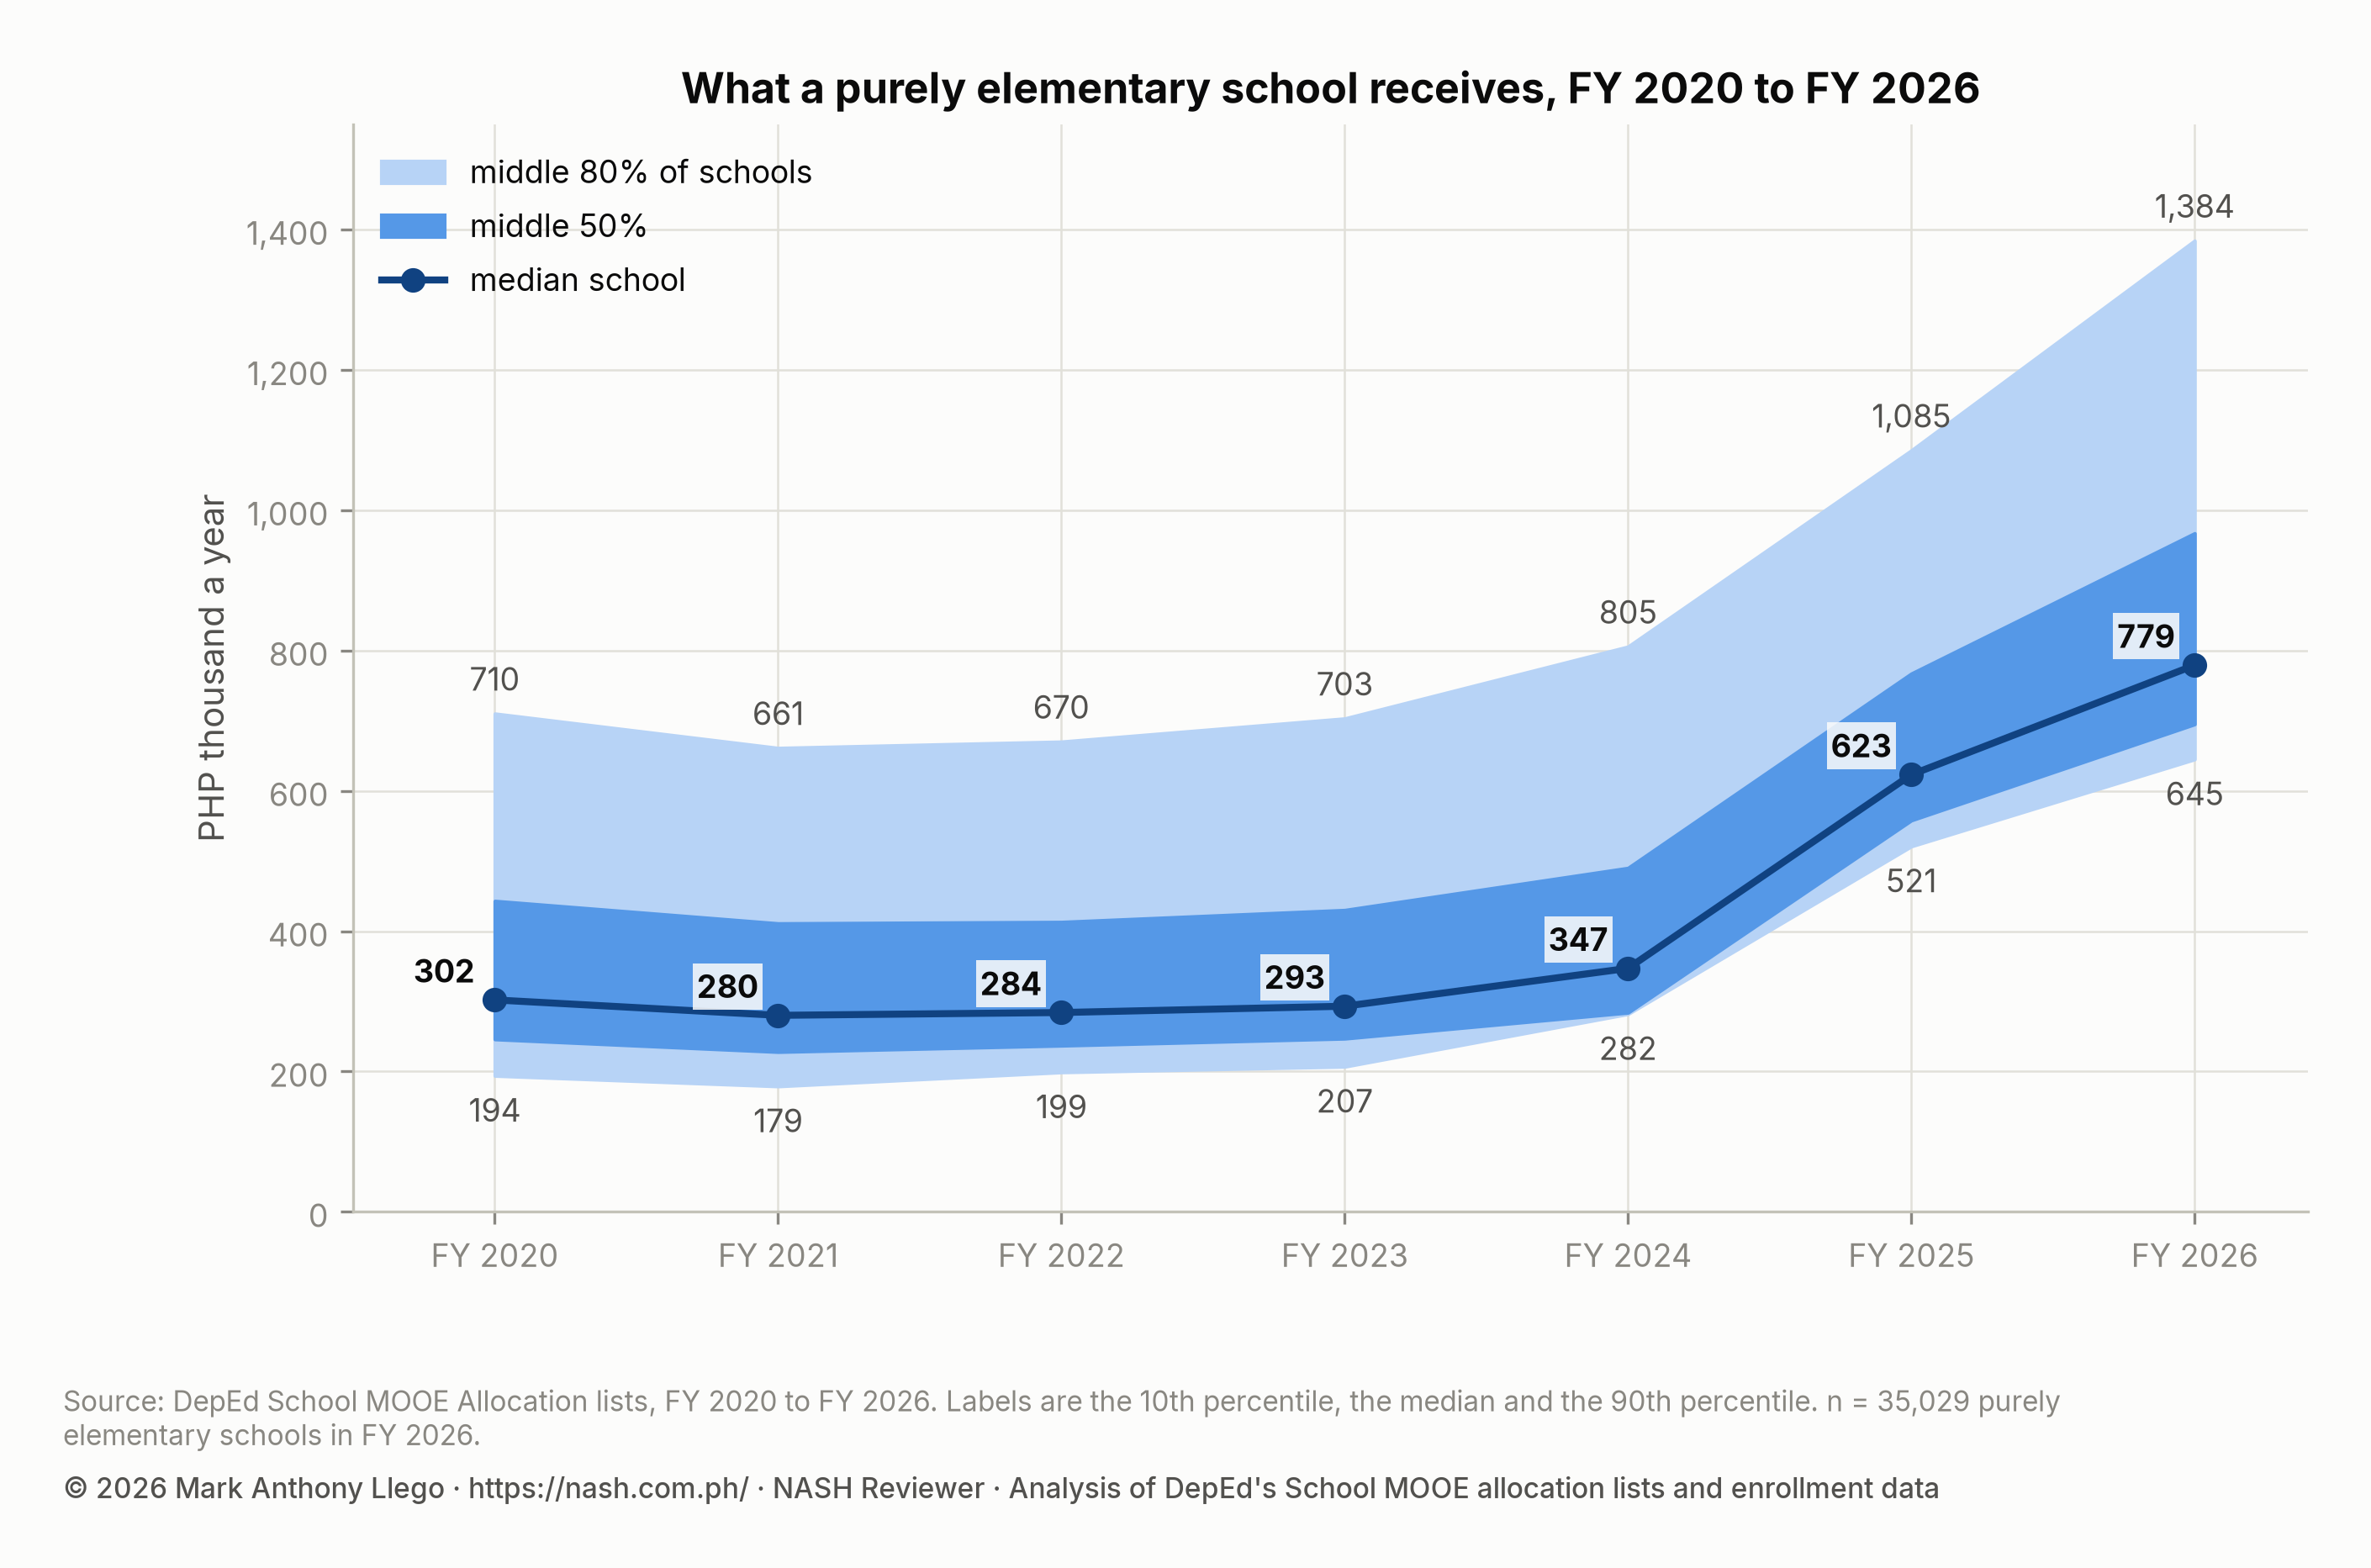
Purely elementary schools are more than three in four schools on every list (35,029 of 45,801 in FY 2026). Their median allocation was PHP 302,000 in FY 2020, PHP 347,000 in FY 2024 and PHP 779,000 in FY 2026.
The PHP 282,000 minimum of FY 2024
The FY 2024 list has a floor that no earlier list has. Its lowest amount is PHP 282,000, and 8,525 schools, 18.9% of the list, received exactly that. Every one of them is a purely elementary school. Under the lists of FY 2020 to FY 2023, an elementary school at the 10th percentile received between PHP 179,000 and PHP 207,000. Above the minimum, the FY 2024 list raised each school’s FY 2023 amount by a rate set for its city or municipality, from about 3% to about 49%; Does School MOOE Reach Poor and Last Mile Schools? sets out the rates.
The normative formula replaced that minimum with a fixed amount for every school. By DepEd’s FY 2026 list, a purely elementary school receives PHP 580,573 before any learner is counted, so none is listed below PHP 581,000. The list’s lowest amount, PHP 580,000, goes to three purely junior high schools, whose fixed amount is PHP 580,055.
School MOOE per learner, by level
Dividing each list by enrollment gives the amount per learner. Each fiscal year is divided by the enrollment of the last school year completed before the budget year began: FY 2026 by School Year (SY) 2024-2025, and FY 2020 by SY 2018-2019. The FY 2025 and FY 2026 lists were computed from that count, and it is used for the earlier years as well. The table covers the schools matched to DepEd’s enrollment data in the divisions that every list covers: at least 99.8% of the amounts in those divisions, and 99.2% of the whole FY 2026 list, which includes Sulu.
| Fiscal year | Enrollment of | Learners (million) | All levels | Elementary | Junior high | Senior high | All levels, in FY 2020 pesos |
|---|---|---|---|---|---|---|---|
| FY 2020 | SY 2018-2019 | 21.74 | PHP 1,335 | PHP 1,151 | PHP 1,572 | PHP 1,908 | PHP 1,335 |
| FY 2021 | SY 2019-2020 | 21.71 | PHP 1,272 | PHP 1,097 | PHP 1,489 | PHP 1,748 | PHP 1,224 |
| FY 2022 | SY 2020-2021 | 21.86 | PHP 1,308 | PHP 1,136 | PHP 1,483 | PHP 1,849 | PHP 1,190 |
| FY 2023 | SY 2021-2022 | 23.22 | PHP 1,328 | PHP 1,162 | PHP 1,491 | PHP 1,742 | PHP 1,140 |
| FY 2024 | SY 2022-2023 | 23.08 | PHP 1,567 | PHP 1,350 | PHP 1,772 | PHP 2,118 | PHP 1,303 |
| FY 2025 | SY 2023-2024 | 22.30 | PHP 2,165 | PHP 2,102 | PHP 2,126 | PHP 2,592 | PHP 1,770 |
| FY 2026 | SY 2024-2025 | 21.61 | PHP 2,724 | PHP 2,748 | PHP 2,544 | PHP 3,061 | PHP 2,113 |
Two things changed in the order of the levels.
- Elementary caught up. Until FY 2024 an elementary learner carried about three-quarters of a junior high learner’s amount (PHP 1,350 against PHP 1,772 in FY 2024). In FY 2026 the elementary amount is the higher of the two. Elementary rose 2.39 times from FY 2020, junior high 1.62 times and senior high 1.60 times.
- The amount per learner fell in real terms for three years. In FY 2020 pesos it went from PHP 1,335 to PHP 1,140 in FY 2023, a fall of 14.6%, before rising to PHP 2,113 in FY 2026.
DepEd’s own averages are a little higher. Its April 13, 2026 release gives PHP 2,792 per elementary learner, PHP 2,631 per junior high learner and PHP 3,264 per senior high learner for 2026. Those are 1.6%, 3.4% and 6.6% above the lists divided by SY 2024-2025 enrollment. The release does not state which enrollment count it divides by.
Why small schools receive more per learner
Every school receives a fixed amount whatever its enrollment, so the amount per learner falls as a school grows. That was true of the old formula and is truer of the new one.
| Learners in the school | Schools, FY 2026 | Per learner, FY 2020 | Per learner, FY 2024 | Per learner, FY 2026 | FY 2026 over FY 2020 | Median allocation, FY 2026 |
|---|---|---|---|---|---|---|
| 1 to 50 | 2,708 | PHP 5,189 | PHP 8,487 | PHP 18,598 | 3.58 times | PHP 619,000 |
| 51 to 100 | 6,071 | PHP 2,789 | PHP 3,834 | PHP 8,841 | 3.17 times | PHP 667,000 |
| 101 to 200 | 11,953 | PHP 1,891 | PHP 2,305 | PHP 5,206 | 2.75 times | PHP 746,000 |
| 201 to 500 | 13,949 | PHP 1,427 | PHP 1,686 | PHP 3,228 | 2.26 times | PHP 967,000 |
| 501 to 1,000 | 5,676 | PHP 1,270 | PHP 1,468 | PHP 2,320 | 1.83 times | PHP 1,516,500 |
| 1,001 to 2,000 | 3,053 | PHP 1,177 | PHP 1,357 | PHP 1,961 | 1.67 times | PHP 2,563,000 |
| Over 2,000 | 1,903 | PHP 1,134 | PHP 1,313 | PHP 1,826 | 1.61 times | PHP 5,389,000 |
In FY 2020 the smallest schools received 4.6 times as much per learner as the largest. In FY 2026 they receive 10.2 times as much. Every size of school gained, and the smaller the school, the larger the gain.
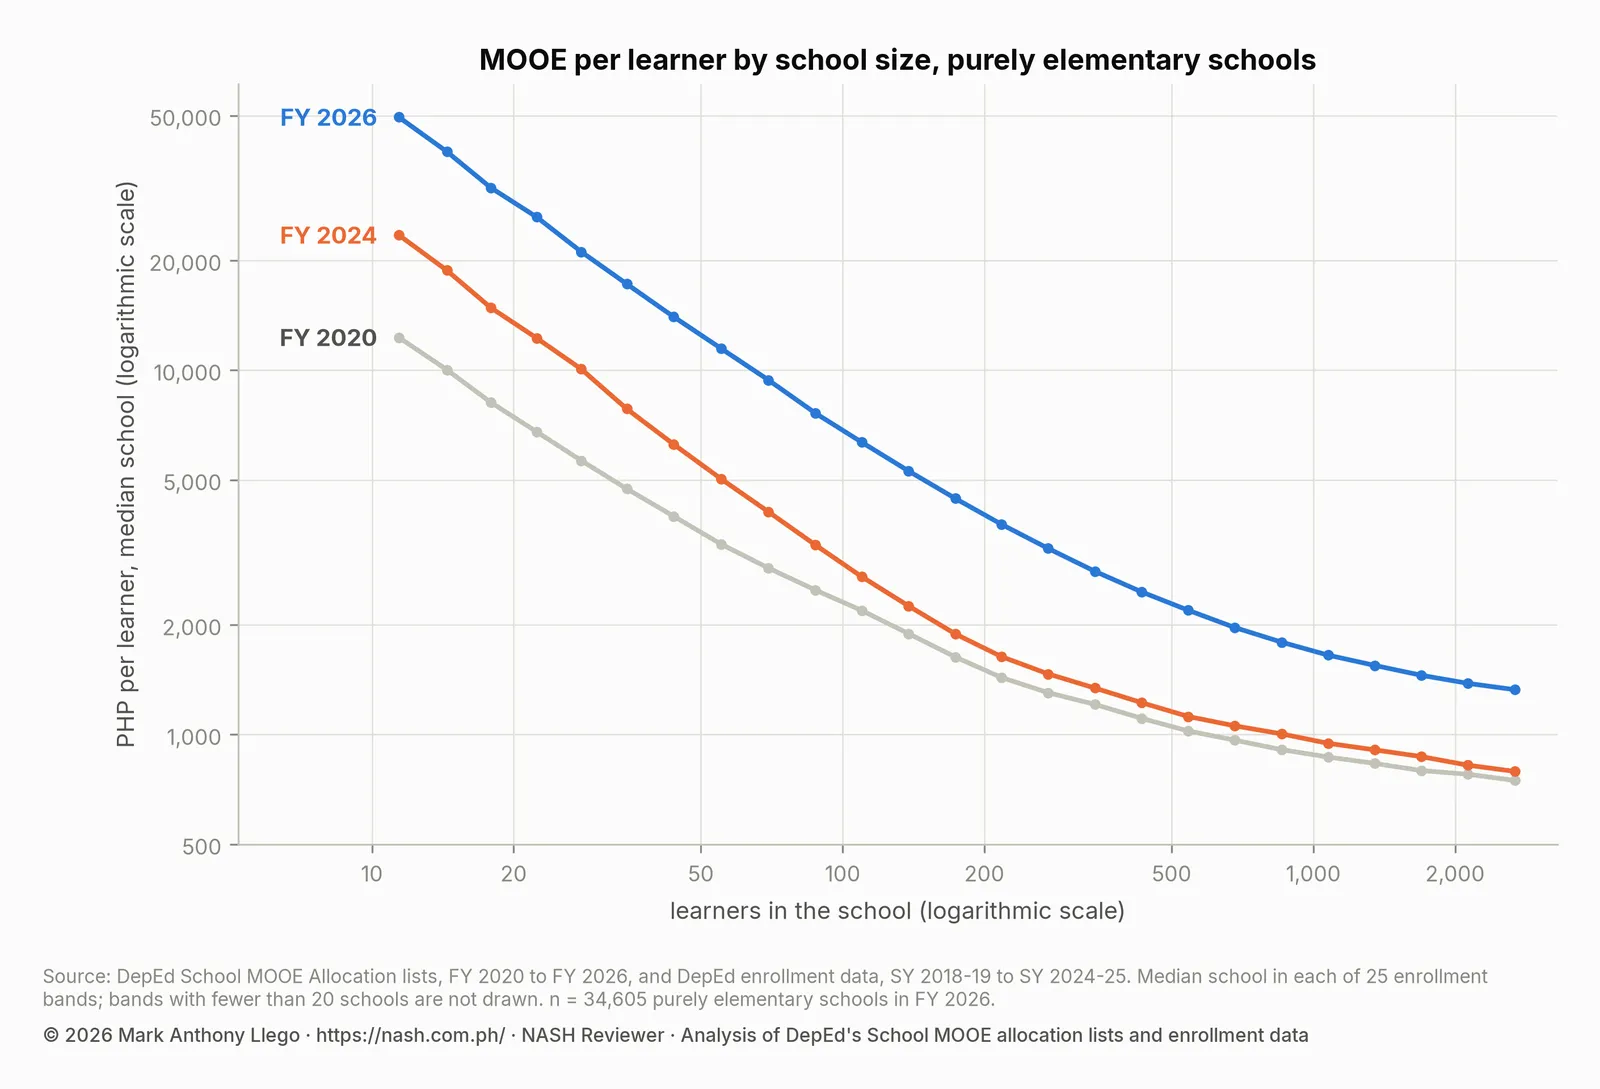
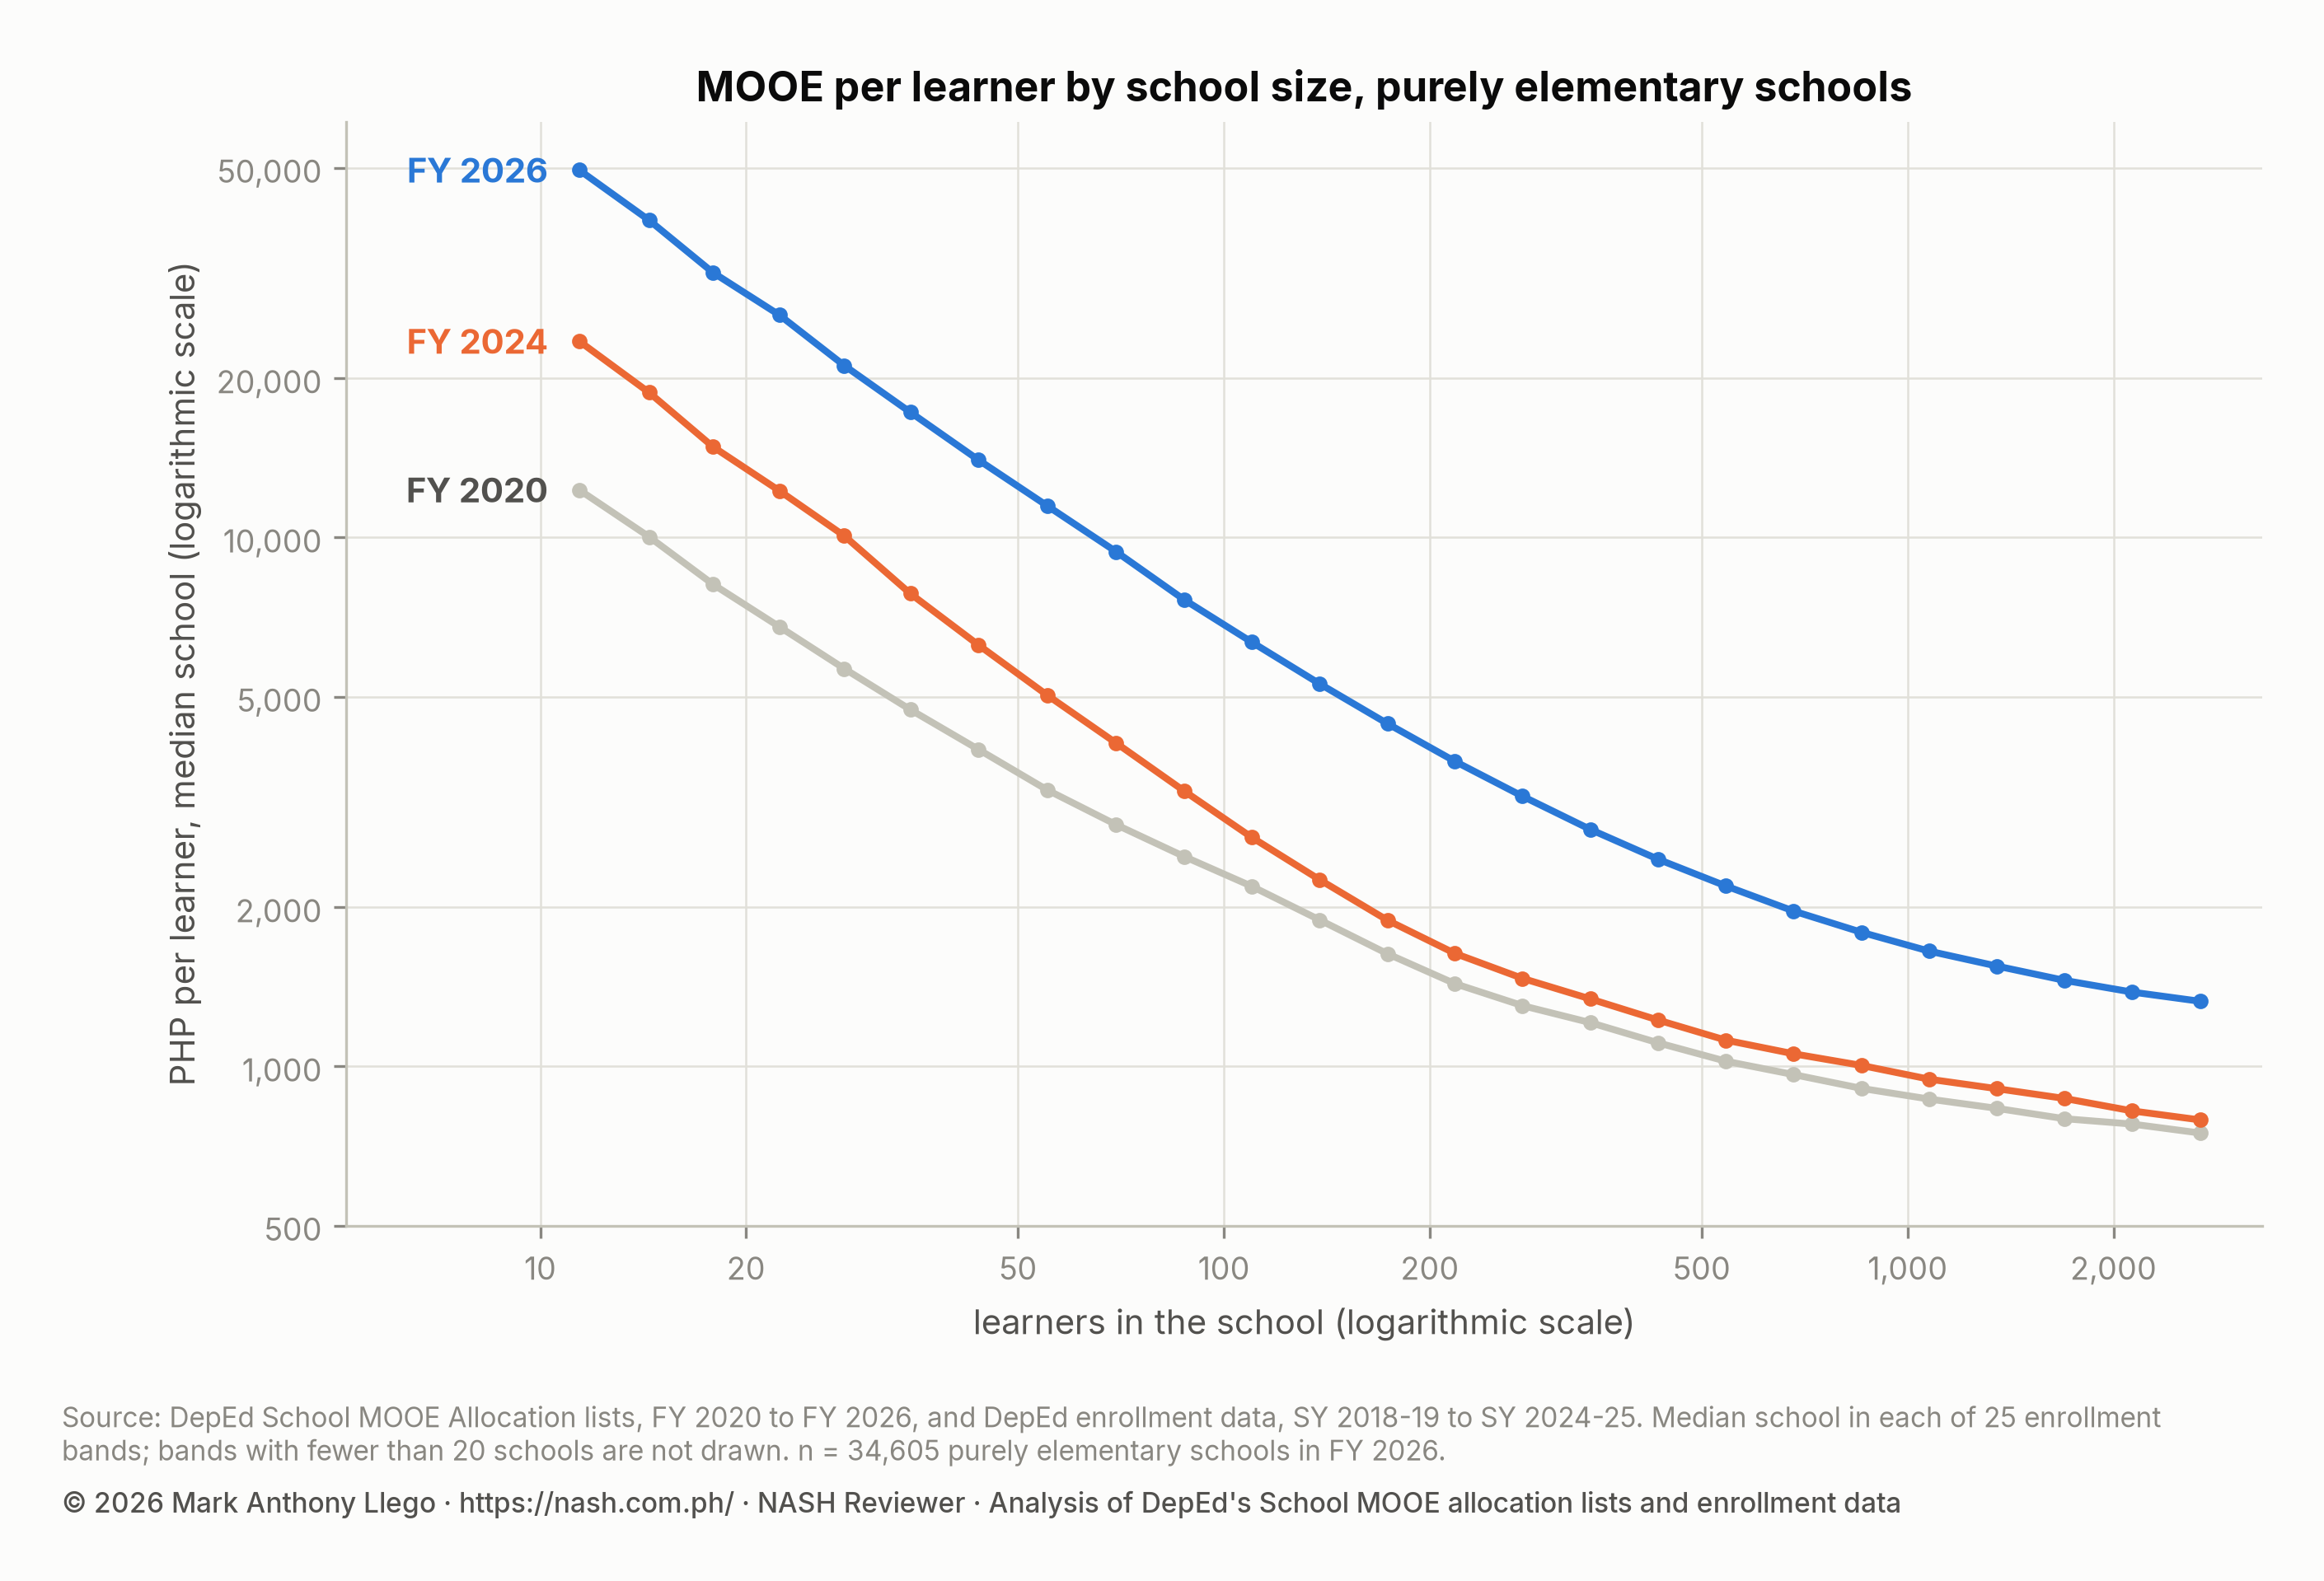
The fixed amount moved money toward small schools. Schools of 200 learners or fewer are 45.8% of schools and hold 10.7% of learners. They received 16.3% of the money in FY 2020, 17.3% in FY 2024 and 25.3% in FY 2026. Schools of more than 1,000 learners are 10.9% of schools and hold 50.6% of learners. Their share of the money fell from 43.0% in FY 2020 to 34.9% in FY 2026.
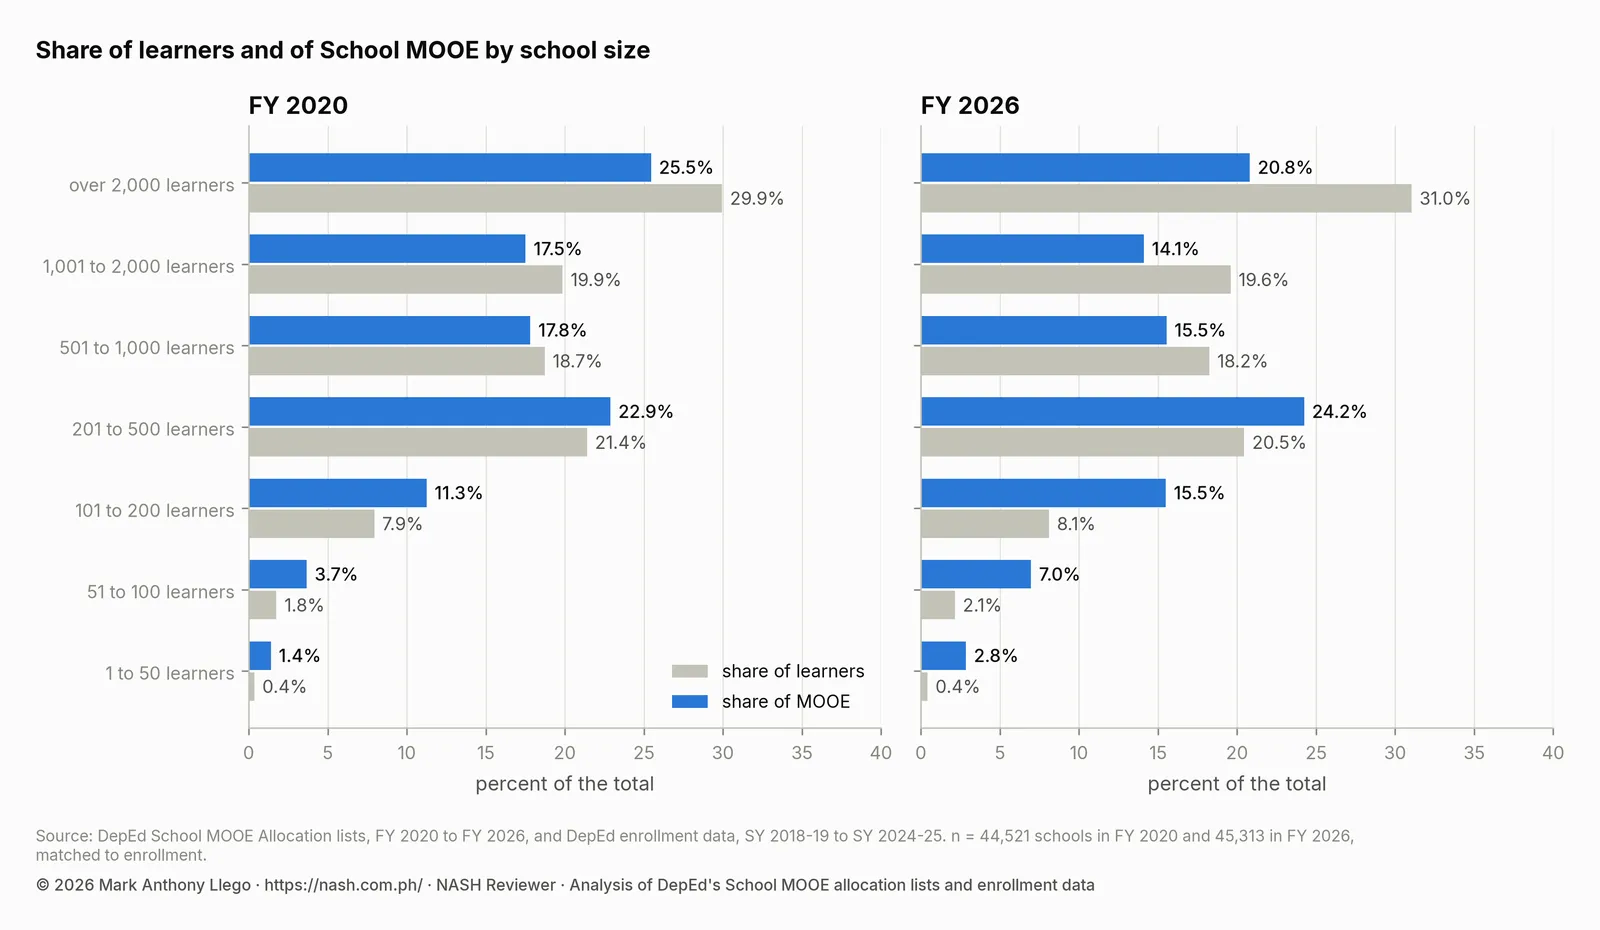
Large schools gained too, though less. From FY 2024 to FY 2026 half of the schools of more than 2,000 learners gained at least 33.8%, and half of the schools of 51 to 100 learners at least 130.9%. Seventeen of the 1,891 schools of more than 2,000 learners received fewer pesos in FY 2026 than in FY 2024, nine of them in the Division of Mandaluyong. Of the increase among schools on both lists, 36.0% went to schools of 200 learners or fewer.
Multigrade schools show the same effect. The 5,538 purely elementary schools with multigrade classes have a median of 64 learners and receive PHP 7,741 per learner in FY 2026, three times the PHP 2,578 of schools without them. Between two schools of the same enrollment, having multigrade classes changes the amount by less than a tenth of 1%. The formula pays for size, not for multigrade classes. Leading a small or multigrade school covers what that budget has to carry.
Is School MOOE spread more evenly than before?
The answer depends on the comparison. Between schools of the same size the lists are far more even than they were. Between learners in schools of different sizes they are less even.
Schools of the same size
Under the formula in use until FY 2024, two schools with the same enrollment could receive different amounts, because the formula also counted “the number of teachers and classrooms managed by the school, the number of graduating or completing students, and a fixed amount corresponding to basic needs of a school” (DO 008, s. 2019, Enclosure, Sec. I). The table takes purely elementary schools within narrow bands of enrollment and compares the school at the 90th percentile of allocation with the school at the 10th.
| Purely elementary schools with | FY 2020 | FY 2022 | FY 2024 | FY 2025 | FY 2026 |
|---|---|---|---|---|---|
| 95 to 105 learners | 1.22 times | 1.17 times | 1.19 times | 1.01 times | 1.01 times |
| 190 to 210 learners | 1.18 times | 1.14 times | 1.39 times | 1.02 times | 1.02 times |
| 475 to 525 learners | 1.18 times | 1.17 times | 1.40 times | 1.04 times | 1.04 times |
| 950 to 1,050 learners | 1.18 times | 1.18 times | 1.43 times | 1.06 times | 1.05 times |
Boncodin vs. Normative Formula: School MOOE Compared shows which schools the old formula favored: of two schools with the same learners, the one with more rooms and teachers.
In FY 2024 an elementary school of about 200 learners at the 90th percentile received PHP 412,000 and one at the 10th percentile PHP 297,000. In FY 2026 the two amounts are PHP 811,000 and PHP 794,000, and the small gap left is the difference between 190 and 210 learners.
A line fitted through the purely elementary schools of each list shows the change. It gives the amount a school would receive with no learners and the amount each learner adds.
| Fiscal year | Amount with no learners | Added by each learner | Share of the differences among schools that enrollment accounts for |
|---|---|---|---|
| FY 2020 | PHP 170,657 | PHP 686 | 98.7% |
| FY 2021 | PHP 160,503 | PHP 648 | 98.3% |
| FY 2022 | PHP 161,055 | PHP 681 | 98.9% |
| FY 2023 | PHP 168,660 | PHP 696 | 99.0% |
| FY 2024 | PHP 227,167 | PHP 722 | 96.5% |
| FY 2025 | PHP 470,856 | PHP 818 | 99.8% |
| FY 2026 | PHP 580,513 | PHP 1,111 | 99.9% |
The FY 2026 line matches the equation that reproduces the list school by school, PHP 580,573 plus PHP 1,110 for each learner. No DepEd issuance prints those amounts. For FY 2020 to FY 2024 the two numbers describe the pattern in the list; the formula then also counted teachers, classrooms and graduating learners. The amount with no learners more than tripled between FY 2023 and FY 2026, and the amount each learner adds rose by 60%.
For all schools together, enrollment and curricular offering account for 95.7% of the differences in the amount per learner in FY 2020 and 99.7% in FY 2026. The division a school belongs to adds 0.3 of a percentage point in FY 2020 and almost nothing in FY 2026.
Learners in schools of different sizes
Count each learner at their own school’s amount per learner. In FY 2020 the learner at the 90th percentile was in a school with PHP 1,933 per learner and the learner at the 10th percentile in one with PHP 760, a ratio of 2.5. In FY 2026 the two amounts are PHP 4,422 and PHP 1,367, a ratio of 3.2.
The Gini index summarizes the whole distribution in one number, from 0 when every learner’s school has the same amount per learner to 1 when one school has everything.
| Fiscal year | Gini index of the amount per learner | 90th percentile learner over 10th | Share of the inequality that lies between school-size bands |
|---|---|---|---|
| FY 2020 | 0.209 | 2.5 times | 37.8% |
| FY 2023 | 0.199 | 2.4 times | 42.3% |
| FY 2024 | 0.235 | 2.8 times | 44.6% |
| FY 2025 | 0.277 | 3.4 times | 75.0% |
| FY 2026 | 0.274 | 3.2 times | 82.8% |
The index rose from 0.209 to 0.274. The last column divides the inequality, measured with the Theil index, into the part between seven bands of school size and the part within them. In FY 2020 school size accounted for 37.8% of it. In FY 2026 it accounts for 82.8%.
Both readings describe the same design. The normative formula gives like schools like amounts, and it gives a learner in a small school far more than a learner in a large one. Whether a difference of that size matches what a small school costs to run is a question the data cannot answer. A review of the fixed amount and tiers by school size have been proposed; the guide to the formula sets the proposals out. Does School MOOE Reach Poor and Last Mile Schools? tests whether the money follows need, by Last Mile status, income class and poverty.
Other standard measures of the spread
Studies of school finance use a set of measures besides the Gini index. Each counts a learner at their own school’s amount per learner.
| Measure | FY 2020 | FY 2023 | FY 2024 | FY 2025 | FY 2026 |
|---|---|---|---|---|---|
| Coefficient of variation | 0.442 | 0.410 | 0.521 | 0.707 | 0.732 |
| McLoone index | 0.730 | 0.739 | 0.707 | 0.711 | 0.773 |
| Verstegen index | 1.349 | 1.304 | 1.395 | 1.539 | 1.624 |
| Federal range ratio | 2.11 | 2.00 | 2.65 | 3.63 | 3.42 |
| Median gap from what like schools receive | 4.9% | 4.6% | 8.5% | 0.6% | 0.1% |
| Learners in schools within 5% of what like schools receive | 50.4% | 53.2% | 30.9% | 71.5% | 84.5% |
- The coefficient of variation is the standard deviation divided by the mean. It rose from 0.442 to 0.732. One arts high school of 82 learners, listed at PHP 31.2 million, accounts for 0.05 of the FY 2026 figure; without it the coefficient is 0.681.
- The McLoone index compares what the lower half of learners receive with what they would receive if each were at the median; 1 means no learner is below the median. It rose from 0.730 to 0.773, so the lower half is closer to the median than it was.
- The Verstegen index does the same for the upper half; 1 means no learner is above the median. It rose from 1.349 to 1.624.
- The federal range ratio is the gap between the learner at the 95th percentile and the learner at the 5th, divided by the 5th. It was 2.11 in FY 2020 (PHP 2,219 against PHP 714) and is 3.42 in FY 2026 (PHP 5,648 against PHP 1,277).
- Like schools are schools of the same curricular offering and the same enrollment. The typical learner’s school was 4.9% from what like schools receive in FY 2020 and is 0.1% from it in FY 2026, and 84.5% of learners are now in schools within 5% of that amount, against 50.4% in FY 2020.
The measures agree on where the change is. The lower half of learners is more even than before, like schools are closer together, and the whole increase in the spread is at the top, among learners in small schools.
Why the Gini index rose
Three things can move the index: the schedule, meaning what a school of a given offering and enrollment receives; how learners are spread across schools; and how far schools sit from the schedule. Paying each year’s schools on the other year’s schedule separates the three.
| Change in the Gini index | FY 2020 to FY 2026 | FY 2023 to FY 2024 | FY 2024 to FY 2025 | FY 2025 to FY 2026 |
|---|---|---|---|---|
| Total | +0.065 | +0.037 | +0.042 | -0.003 |
| From the schedule | +0.065 | +0.028 | +0.042 | -0.004 |
| From enrollment across schools | +0.008 | +0.003 | +0.008 | +0.005 |
| From the spread around the schedule | -0.008 | +0.005 | -0.008 | -0.003 |
The schedule accounts for the whole rise. On the schedule of FY 2020, the schools of FY 2026 would have an index of 0.205 before any spread around the schedule, against 0.272 on their own schedule. The rise came in two steps, FY 2024 and FY 2025; the full formula of FY 2026 added none.
School MOOE per learner by region and division
Regions are shown with the boundaries of SY 2025-2026 in both years, so the Negros Island Region (NIR) has its own row for FY 2020. Region IX is shown without Sulu, which the lists cover in full only from FY 2026.
| Region | Schools, FY 2026 | Allocation, FY 2026 (PHP billion) | Per learner, FY 2020 | Per learner, FY 2026 | Median school’s allocation, FY 2026 | Median school’s enrollment | Schools with 200 learners or fewer |
|---|---|---|---|---|---|---|---|
| NCR | 827 | 3.40 | PHP 1,006 | PHP 1,674 | PHP 3,190,000 | 1,904 | 1.8% |
| CAR | 1,842 | 1.61 | PHP 1,933 | PHP 4,670 | PHP 697,500 | 102 | 77.3% |
| Region I | 2,865 | 3.34 | PHP 1,524 | PHP 3,153 | PHP 832,000 | 207.5 | 48.3% |
| Region II | 2,542 | 2.69 | PHP 1,588 | PHP 3,455 | PHP 781,000 | 173.5 | 57.5% |
| Region III | 3,744 | 5.76 | PHP 1,247 | PHP 2,388 | PHP 1,039,500 | 370 | 25.6% |
| Region IV-A | 3,576 | 6.52 | PHP 1,130 | PHP 2,108 | PHP 1,120,000 | 423 | 24.0% |
| MIMAROPA | 2,392 | 2.58 | PHP 1,494 | PHP 3,238 | PHP 818,000 | 198.5 | 50.5% |
| Region V | 3,873 | 4.58 | PHP 1,411 | PHP 3,005 | PHP 856,000 | 233 | 43.5% |
| Region VI | 2,835 | 3.24 | PHP 1,513 | PHP 3,255 | PHP 779,000 | 173 | 56.0% |
| NIR | 2,242 | 2.99 | PHP 1,326 | PHP 2,720 | PHP 935,000 | 270.5 | 35.4% |
| Region VII | 2,828 | 3.80 | PHP 1,318 | PHP 2,702 | PHP 905,000 | 246 | 42.2% |
| Region VIII | 4,191 | 4.14 | PHP 1,627 | PHP 3,768 | PHP 724,000 | 127 | 67.7% |
| Region IX | 2,557 | 2.89 | PHP 1,405 | PHP 3,084 | PHP 788,000 | 180 | 55.4% |
| Region X | 2,535 | 3.18 | PHP 1,329 | PHP 2,795 | PHP 876,000 | 227 | 45.2% |
| Region XI | 2,227 | 3.07 | PHP 1,272 | PHP 2,588 | PHP 939,000 | 273.5 | 37.5% |
| Region XII | 2,163 | 2.81 | PHP 1,339 | PHP 2,723 | PHP 907,000 | 257 | 38.0% |
| CARAGA | 2,105 | 2.29 | PHP 1,500 | PHP 3,330 | PHP 810,000 | 185 | 53.2% |
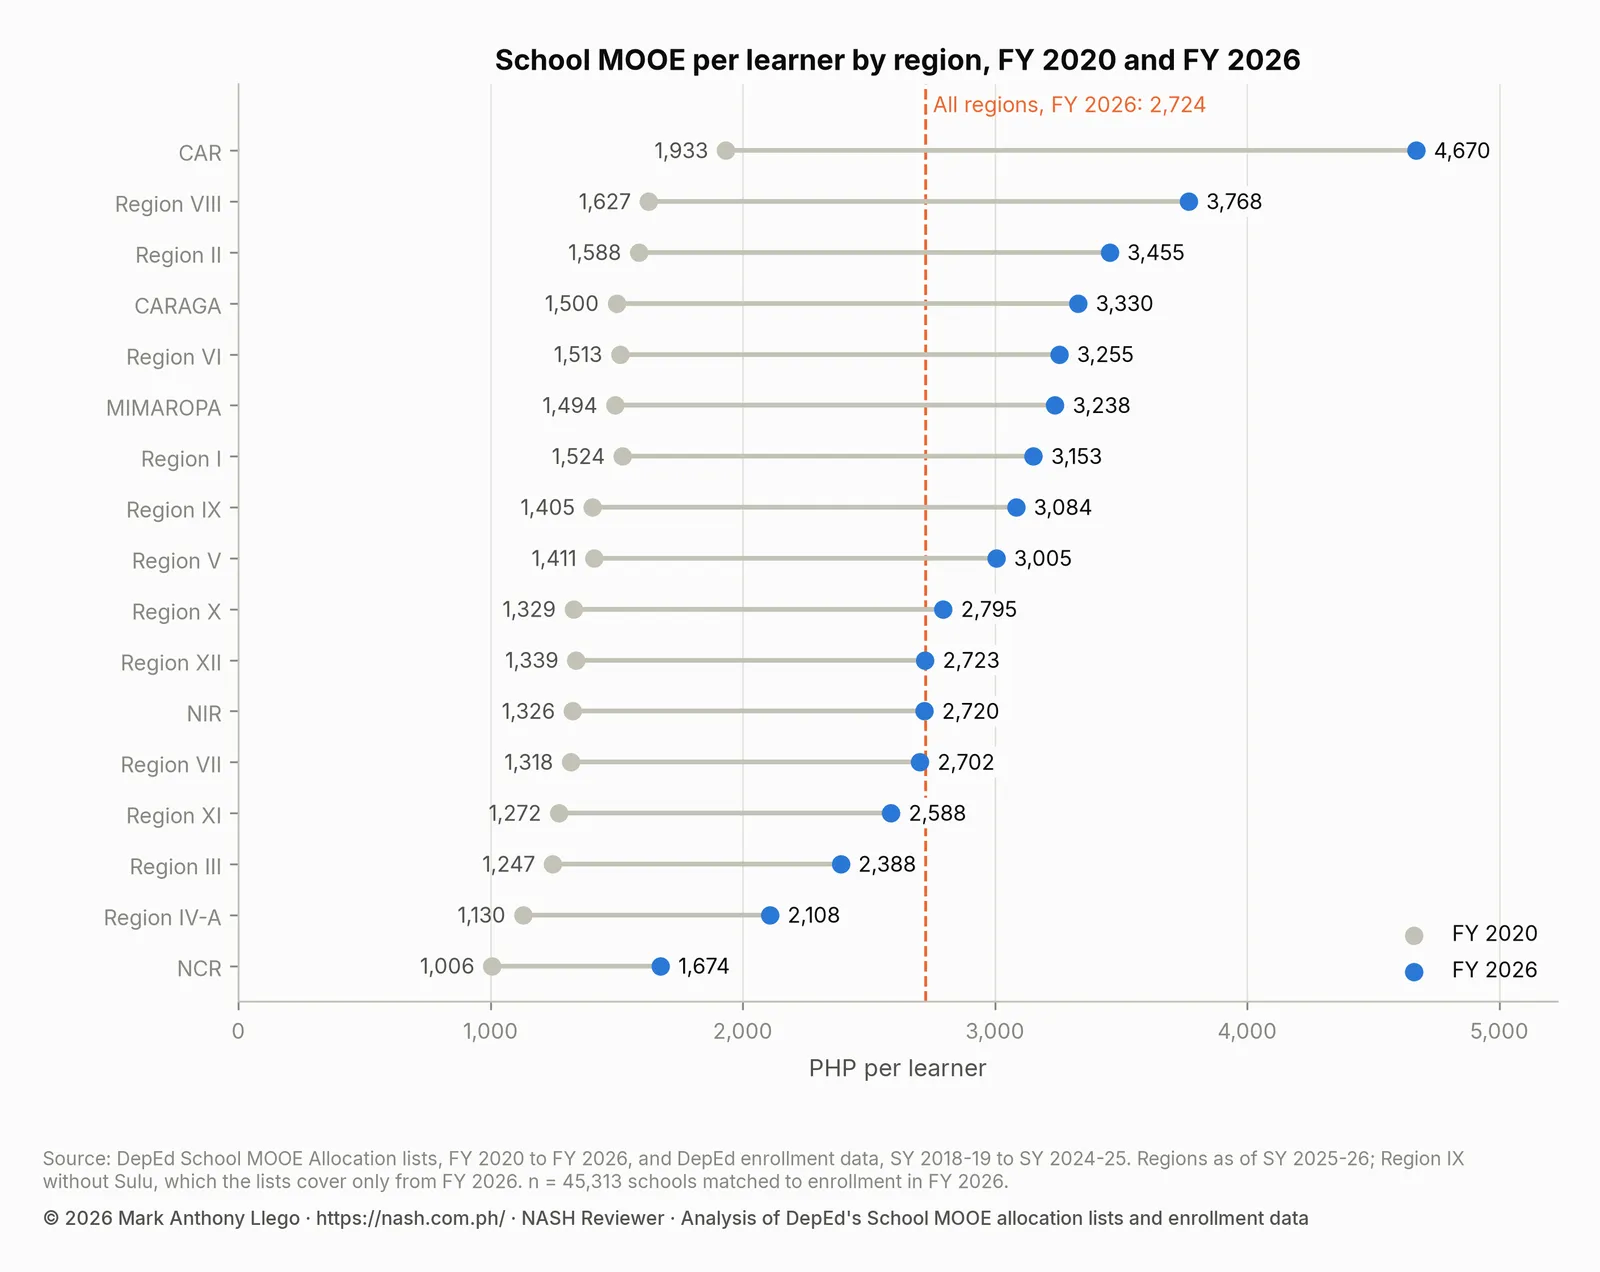
The order of the regions is the order of their school sizes. In CAR the median school has 102 learners and 77.3% of schools have 200 or fewer; its amount per learner is the highest. In NCR the median school has 1,904 learners; its amount per learner is the lowest, although its median school receives PHP 3.19 million. No region has a rate of its own in the formula.
The gap between regions widened with the formula. CAR received 1.9 times NCR’s amount per learner in FY 2020 and 2.8 times in FY 2026. NCR and Region IV-A hold 23.7% of learners and receive 16.8% of the money.
The 218 divisions on every list follow the same pattern: a division’s amount per learner rises with its share of schools of 200 learners or fewer (a correlation of 0.93).
| Lowest per learner, FY 2026 | Highest per learner, FY 2026 | ||
|---|---|---|---|
| Caloocan (NCR) | PHP 1,564 | Kalinga (CAR) | PHP 6,395 |
| Taguig and Pateros (NCR) | PHP 1,604 | Batanes (Region II) | PHP 6,278 |
| Antipolo City (Region IV-A) | PHP 1,621 | Mt. Province (CAR) | PHP 6,209 |
| Sta. Rosa City (Region IV-A) | PHP 1,622 | Apayao (CAR) | PHP 5,840 |
| Dasmariñas City (Region IV-A) | PHP 1,647 | Abra (CAR) | PHP 5,388 |
| Manila (NCR) | PHP 1,649 | Ifugao (CAR) | PHP 5,276 |
| General Trias City (Region IV-A) | PHP 1,658 | Samar (Region VIII) | PHP 4,878 |
| Quezon City (NCR) | PHP 1,660 | Maasin City (Region VIII) | PHP 4,676 |
| Pasig City (NCR) | PHP 1,677 | Dinagat Island (CARAGA) | PHP 4,592 |
| San Jose del Monte City (Region III) | PHP 1,680 | Benguet (CAR) | PHP 4,591 |
Sulu’s schools, in the first year all of them are on the list, receive PHP 3,144 per learner for 144,153 learners.
How each school’s allocation changed from year to year
The table follows the schools that are on two consecutive lists.
| From | To | Schools on both lists | Median change | Schools that received less | Schools that received more |
|---|---|---|---|---|---|
| FY 2020 | FY 2021 | 44,135 | -7.0% | 94.3% | 5.6% |
| FY 2021 | FY 2022 | 44,341 | +3.5% | 32.4% | 66.2% |
| FY 2022 | FY 2023 | 44,552 | +3.8% | 0.1% | 99.9% |
| FY 2023 | FY 2024 | 44,717 | +19.2% | 0.1% | 99.8% |
| FY 2024 | FY 2025 | 44,786 | +66.1% | 0.6% | 99.4% |
| FY 2025 | FY 2026 | 45,045 | +24.9% | 20 schools | all but 20 |
- FY 2021 was a cut for nearly every school. Of the schools on both lists, 94.3% received less than in FY 2020, and the middle 80% of schools lost between 3.6% and 7.2%.
- FY 2022 could still take money away. A third of schools (32.4%) received less than in FY 2021.
- From FY 2023 a decrease is rare. Fewer than 1 school in 100 has received less than the year before in any list since.
Over the whole period, 42,914 schools are on all seven lists. Half of them received at least 144.3% more in FY 2026 than in FY 2020, or 89.5% more after inflation. Three in four (73.7%) at least doubled in pesos, and 41.6% at least doubled after inflation. Only 61 schools received fewer pesos in FY 2026 than in FY 2020, and 508 (1.2%) received less after inflation. Three years earlier the record was the reverse: between FY 2020 and FY 2023 half of these schools gained no more than 1.1% in pesos, a loss of at least 13.3% after inflation, and nine in ten (89.7%) lost purchasing power.
The gain from FY 2024 to FY 2026 depended on what a school offers.
| Curricular offering in FY 2026 | Schools | Median change, FY 2024 to FY 2026 |
|---|---|---|
| Purely elementary | 34,499 | +119.0% |
| Purely junior high | 1,198 | +66.2% |
| Elementary and junior high | 1,307 | +49.9% |
| Elementary to senior high (all levels) | 801 | +40.4% |
| Junior high with senior high | 6,559 | +29.0% |
| Purely senior high | 238 | +27.4% |
Each year about 300 to 500 school IDs enter the lists and about 200 to 500 leave them.
How a school’s allocation follows its own enrollment
The tables above compare different schools. Following the same school over time shows how its allocation moved when its own enrollment changed. The table gives the change in allocation that went with 10% more learners in the same school, beyond the change common to all schools that year.
| School’s starting enrollment | FY 2020 to FY 2023 | FY 2025 to FY 2026 |
|---|---|---|
| 100 learners or fewer | +1.6% | +0.9% |
| 101 to 300 learners | +2.9% | +2.4% |
| 301 to 1,000 learners | +3.9% | +4.6% |
| Over 1,000 learners | +4.5% | +5.8% |
| All schools | +2.8% | +2.1% |
The response grows with the school’s size, and the figure for all schools sits near the small schools’ because most schools are small.
In FY 2026 the size of the response is the fixed amount at work. Under the elementary equation, 10% more learners adds about 1.0% to the allocation of a school of 60 learners, 2.5% for the median school of 179 and 5.9% for a school of 750.
Two lists hardly moved with enrollment. A 10% change in a school’s enrollment went with a change of 0.8% in its FY 2021 allocation and 0.9% in its FY 2024 allocation. Each of those lists tracks the enrollment count of a year earlier more closely.
Implementing units and curricular offerings
An implementing unit (IU) keeps its own books of accounts and receives its cash allocation directly from the Department of Budget and Management. A non-IU has no financial staff of its own and receives its school MOOE from the Schools Division Office as a cash advance (DO 008, s. 2019, Enclosure, Sec. V.B.2). The FY 2026 list tags 2,679 schools as IUs, 5.8% of schools, and none of them is a purely elementary school.
| FY 2020 | FY 2024 | FY 2026 | |
|---|---|---|---|
| Implementing units | 2,570 | 2,646 | 2,679 |
| Their share of schools | 5.7% | 5.9% | 5.8% |
| Their share of learners | 23.8% | 25.9% | 24.7% |
| Their share of School MOOE | 27.4% | 28.5% | 21.1% |
| Per learner, implementing units | PHP 1,528 | PHP 1,729 | PHP 2,331 |
| Per learner, other schools | PHP 1,267 | PHP 1,511 | PHP 2,856 |
Until FY 2024 an IU received more per learner than other schools. Since FY 2025 it receives less, because IUs are large secondary schools and the new money went mostly to small elementary ones. Implementing Unit or Non-IU: How a School Gets Its MOOE explains the two routes the money takes.
The lists also record a change in what schools offer. Schools with an elementary and a junior high amount rose from 687 in FY 2020 to 1,704 in FY 2026, and schools with all three levels from 405 to 833, as more schools were listed as integrated schools, most of them under new school IDs. Purely elementary schools fell from 35,841 to 35,029.
| Curricular offering, FY 2026 | Schools | Allocation (PHP billion) | Share of the total | Median school’s allocation | Per learner |
|---|---|---|---|---|---|
| Purely elementary | 35,029 | 33.75 | 56.9% | PHP 779,000 | PHP 2,794 |
| Purely junior high | 1,375 | 2.35 | 4.0% | PHP 923,000 | PHP 2,695 |
| Purely senior high | 262 | 0.61 | 1.0% | PHP 1,504,500 | PHP 3,226 |
| Elementary and junior high | 1,704 | 2.22 | 3.7% | PHP 1,117,000 | PHP 2,779 |
| Junior high with senior high | 6,598 | 18.73 | 31.6% | PHP 1,834,000 | PHP 2,614 |
| Elementary to senior high | 833 | 1.69 | 2.8% | PHP 1,611,000 | PHP 2,555 |
What this means for school heads
- Know your school’s figure and its history. The seven-year file below has one row for each school, with its amount in every year and the enrollment behind it. For a school without financial staff, the order gives the Schools Division Office this duty: “Inform in writing the heads of ESs and SSs without financial staff of their annual MOOE allocation” (DO 008, s. 2019, Enclosure, Sec. V.C.2.1). Plan on that notice. A difference between it and DepEd’s list is a question to raise with the SDO.
- Compare with schools of your size and offering, not with an average. The national PHP 2,724 per learner describes few actual schools. Under the FY 2026 equation an elementary school of 150 learners receives about PHP 5,000 per learner and one of 1,500 about PHP 1,500. A division’s or region’s average says how large its schools are, not how well they are funded.
- Read the amount against prices. An allocation that rises more slowly than prices is a cut. From FY 2020 to FY 2023 nine in ten schools lost purchasing power, although more than half received more pesos. Keep the school’s own record of what electricity, water, internet and supplies cost each year, and plan the School Improvement Plan’s operating budget from that record.
- Plan on the enrollment already counted. FY 2026 amounts follow SY 2024-2025 enrollment. A school that is growing is funded for the school it was, and a school that is shrinking keeps its fixed amount.
- For a large school, MOOE per learner is thin by design. A school of more than 2,000 learners has PHP 1,826 per learner for the year. Its head can cite that figure when asking the Local School Board for Special Education Fund support; the guide to the Local School Board and the Special Education Fund covers how that money is asked for.
- An allocation is not cash on hand. The lists show what the GAA sets aside for each school. Release, cash advances, liquidation and the rules on what MOOE may buy are in DepEd School MOOE.
Reading a school’s allocation this way serves the financial management strand of the Philippine Professional Standards for School Heads, whose indicators begin with “knowledge and understanding of policies, guidelines and issuances in managing finances such as allocation, procurement, disbursement and liquidation aligned with the school plan” (indicator 2.2.1). PPSSH Domain 2: Managing School Operations covers the strand, and How to Read DepEd Data covers medians, ratios and denominators.
How these numbers were made
The seven lists were stacked into one table of 315,321 school rows. No amount was changed. A blank amount cell was read as zero, which matters mostly for FY 2020, where the list leaves the junior and senior high cells of elementary schools empty. Every total equals the sum of its three level amounts, and every amount is a whole multiple of PHP 1,000.
Each school row was joined by school ID to DepEd’s enrollment data for public schools. At least 99.7% of each year’s school rows found a match. The enrollment used is that of the school year that ended before the budget year. It tracks the amounts more closely in every year than the enrollment of the school year in session. In FY 2021 and FY 2024 the count of a year earlier still tracks them slightly more closely. Using the school year in session changes the FY 2026 amount per learner from PHP 2,724 to PHP 2,788 and leaves every comparison here standing.
Regions are shown with the boundaries of SY 2025-2026. Amounts in FY 2020 pesos use the Philippine Statistics Authority’s consumer price index for all income households (2018=100), averaged over each calendar year, with January to October for 2026.
The lists count every funded school, so the figures are counts and not estimates from a sample, and no margin of sampling error applies to them. The line fitted through elementary schools is ordinary least squares, and its table’s last column is the R-squared of that line. The shares of differences “accounted for” among all schools are the R-squared of a regression of the logarithm of the amount per learner on the logarithm of enrollment, fitted flexibly for each curricular offering. The Gini and Theil indices weight each school by its learners.
How closely schools follow the lines
- Lines at the 10th and 90th percentiles. Quantile regression fits the line that has a chosen share of schools below it at every enrollment. For purely elementary schools in FY 2026 the lines at the 10th and 90th percentiles are PHP 580,180 plus PHP 1,110 for each learner and PHP 580,980 plus PHP 1,110: parallel and PHP 800 apart, the distance that rounding to the nearest PHP 1,000 puts between the 10th and 90th percentiles. In FY 2024 they are PHP 187,185 plus PHP 629 and PHP 254,795 plus PHP 878, which puts the upper line at 1.38 times the lower for a school of 300 learners.
- Influential schools. Leaving out the schools with the most pull on the line, 1,634 in FY 2020 and 56 in FY 2026, moves the FY 2020 line from PHP 170,657 plus PHP 686 to PHP 162,809 plus PHP 707, and the FY 2026 line by PHP 66 and less than PHP 1 for each learner.
- Schools far from the schedule. In FY 2026, 828 of 45,313 schools (1.8%) receive over 10% more or less than schools of the same offering and enrollment: 678 more and 150 less. Four in five of them (81.8%) offer senior high school. About 680 of them carry a level amount held at the FY 2025 amount plus 3%. The share of schools that far from the schedule was 20.0% in FY 2020 and 37.1% in FY 2024. The largest gap is the arts high school of 82 learners listed at PHP 31.2 million.
- Regional prices. Prices rose 25.3% in NCR and 32.6% in Region XI from 2020 to 2026, against 28.9% for the country. Restating each region’s amount per learner with its own index changes its real increase by no more than 4.4 percentage points and leaves the order of the regions almost the same (a rank correlation of 0.98). The FY 2026 total in FY 2020 pesos becomes PHP 45.82 billion, 57.1% above FY 2020, in place of PHP 46.04 billion and 57.8%.
What like schools receive is a curve of allocation on enrollment fitted for each curricular offering. A school’s gap is the distance of its amount from that curve, and the median counts each school by its learners. The split of the change in the Gini index averages the two orders in which the schedule and the enrollment can be swapped, so it does not depend on the order; its parts add up to the total before rounding. The within-school figures come from a regression with school and year fixed effects for FY 2020 to FY 2023, and from year-to-year changes among schools of the same offering and starting enrollment for the other years, each fitted within a band of school size.
Limits
- Allocations, not releases or spending. The lists say what each school was allotted under the GAA. They do not say when the money reached the school, or how much of it was spent and on what.
- The Bangsamoro region is not in the lists. Its schools appear only as 154 senior high rows in FY 2020. Cotabato City is in the FY 2020 list only, and Sulu’s schools enter in FY 2026. Comparisons across years here leave those rows out.
- One FY 2025 row is not a school. The list has PHP 12 million under “Division Office - Proper” in the Division of Mandaluyong. It is left out of the school counts and totals here, which is why FY 2025 is PHP 48.32 billion for 45,229 schools.
- The lists are smaller than the budget DepEd reports. DepEd’s September 24, 2026 release puts the amount set aside for school operations in 2026 at PHP 60.89 billion. The FY 2026 list adds up to PHP 59.35 billion.
- School IDs are not permanent. A school that changes its ID, merges or splits appears as one school leaving and another entering. Five school rows of FY 2020 have no usable ID.
- Other money is not counted. School MOOE is one source. Local government funds, donations, canteen proceeds and program funds are outside the lists.
Frequently asked questions
How much is the School MOOE budget for 2026?
DepEd’s School MOOE allocation list for FY 2026 totals PHP 59.35 billion for 45,801 public schools: PHP 35.70 billion for elementary, PHP 16.15 billion for junior high school and PHP 7.50 billion for senior high school. The FY 2025 list totals PHP 48.32 billion and the FY 2020 list PHP 29.17 billion.
How much MOOE does a public school receive per learner?
In FY 2026 the lists come to PHP 2,724 per learner: PHP 2,748 in elementary, PHP 2,544 in junior high school and PHP 3,061 in senior high school, using SY 2024-2025 enrollment. The amount depends heavily on school size. Schools of 50 learners or fewer receive PHP 18,598 per learner and schools of more than 2,000 receive PHP 1,826.
Why does a small school get more MOOE per learner than a big school?
Every school receives a fixed amount for its curricular offering before learners are counted: PHP 580,573 for a purely elementary school, by DepEd’s FY 2026 list. Divided among 60 learners, that fixed amount is far more per learner than when divided among 2,000. The guide to the normative formula gives the six equations.
Which region receives the most School MOOE per learner?
CAR, at PHP 4,670 per learner in FY 2026, followed by Region VIII (PHP 3,768) and Region II (PHP 3,455). NCR is lowest at PHP 1,674, then Region IV-A at PHP 2,108. The order follows school size. CAR’s median school has 102 learners and NCR’s has 1,904.
Where can I find my school’s MOOE allocation?
DepEd posts each year’s list on its transparency page, and the FY 2026 list has a page of its own. The by-school file in the next section puts all seven years in one row for each school. A school without financial staff is also informed of its annual allocation in writing by the Schools Division Office.
Download the data
The seven lists, cleaned and stacked, are free to download. The amounts are DepEd’s, unchanged.
- School MOOE by school, FY 2020 to FY 2026 (Excel, 6.0 MB): one row for each of 47,706 school IDs, with the allocation in each of the seven years, the enrollment behind each, the FY 2026 amount per learner and the change since FY 2024. The same table is available as CSV (gzip, 2.1 MB).
- All rows of the seven lists (CSV, gzip, 10.1 MB) or Parquet (8.9 MB): 315,322 rows, one for each school and fiscal year, with the elementary, junior high and senior high amounts, one spelling for each region and division, the implementing-unit tag, the curricular offering, the enrollment of the school year the amounts follow, and the workbook row each came from.
- Codebook (CSV): every column of every file.
- Cleaning log (CSV) and rule counts (CSV): the 40 row-level changes, each with its workbook row, and how many rows or cells each rule touched in each year.
- Division crosswalk (CSV): every region, division name and division code printed in the lists, and the FY 2026 division each maps to.
- Analysis tables (ZIP): the tables behind the charts and figures above, including all 218 divisions, and the price index used for FY 2020 pesos, for the country and by region.
- README, terms of use and checksums.
What was cleaned: 1,064 empty rows inside the sheets were dropped; region names printed three ways were given one spelling each; division names and codes were mapped to the FY 2026 division; two school IDs printed for two schools each in FY 2020 were kept for the school that holds the ID in the other lists; and 36 rows with no school ID received the ID the same school carries in another year’s list.
The data files follow DepEd’s terms of use, which ask users to credit DepEd as the source. The charts, the codebook and the documentation may be reused only with written permission: email support@nash.com.ph. The enrollment data behind the amounts per learner is documented in Download Cleaned DepEd School Data.
Sources
DepEd issuances and data
- DepEd Order No. 008, s. 2019, Revised Implementing Guidelines on the Direct Release, Use, Monitoring and Reporting of Maintenance and Other Operating Expenses Allocation of Schools, Including Other Funds Managed by Schools (May 2, 2019), Enclosure, Secs. I, V.B and V.C.
- DepEd Order No. 024, s. 2020, National Adoption and Implementation of the Philippine Professional Standards for School Heads (September 7, 2020), indicator 2.2.1.
- DepEd, School MOOE Allocation lists under the General Appropriations Act, from the DepEd transparency page: FY 2020, FY 2021, FY 2022, FY 2023, FY 2024, FY 2025 and FY 2026.
- DepEd, enrollment data by school, SY 2018-2019 to SY 2024-2025, and its school files for SY 2023-2024 (multigrade classes).
- DepEd press releases: Angara, nagdagdag ng pondo para palakasin ang classroom resources (April 13, 2026) and P61B sa operasyon ng public school inilaan sa 2027 – Angara (September 24, 2026).
Other data and methods
- Philippine Statistics Authority, Consumer Price Index for All Income Households by Commodity Group (2018=100), January 2018 to October 2026, all items, Philippines and regions.
- Berne, R., and Stiefel, L. (1984). The Measurement of Equity in School Finance: Conceptual, Methodological, and Empirical Dimensions. Johns Hopkins University Press.
Analysis and charts by Mark Anthony Llego for NASH Reviewer. Sources: DepEd’s School MOOE allocation lists for FY 2020 to FY 2026 and its enrollment data; DepEd Order No. 008, s. 2019; the Philippine Statistics Authority’s consumer price index. Charts may be reused only with written permission from support@nash.com.ph.