The LGU Early Childhood Report Card of the Second Congressional Commission on Education (EDCOM II) gives a city, municipality or province three figures: stunted children aged 0–2, barangays without a child development center (CDC), and Grade 1–3 learners struggling to read. As shown on 13 November 2026, the city and municipality card counts only the LGU’s barangays that lack a CDC and the schools located in those barangays. So every card shows 100% of barangays without a CDC, the reading figure, where the card shows one, covers a median of 7.4% of the LGU’s learners, and the 684 cities and municipalities where every barangay has a CDC cannot be selected at all.
The card draws on the same data as EDCOM II’s Early Childhood (ECCD) Dashboard: Operation Timbang Plus (OPT Plus) 2025 for stunting, the DILG Community-Based Monitoring System (CBMS) list of barangays without a CDC, and DepEd’s Comprehensive Rapid Literacy Assessment (CRLA) at the end of SY 2025-26. EDCOM II’s LGU Playbook asks local officials to use these data, and its template ordinances and resolutions are designed so that each LGU can cite its own figures from the EDCOM Dashboard (p. 15).
What follows explains what each figure on the card measures, where it differs from the LGU as a whole, and where to find each LGU’s figures over all its barangays and schools. A downloadable table gives them for all 1,639 cities and municipalities with CRLA results. EDCOM’s card is different from DepEd’s School Report Card, which School Report Cards and the Transparency Board covers.
Key findings
- Of the 1,639 cities and municipalities with CRLA results, 955 can be selected on the city and municipality card and 684 (41.7%) cannot; every one of the 684 has a CDC in every barangay, and together they hold 1,706,534 (33.3%) of the learners assessed (EDCOM II report card, 13 November 2026).
- Every city and municipality card shows 100% of barangays without a CDC. Across the 955 LGUs with a card, the true share has a median of 9.1%, and only Pandag, Maguindanao del Sur (8 of 8 barangays), is at 100% (DILG CBMS list, 17 September 2025).
- The reading figure counts only schools located in barangays without a CDC: 2,168 of the 24,038 schools with CRLA results in those 955 LGUs, and 354,579 of 3,421,121 learners assessed (10.4%). In 171 cards it is blank because no school with CRLA results lies in those barangays (CRLA, end of SY 2025-26).
- Of the 784 cards with a reading figure, 298 (38.0%) differ from the LGU’s own share of struggling readers by more than 5 percentage points and 119 (15.2%) by more than 10; 153 (19.5%) rest on fewer than 50 learners.
- The stunting figure covers the whole LGU but divides stunted children by children of normal height, so it is higher than the share of children classified in every LGU with any stunted child: 4.3% nationally against 4.1% (OPT Plus 2025).
- The provincial card adds up only the LGUs the city card offers: for Ilocos Norte it shows 5.9% stunting, 100% of barangays without a CDC and 9.8% struggling readers, against 4.7%, 9.3% and 9.2% across all 23 of the province’s cities and municipalities.
What the LGU Early Childhood Report Card shows
The report card has two tabs. On City/Municipality Report Card, a user picks a region, a province and a city or municipality, and the card fills three boxes:
| Box on the card | Source line on the card | What the number is meant to show |
|---|---|---|
| “STUNTED CHILDREN (0-2 YEARS OLD)” | “DOH-NNC OPT 2025” | The share of young children who are too short for their age |
| “BARANGAYS WITHOUT CHILD DEVELOPMENT CENTER (CDC)” | “DILG CBMS 2025” | The share of the LGU’s barangays with no CDC |
| “CHILDREN STRUGGLING TO READ (GRADES 1-3)” | “DepEd CRLA EOSY25-26” | The share of Grade 1–3 learners at the two lowest CRLA levels |
Under the boxes the card adds: “Indicators reflect the most recent available data from national sources. Data should be interpreted together with local context and used to guide planning and prioritization.” The Provincial Report Card tab shows the same three boxes for a province, with a bar for each of its cities and municipalities under “STUNTING %”, “NO CDC %” and “STRUGGLING TO READ %”.
The ECCD Dashboard gives the same three figures with a comparison against the national average. With nothing selected, it shows 42,010 barangays, 4.3% of children 0–2 stunted “(129.8k out of 3M children 0-2 years old)” and 11.0% of barangays without a CDC “(4.6k out of 42k barangays)”. The data behind both are dated on the dashboard: OPT Plus 2025 as of 2 March 2026, the CRLA end of SY 2025-26 as of 10 May 2026, and the CBMS list as of 17 September 2025.
The national CDC figure, 11.0%, is the share of all barangays. The national stunting figure has the denominator problem described below. The larger problems begin when one LGU is selected.
Which cities and municipalities can get a report card
The City/Municipality list on the card offers only LGUs that have at least one barangay on the DILG list of barangays without a CDC. Of the 1,639 cities and municipalities with CRLA results, 955 are offered and 684 are not. Every one of the 684 has a CDC in every barangay, which is good news for those towns, but it means their officials cannot get a card for their stunting or reading results. Selecting one through a link opens a blank card. The ECCD Dashboard’s City/Municipality filter offers the same list.
The 684 are not small or few. They hold 1,706,534 of the 5,127,655 learners assessed in the 1,639 LGUs (33.3%) and 1,005,501 of the 3,137,385 children under 2 classified in OPT Plus (32.0%). They include the cities of Antipolo (43,211 learners assessed), General Santos, Parañaque, Las Piñas and Muntinlupa, and towns with very high shares of struggling readers, such as Sibutu, Tawi-Tawi (59.9%) and Talaingod, Davao del Norte (49.6%). Pooled, their shares of struggling readers (10.4%) and stunting (4.2%) are close to those of the LGUs with a card (9.8% and 4.1%).
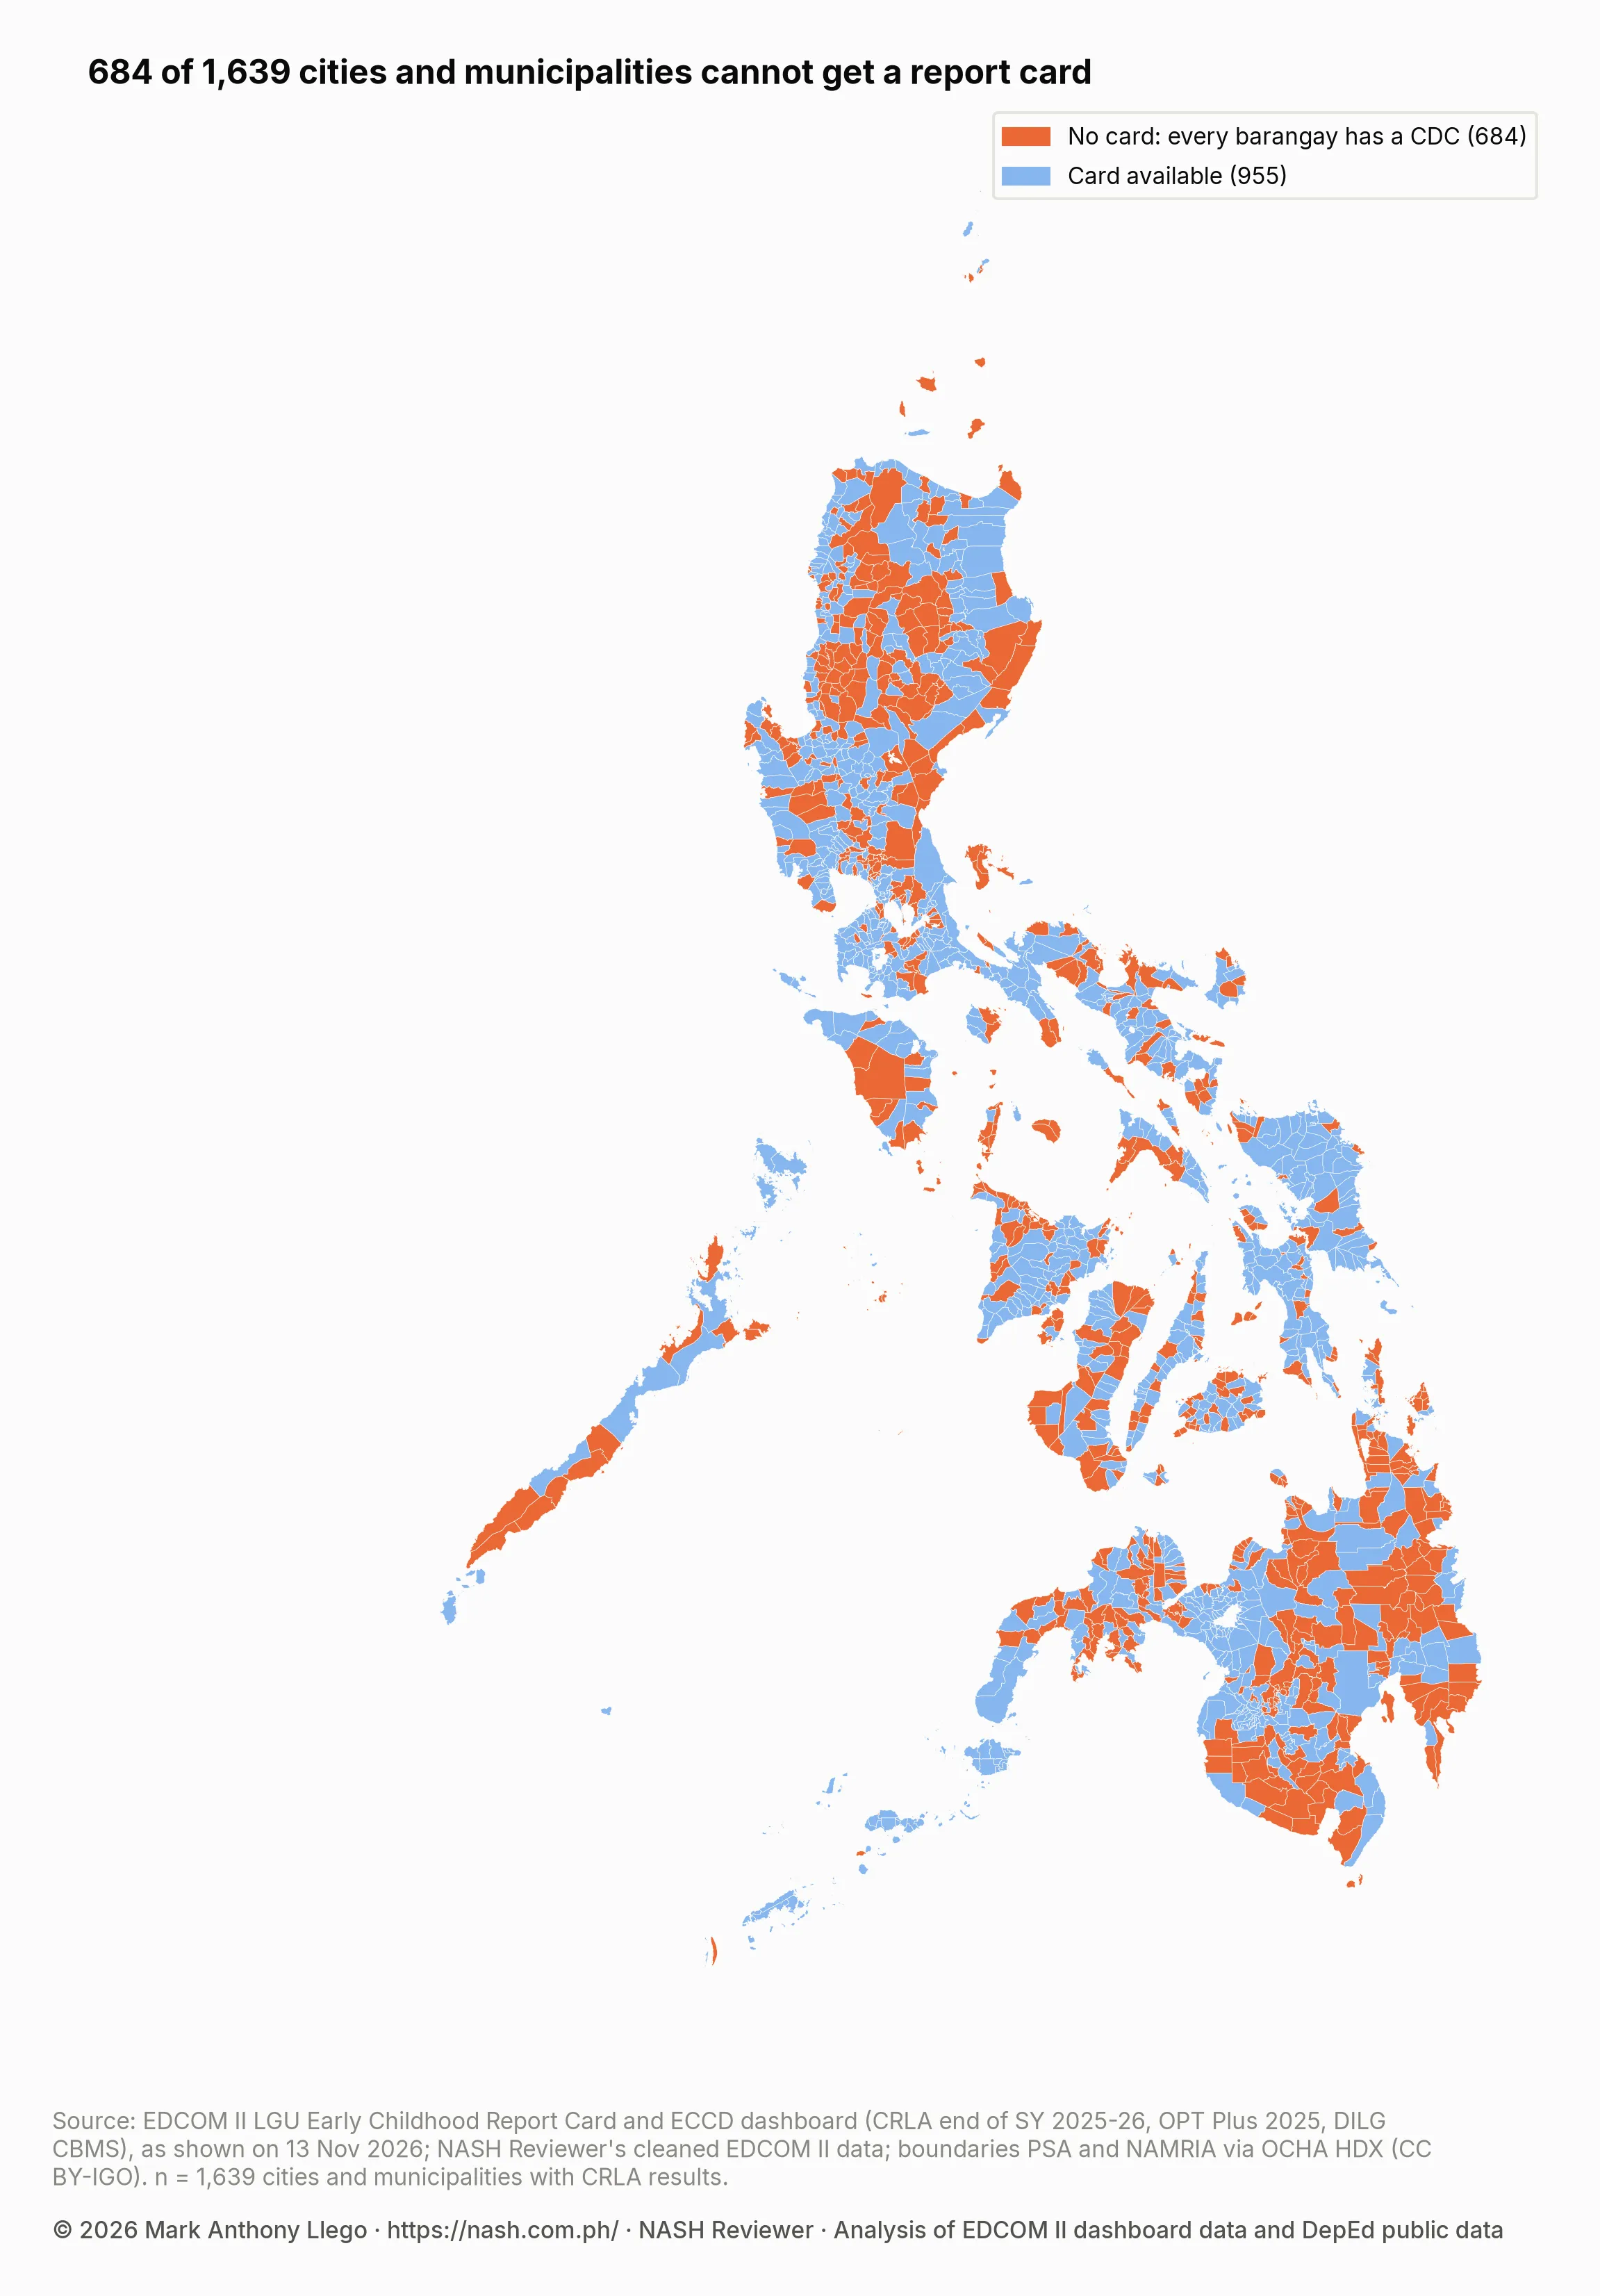
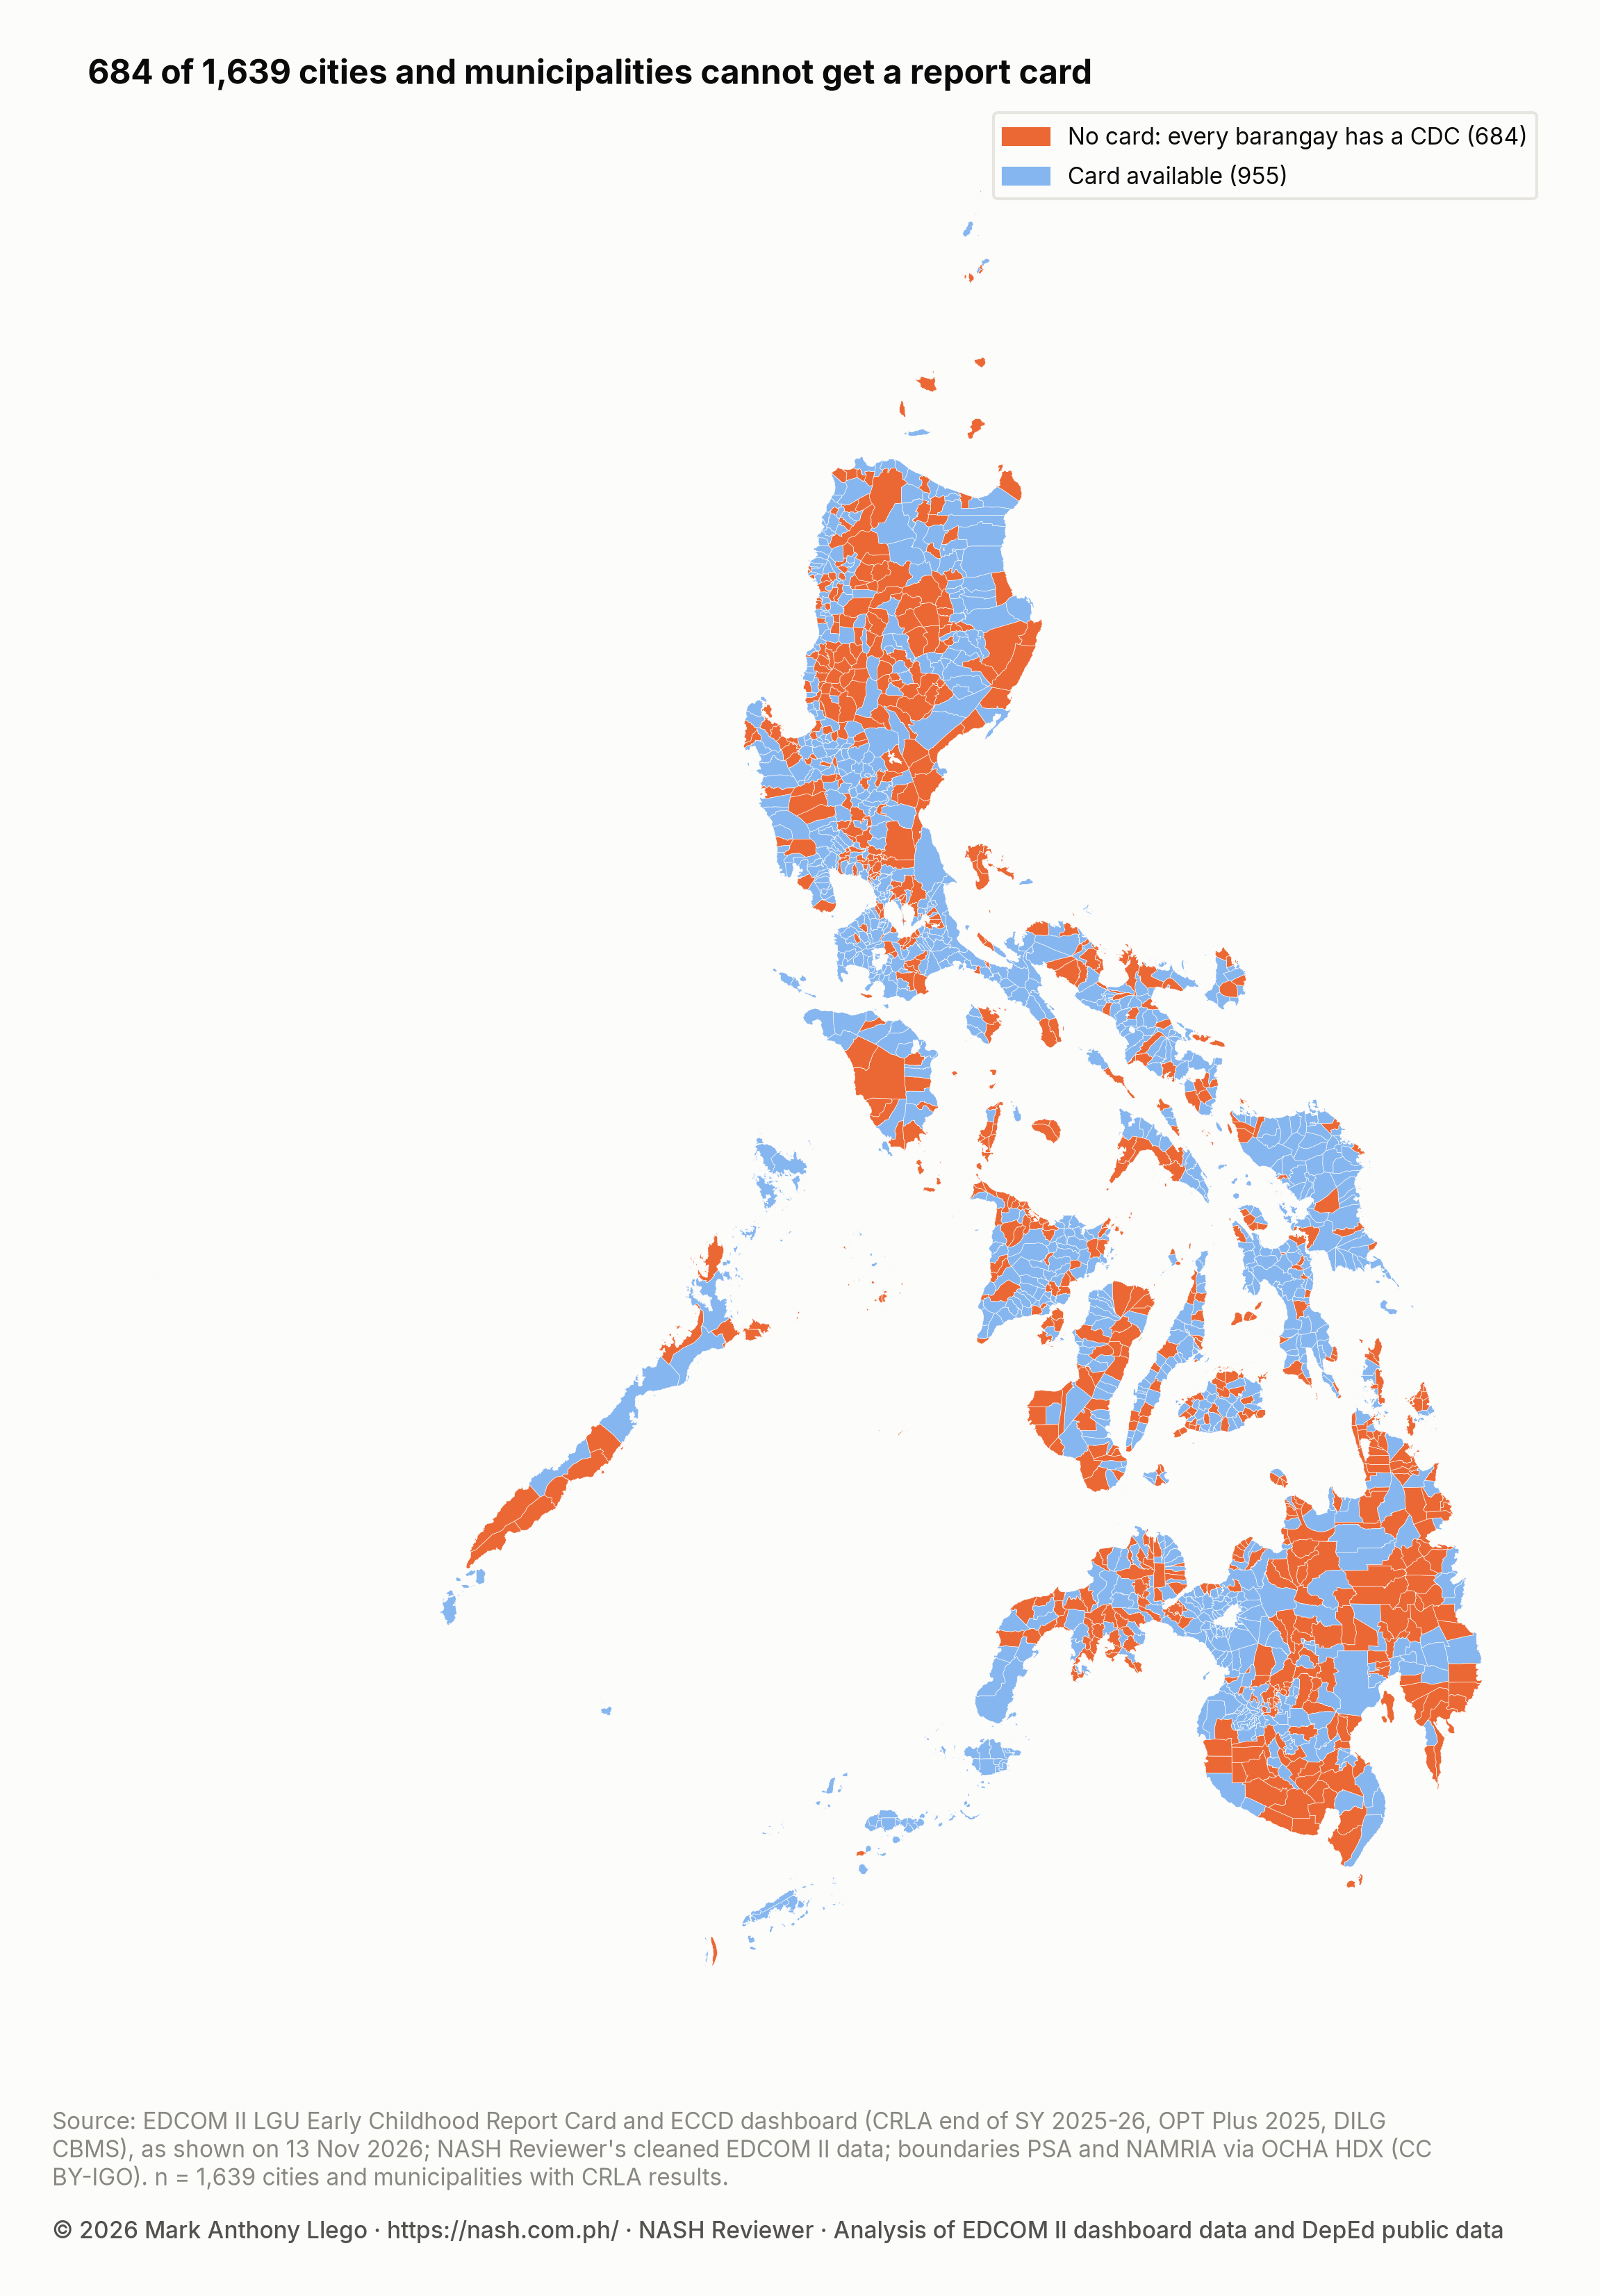
How many LGUs are left out depends on how far a region has gone in building CDCs:
| Region | Cities and municipalities | Without a card | Share without a card |
|---|---|---|---|
| Region XII | 49 | 35 | 71.4% |
| Caraga | 73 | 52 | 71.2% |
| CAR | 77 | 50 | 64.9% |
| Region XI | 49 | 28 | 57.1% |
| MIMAROPA | 73 | 41 | 56.2% |
| Region X | 93 | 52 | 55.9% |
| Region IX | 89 | 43 | 48.3% |
| NIR | 63 | 30 | 47.6% |
| Region VII | 101 | 45 | 44.6% |
| Region II | 93 | 40 | 43.0% |
| Region VI | 101 | 41 | 40.6% |
| Region I | 125 | 50 | 40.0% |
| Region III | 130 | 52 | 40.0% |
| Region V | 114 | 41 | 36.0% |
| Region IV-A | 142 | 38 | 26.8% |
| Region VIII | 143 | 35 | 24.5% |
| NCR | 17 | 3 | 17.6% |
| BARMM | 107 | 8 | 7.5% |
Why every card shows 100% of barangays without a CDC
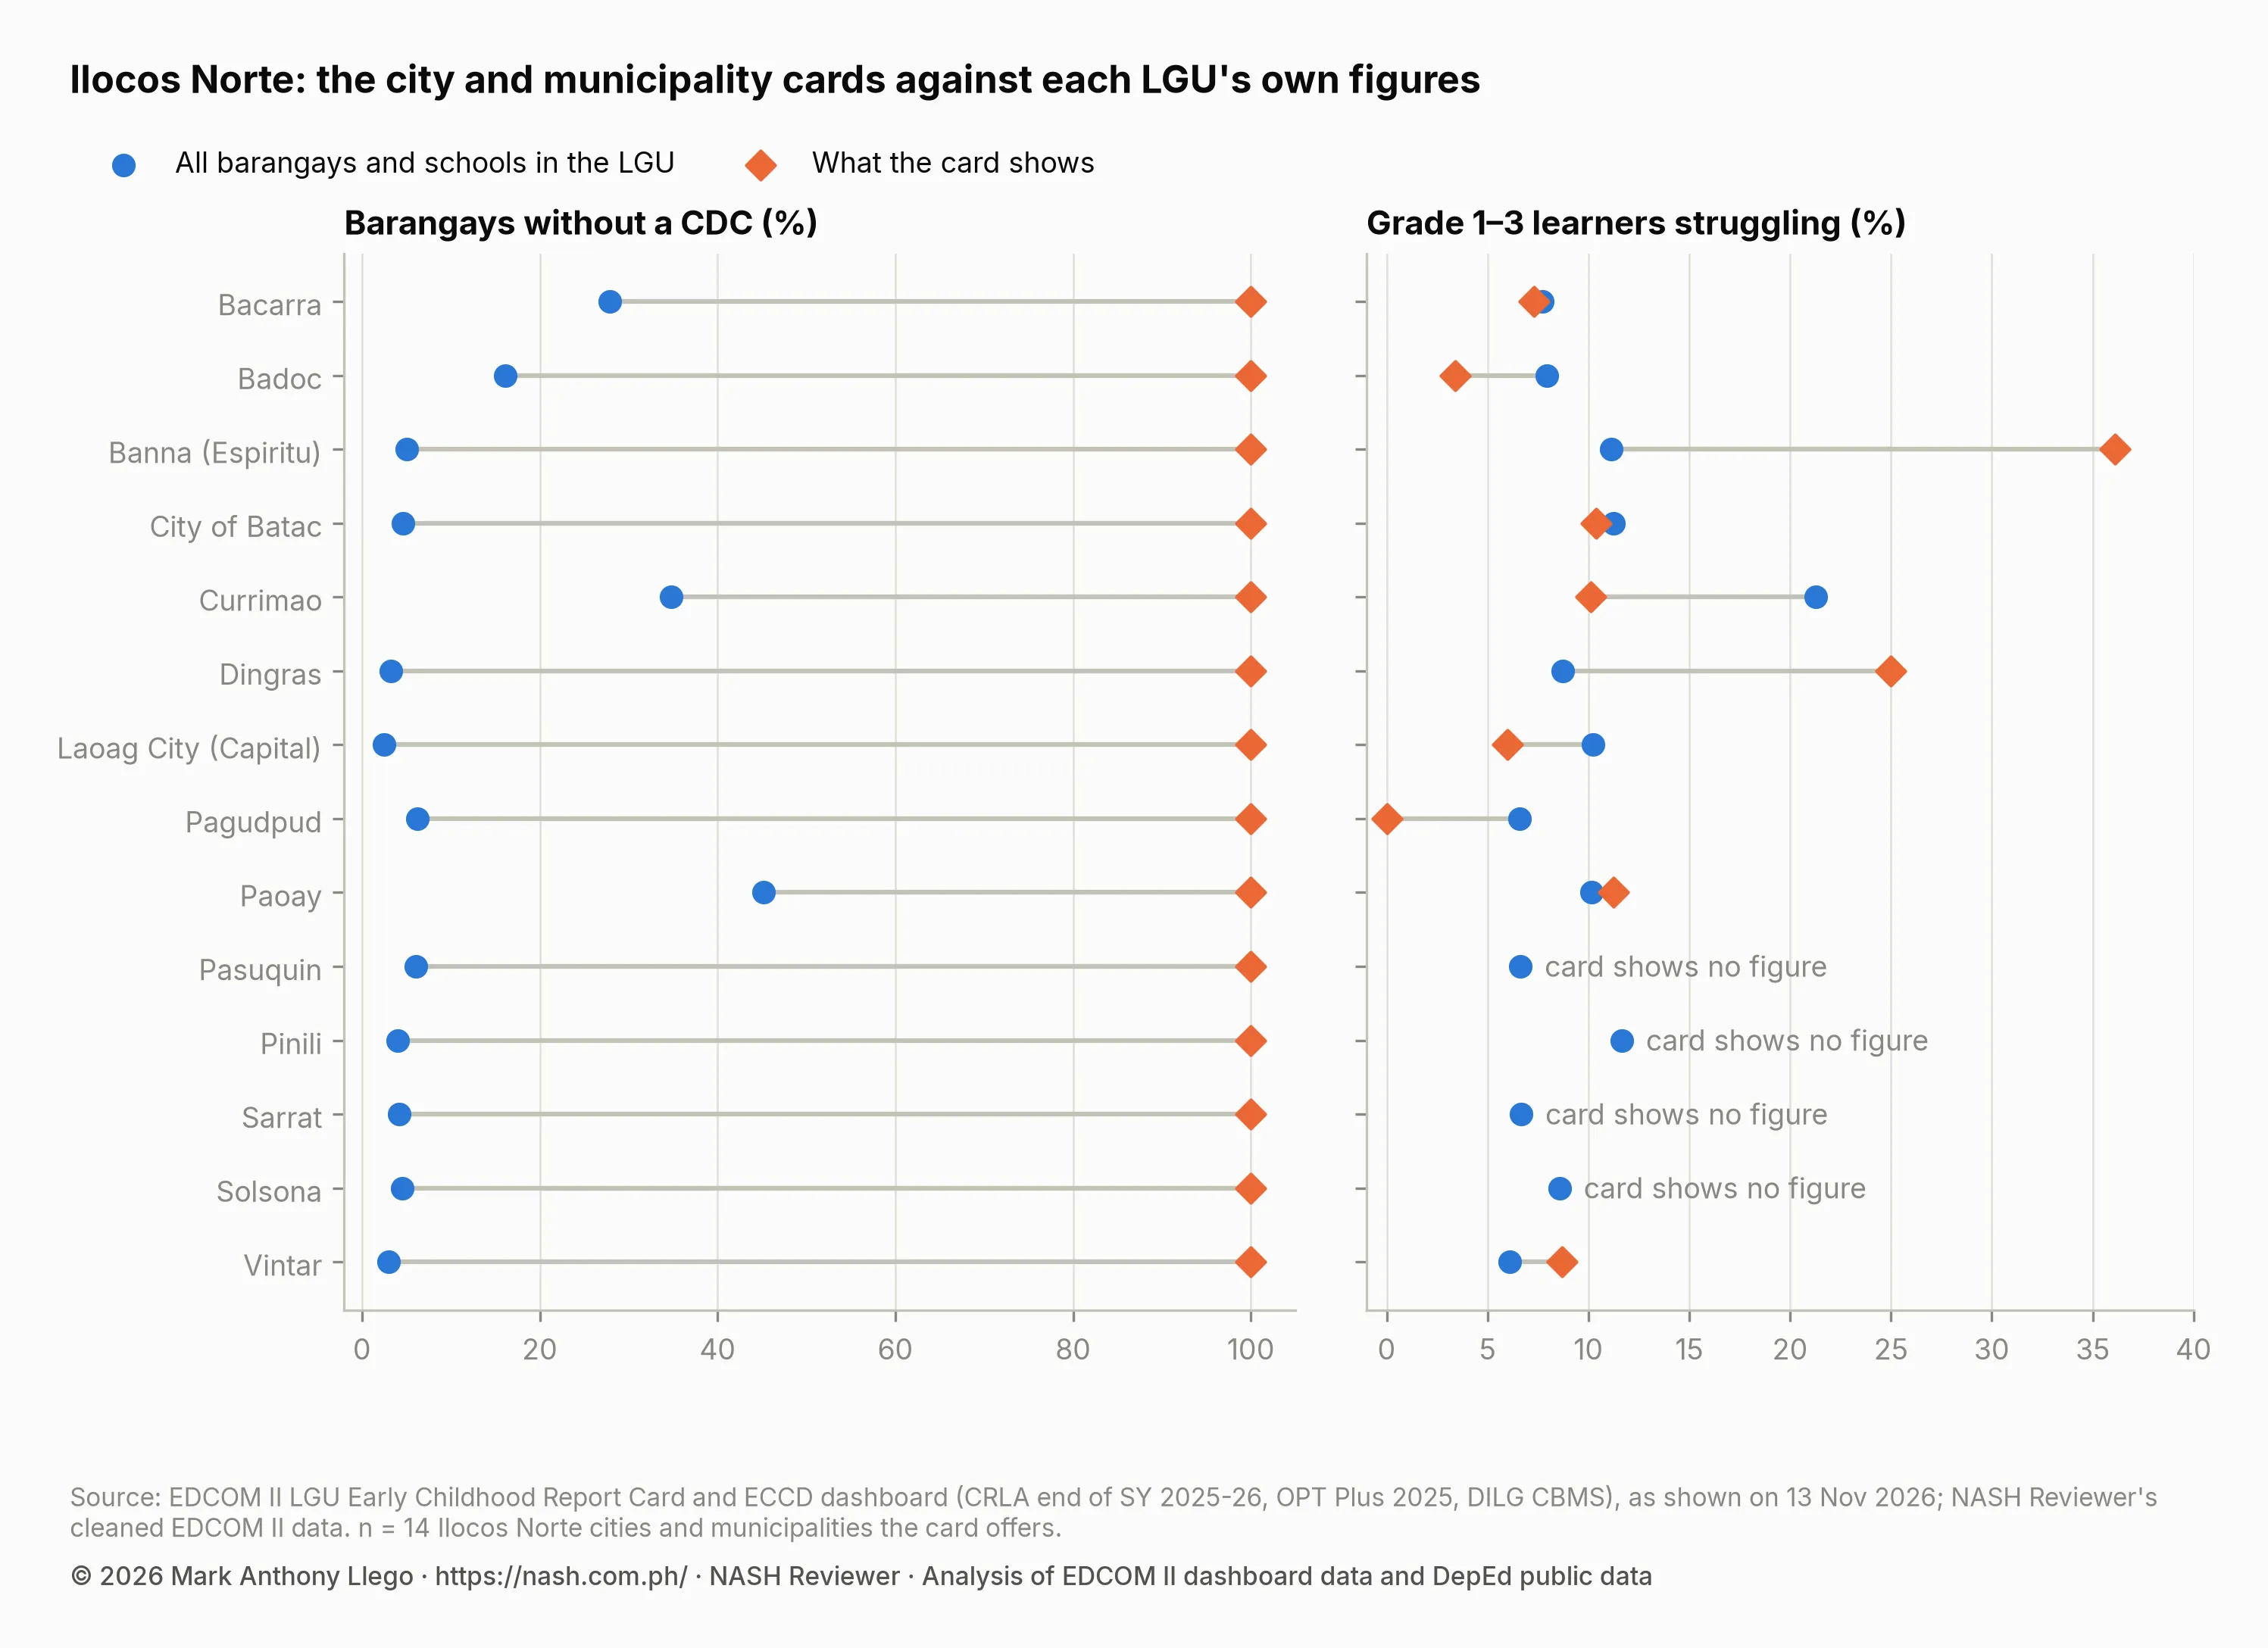
On the city and municipality card, the CDC box always reads 100.0%. The count under it is the number of the LGU’s barangays on the DILG list, and the percentage divides that count by the same barangays. The figures on the card match a simple rule: keep only the LGU’s barangays on the list, then compute every figure from them and from the schools located in them. All 14 Ilocos Norte city and municipality cards, and the Ilocos Norte provincial card, agree with that rule to the decimal.
Bacarra, Ilocos Norte, shows what this does:
| Bacarra, Ilocos Norte | What the card shows | All barangays and schools in Bacarra |
|---|---|---|
| Barangays without a CDC | 12 (100.0%) | 12 of 43 (27.9%) |
| Grade 1–3 learners struggling to read | 15 of 205 (7.3%) | 89 of 1,151 (7.7%) |
| Schools whose learners are counted | 2 | 24 |
| Stunting, children under 2 | 12.4% (68 stunted, 547 of normal height) | 11.1% (68 of 615 classified) |
The ECCD Dashboard shows the same thing for Bacarra: “Barangays in View” 12, “Schools in View” 3, “Children Assessed for Reading” 205 (the third school in view has no CRLA results), and under the CDC box “(12 out of 12 barangays)” and “89.0% above national average”. That last line compares the 100% with the national 11.0%.
Across the 955 LGUs with a card, the true share of barangays without a CDC has a median of 9.1%, and 924 LGUs are below 50%. Only one is truly at 100%: Pandag, Maguindanao del Sur, where all 8 barangays lack a CDC. The barangay count on the card is the LGU’s count on the DILG list; read the percentage as “of the barangays on the list”, and divide the count by the LGU’s own number of barangays to get the share.
What the reading figure covers
Because the card keeps only barangays without a CDC, its reading figure counts only the schools located in those barangays. In the 955 LGUs with a card, that is 2,168 of 24,038 schools with CRLA results and 354,579 of 3,421,121 learners assessed (10.4%). Among the 784 cards that show a reading figure, the median card counts 7.4% of its LGU’s learners. In the other 171 LGUs no school with CRLA results lies in a barangay on the list, and the reading box is blank.
The card counts a learner as struggling at the Low Emerging or High Emerging level of the CRLA, and counts each learner once: Grade 1 in the Mother Tongue, Grade 2 in Filipino and Grade 3 in English.
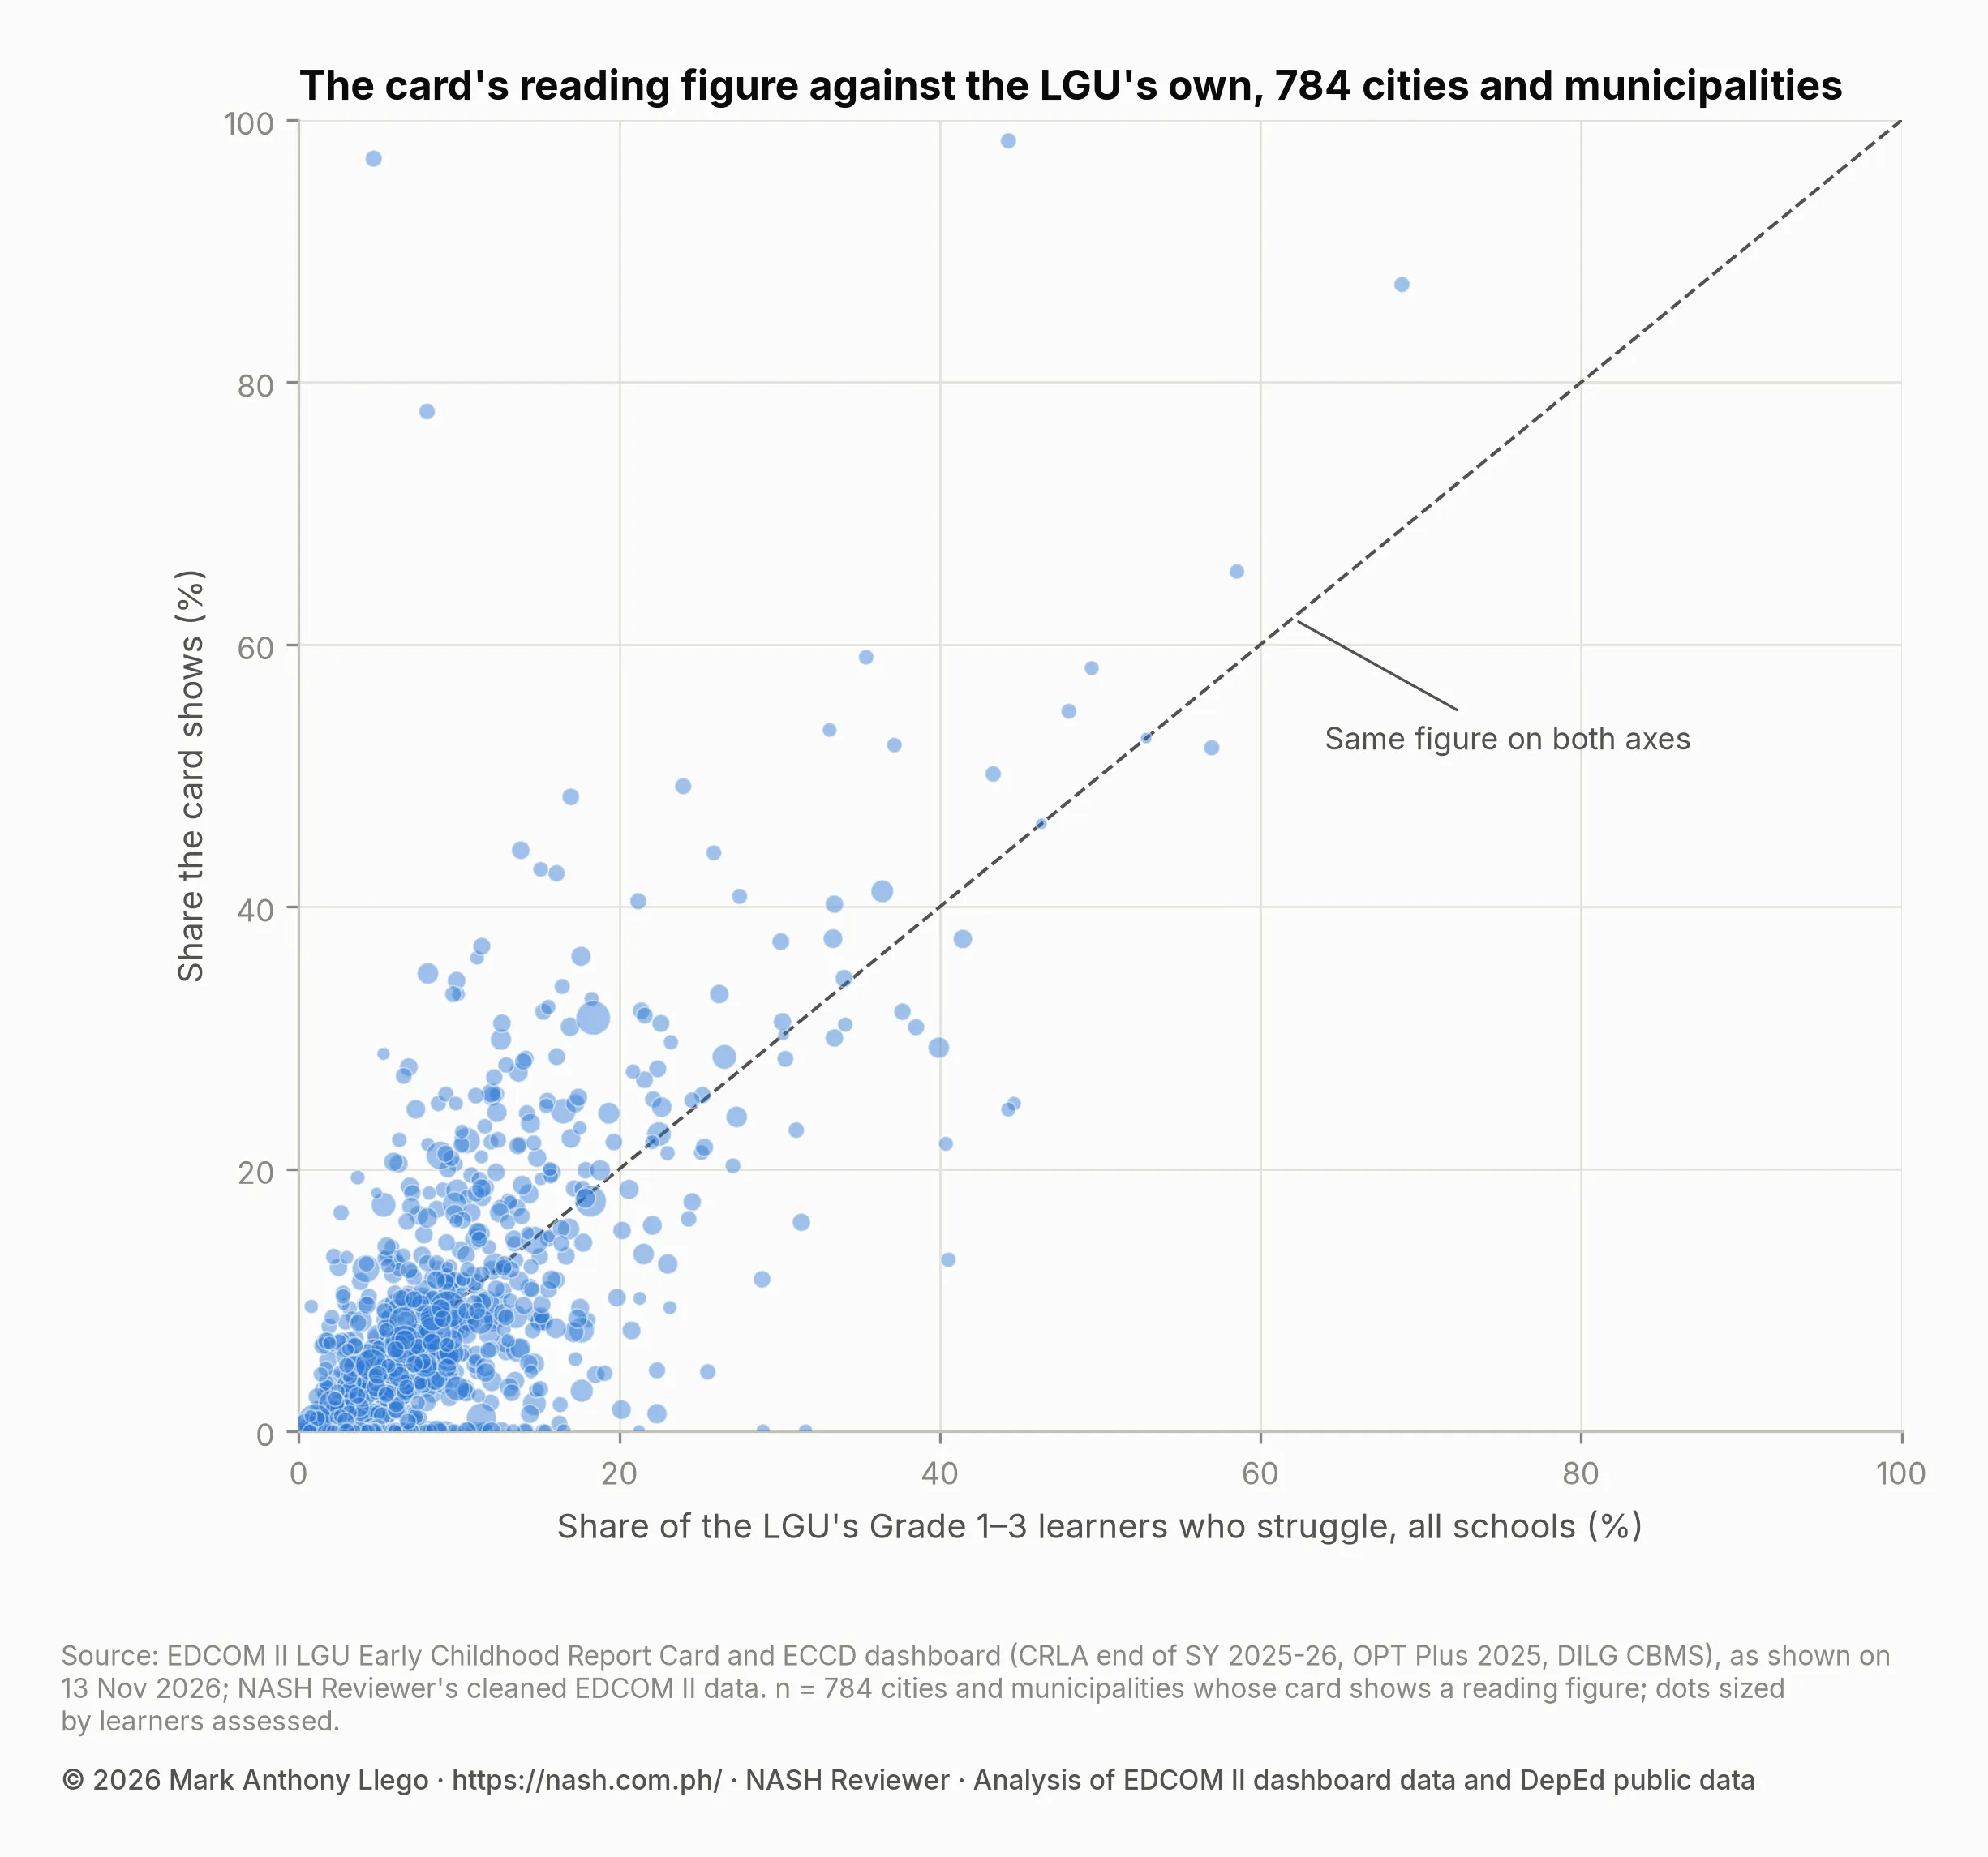
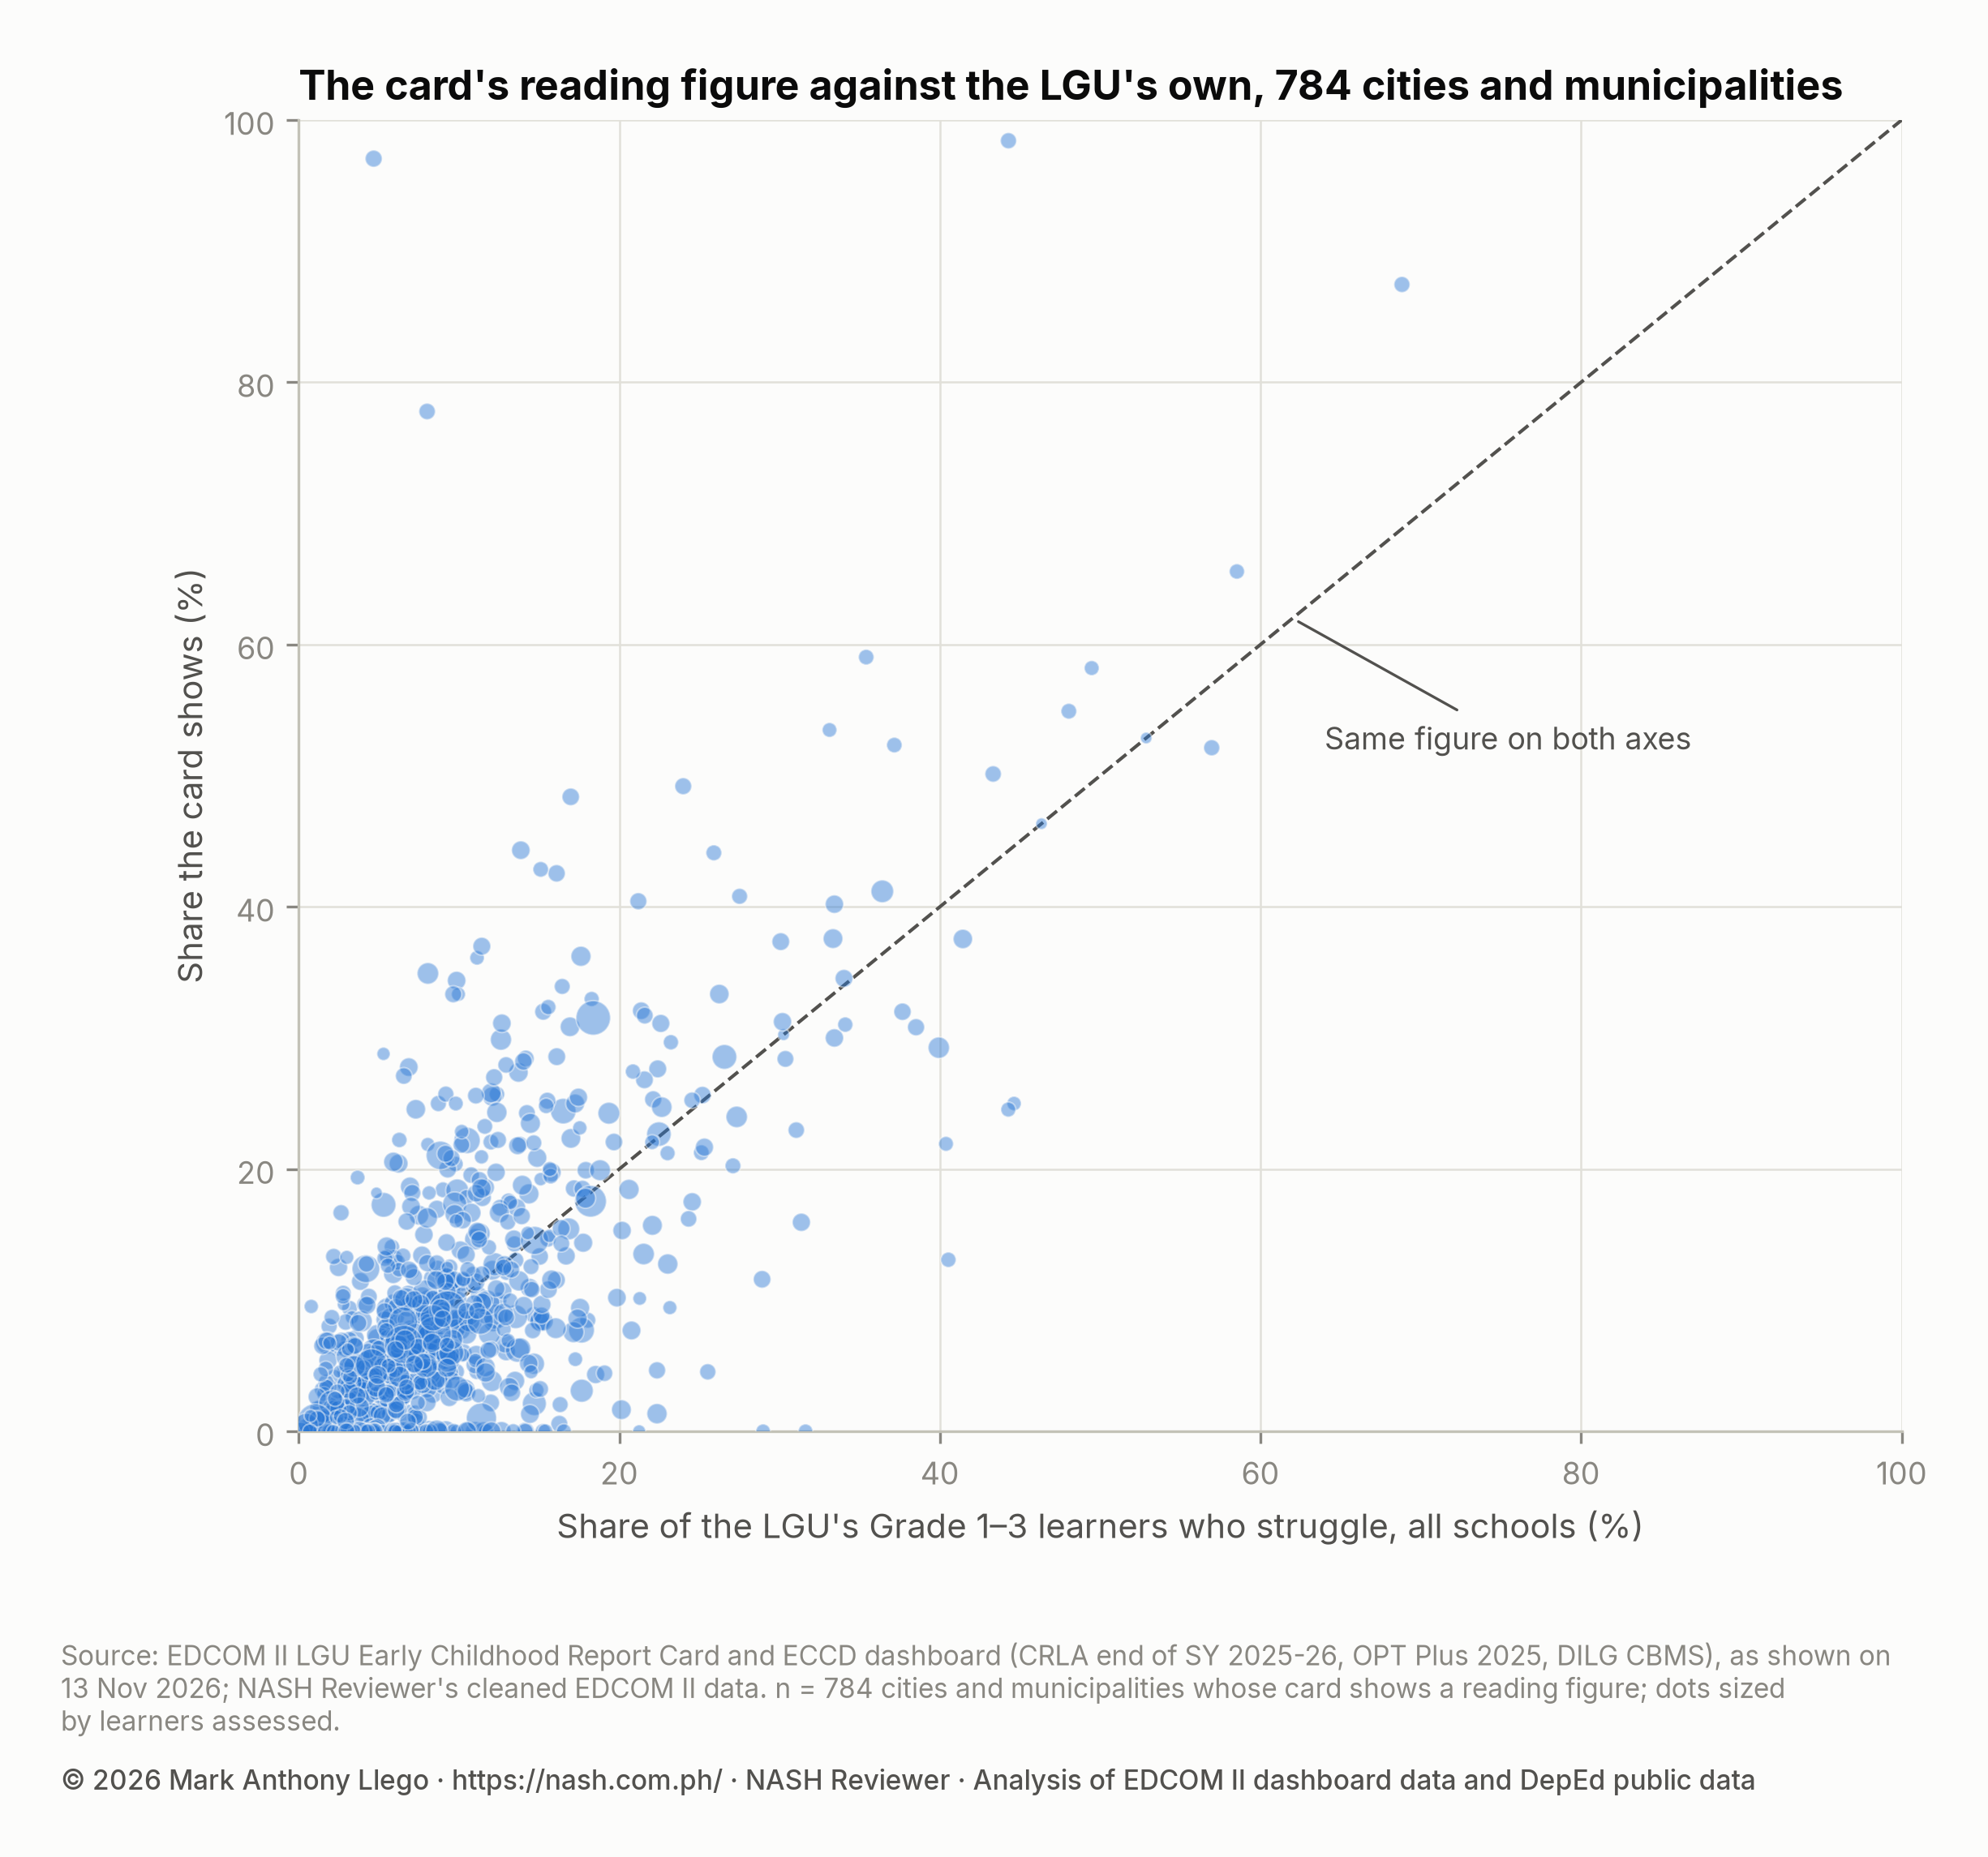
Of the 784 cards with a reading figure, the median card differs from its LGU’s own share by 3.6 percentage points. The card is higher in 332 LGUs, lower in 447 and equal in 5; 298 differ by more than 5 points and 119 by more than 10. The card’s figure rests on fewer than 50 learners in 153 of the 784, so a handful of learners can swing it. Some examples:
| LGU | What the card shows | All schools in the LGU |
|---|---|---|
| Guindulungan, Maguindanao del Sur | 97.1% (66 of 68) | 4.7% (91 of 1,945) |
| Banna, Ilocos Norte | 36.1% (13 of 36) | 11.1% (80 of 719) |
| Dingras, Ilocos Norte | 25.0% (3 of 12) | 8.7% (126 of 1,446) |
| Amai Manabilang, Lanao del Sur | 0.0% (0 of 54) | 31.6% (234 of 740) |
A mayor or Local School Board that reads Guindulungan’s card would see a reading emergency, and one that reads Amai Manabilang’s would see none. The LGU-wide figures say nearly the opposite.
How the stunting figure is computed
The stunting box is not affected by the barangay filter. It uses the LGU’s whole OPT Plus 2025 row: Bacarra’s 68 stunted children are all the stunted children under 2 measured in Bacarra. The difference lies in what the card divides by.
OPT Plus classifies each child measured by height for age as normal, stunted, severely stunted or tall. The card divides the stunted and severely stunted children aged 0–23 months by the children of normal height in the same ages, which the dashboard describes as “children 0-2 years old”. The result is a ratio of stunted to normal children, which is always higher than the share of children classified as normal, stunted or severely stunted. In Bacarra that is 12.4% (68 ÷ 547) against 11.1% (68 ÷ 615); the dashboard’s national figure is 4.3% against a share of 4.1%. The card is higher in every LGU with any stunted child, by a median of 0.2 percentage points, and the gap grows with stunting: Jovellar, Albay, shows 66.8% on the card and 40.0% as a share. Stunting, Day Care Centers and Early Reading explains the columns behind this.
The OPT Plus figure on the card is also not the stunting figure most often quoted. The Playbook tells LGUs to “Compare your province to the national 23.6% average” (p. 9). That 23.6% is the stunting prevalence among children under five in the 2023 National Nutrition Survey of the DOST Food and Nutrition Research Institute (FNRI), and the FNRI’s 2025 Updating Survey puts it at 25.3% (EDCOM II, 17 June 2026). OPT Plus counts the children actually weighed and measured in barangays, and it finds far lower shares. In OPT Plus 2025, 452,449 of the 9,085,908 children under 5 measured in these LGUs were stunted or severely stunted (5.0%). Compare an OPT Plus figure with an OPT Plus figure of the same ages, and a survey figure with a survey figure.
The provincial report card
The provincial card adds up only the cities and municipalities the city card offers, so it carries the same limits and leaves out every LGU with a CDC in every barangay. Ilocos Norte has 23 cities and municipalities with CRLA results; its provincial card lists 14.
| Ilocos Norte | Provincial card | All 23 cities and municipalities |
|---|---|---|
| Stunting, children under 2 | 5.9% (532 stunted) | 4.7% (585 of 12,351 classified) |
| Barangays without a CDC | 100.0% (52) | 9.3% (52 of 559) |
| Grade 1–3 learners struggling to read | 9.8% (111 of 1,135) | 9.2% (2,004 of 21,754) |
The provincial reading box also gives its source as “DILG-CBMS 2025”, while the same figure on the city card is credited to “DepEd CRLA EOSY25-26”. The reading data are DepEd’s CRLA results.
How to find your LGU’s figures
The table for all 1,639 cities and municipalities gives, for each LGU, what the card shows and the LGU’s own figures over all its barangays and schools. Use it this way:
| You need | Use these columns | Bacarra |
|---|---|---|
| Stunting among children under 2 | stunted_under2 of classified_under2 (stunting_under2_pct) |
68 of 615 (11.1%) |
| Stunting among children under 5 | stunted_under5 of measured_under5 (stunting_under5_pct) |
171 of 1,677 (10.2%) |
| Barangays without a CDC | barangays_without_cdc of barangays (barangays_without_cdc_pct) |
12 of 43 (27.9%) |
| Grade 1–3 struggling readers | struggling_readers of learners_assessed (struggling_pct) |
89 of 1,151 (7.7%) |
EDCOM II’s Template 4, the resolution calling for urgent action on the learning crisis, has a clause with blanks for these numbers: “WHEREAS, based on DepEd’s Comprehensive Rapid Literacy Assessment data, ___ out of ___ learners from Grades 1 to 3 (or ___%) in [NAME OF LGU ] are struggling readers, while based on Operation Timbang data, ___% of children under age 5 are malnourished/stunted”. For Bacarra it would read 89 out of 1,151 learners (7.7%), and 10.2% of children under 5 stunted. The clause asks for children under 5, so the under-5 column fits it better than the card’s 0–2 figure.
Three habits keep these numbers right:
- Give each figure its date and source. OPT Plus 2025 (as of 2 March 2026), the CRLA at the end of SY 2025-26 (as of 10 May 2026), and the DILG CBMS list (as of 17 September 2025).
- Check the local records. The municipal or city nutrition office holds the OPT Plus report for each barangay, the social welfare office knows which barangays have a CDC, and the schools division holds each school’s CRLA results. The DILG list says whether a barangay has a CDC, not how many children it serves.
- Count your LGU even if the card leaves it out. An LGU with a CDC in every barangay still has stunted children and struggling readers; the table gives its figures.
Which LGUs Carry Several Early-Childhood Burdens? uses the same LGU-wide figures, with the classroom shortage, to show where several of these needs meet.
What this means for school heads
A school head is rarely the one who opens the report card, but is often asked about its numbers in a Local School Board meeting or a barangay assembly. Bring the LGU-wide figures, with their sources, and say which figure the card shows. A reading figure drawn from two of the town’s 24 schools is not the town’s reading result.
Start from the school’s own CRLA results, which How to Read a School’s CRLA Results Fairly explains, and set them beside the LGU’s. When the LGU plans its Special Education Fund, the board needs the LGU’s whole picture: Local School Boards and the Special Education Fund explains what the board can fund, including CDCs and early-childhood workers.
Reading data correctly and sharing them with local partners is part of the work the Philippine Professional Standards for School Heads describe under Domain 1, Leading Strategically, which covers using data for planning, and Domain 5, Building Connections, which covers working with the LGU and the community.
Frequently asked questions
Why does my municipality’s report card say 100% of barangays have no CDC?
The city and municipality card keeps only the barangays on the DILG list of barangays without a CDC, so the share of “barangays without a CDC” among them is always 100%. The count is right: divide it by your LGU’s total number of barangays. Across the 955 LGUs with a card, the median true share is 9.1%.
Why can’t I find my city or municipality on the report card?
The list offers only LGUs with at least one barangay on the DILG list of barangays without a CDC. If every barangay in your LGU has a CDC, it is one of the 684 cities and municipalities left out. Its stunting, CDC and reading figures are in the downloadable table.
Is the report card’s stunting rate the same as the 23.6% national rate?
No. The card’s figure comes from OPT Plus 2025 for children aged 0–23 months and divides by children of normal height; it is 4.3% nationally, or 4.1% as a share of children classified as normal, stunted or severely stunted. The 23.6% in EDCOM II’s Playbook is the 2023 National Nutrition Survey prevalence for children under five; the 2025 Updating Survey gives 25.3%. The two measure different things and should not be compared.
Which reading figure should an LGU cite?
Cite the share across all the LGU’s schools with CRLA results, with its count: for Bacarra, 89 of 1,151 Grade 1–3 learners (7.7%) at the end of SY 2025-26. The card’s figure covers only schools in barangays without a CDC: where it shows a figure, a median of 7.4% of an LGU’s learners.
Download the data
- lgu-card-vs-actual.csv: all 1,639 cities and municipalities with CRLA results, with whether the card offers each, what the card shows, and the LGU’s stunting (under 2 and under 5), barangays without a CDC and struggling readers over all its barangays and schools. The card columns for the City of Manila add up its 14 district cards, and two Special Geographic Area rows (Midsayap II and Pikit III) take their card values from dropdown entries that do not match one LGU exactly. Sources: EDCOM II report card and ECCD dashboard data (OPT Plus 2025, DILG CBMS, DepEd CRLA end of SY 2025-26).
- lgu-card-coverage-map.csv, lgu-card-reading-vs-actual.csv and lgu-card-ilocos-norte.csv: the data behind Figures 1 to 3.
The cleaned EDCOM II dashboard data these come from are described in How the EDCOM Dashboard Data Was Cleaned. The CSVs and charts may be reused only with written permission: email support@nash.com.ph. The figures themselves come from OPT Plus, the DILG CBMS and DepEd’s CRLA, which you can cite directly.
Sources
EDCOM II
-
Second Congressional Commission on Education (EDCOM II). LGU Early Childhood Report Card (City/Municipality and Provincial Report Card tabs), edcom2.gov.ph/reportcard, as shown on 13 November 2026.
-
EDCOM II. Early Childhood Dashboard, Overview tab, edcom2.gov.ph/eccddashboard, as shown on 13 November 2026.
-
EDCOM II. LGU Playbook: Fixing the Foundations of Local Education, March 2026, pp. 9 and 14–15, PDF.
-
EDCOM II. Template 4, Calling for Urgent Action to Address the Learning Crisis, and Adopting the Recommendations of EDCOM II, in the LGU Resource Center.
-
EDCOM II. News release on the FNRI 2025 Updating Survey (national stunting 25.3%), 17 June 2026, edcom2.gov.ph.
Data
- Department of Health and National Nutrition Council, Operation Timbang Plus 2025, as of 2 March 2026, as published in the EDCOM II dashboard.
- Department of the Interior and Local Government, Community-Based Monitoring System list of barangays without a child development center, as of 17 September 2025, as published in the EDCOM II dashboard.
- Department of Education, Comprehensive Rapid Literacy Assessment, end of SY 2025-26, as of 10 May 2026, as published in the EDCOM II dashboard.
- Boundaries: Philippine Statistics Authority and NAMRIA, via OCHA’s Humanitarian Data Exchange (CC BY-IGO).
More in this series
- CRLA End-of-Year Results SY 2025-26: All 18 Regions
- CRLA Start vs End of SY 2025-26 in the Same Schools
- CRLA by Language: Mother Tongue, Filipino and English
- How to Read a School’s CRLA Results Fairly
- CRLA Variation: School, Division or Region?
- Where Struggling Readers Are Concentrated
- School Resources and CRLA Reading Results
- CRLA Results in Schools With and Without a Principal
- Action Research and Thesis Topics on Reading (CRLA)
- CRLA Reading Hotspots: A Map of Struggling Readers
- Stunting, Day Care Centers and Early Reading
- Literacy and Nutrition Programs Compared With Need
- Where Struggling Readers and Classroom Shortages Meet
- Which LGUs Carry Several Early-Childhood Burdens?
- How to Read EDCOM’s LGU Early Childhood Report Card (this post)
- CRLA Schools With No Struggling Readers: A Data Check
- How the EDCOM Dashboard Data Was Cleaned
- Regional reports: NCR, CAR, Region I, Region II, Region III, Region IV-A, MIMAROPA, Region V, Region VI, NIR, Region VII, Region VIII, Region IX, Region X, Region XI, Region XII, Caraga, BARMM
- Earlier reports: CRLA Results SY 2025-2026 (DepEd’s selected-school file), Do the Same DepEd Schools Lag on the ELLNA, NAT and CRLA?, DepEd School Inputs vs Test Results, EDCOM II Final Report: Guide for Aspiring School Heads, DepEd Data for Aspiring School Heads: Where to Start
Written by Mark Anthony Llego for NASH Reviewer. Sources: EDCOM II LGU Early Childhood Report Card and ECCD Dashboard, EDCOM II LGU Playbook and templates, OPT Plus 2025, DILG CBMS, DepEd CRLA. NASH Reviewer is not affiliated with EDCOM II or DepEd. Charts may be reused only with written permission from support@nash.com.ph.