Cities and municipalities that are shorter of classrooms tend to have more struggling readers in Grades 1–3, though the link is modest. Across the 1,639 cities and municipalities, or local government units (LGUs), with Comprehensive Rapid Literacy Assessment (CRLA) results at the end of SY 2025-26, the rank correlation between the share of struggling readers and the 2023 classroom shortage per 1,000 learners is 0.23 (95% interval 0.12 to 0.34). Comparing LGUs within the same region, each standard deviation of the logged shortage rate goes with 21% higher odds of a learner struggling.
In 254 LGUs both are above the national rate. They hold 16.5% of the learners assessed but 30.9% of the country’s struggling readers, and the classrooms planned under the School Building Program (SBP) 2026 would meet only 5.2% of their classroom shortage, the lowest share of any group. Most are in Mindanao: 85 are in BARMM, where 95.2% of the region’s struggling readers live in such LGUs.
The reading data are DepEd’s CRLA results as published in the early-childhood (ECCD) dashboard of the Second Congressional Commission on Education (EDCOM II); the classroom data are DepEd’s 2023 classroom shortage and SY 2024-25 enrollment from EDCOM II’s classroom construction dashboard. Both are compared by place, not by learner, and the two measures come from different years.
Key findings
- Across 1,639 cities and municipalities, the rank correlation between struggling readers and the classroom shortage per 1,000 learners is 0.23 (95% interval 0.12 to 0.34); outside BARMM and Sulu it is 0.14 (CRLA end of SY 2025-26; classroom shortage 2023).
- Within regions the correlation is positive in 15 of 18, from 0.59 in MIMAROPA to -0.43 in CAR. With region fixed effects, each standard deviation of the logged shortage rate goes with 1.21 times the odds of struggling (95% interval 1.11 to 1.31) (CRLA end of SY 2025-26; classroom shortage 2023).
- In 254 LGUs both measures are above the national rate (10.0% struggling; 7.3 classrooms short per 1,000 learners). They hold 16.5% of learners assessed, 30.9% of struggling readers and 23.6% of the shortage (same data).
- SBP 2026 classrooms would meet 5.2% of the 2023 shortage in those 254 LGUs, against 16.6% in LGUs below the national rate on both (SBP 2026 masterlist).
- BARMM has 85 of the 254, and Sulu, counted in Region IX, has 15. Outside BARMM and Sulu, 154 such LGUs hold 103,986 struggling readers; Region I and NCR have none (same data).
- On the map, an LGU’s share of struggling readers tracks its neighbors’ shortage rate (bivariate Moran’s I 0.293, permutation p = 0.0001). The 105 LGUs in significant high-high clusters hold 14.2% of struggling readers and 7.5% of learners assessed (same data; boundaries PSA and NAMRIA).
The two measures
Struggling readers. In the CRLA, a struggling reader is a learner at the Low Emerging or High Emerging level. Grade 1 is assessed in the Mother Tongue, Grade 2 in Filipino and Grade 3 in English, and each learner is counted once. In the 1,639 cities and municipalities, 511,753 of the 5,127,655 learners assessed at the end of SY 2025-26 (10.0%) were struggling readers, as of 10 May 2026.
A town with 40 learners assessed can land at 0% or 25% by chance. So each LGU’s share is an empirical Bayes estimate: its raw share is pulled toward the national 10.0%, more strongly when few learners were assessed. Large LGUs keep almost their raw share. CRLA Reading Hotspots: A Map of Struggling Readers uses the same estimates.
Classroom shortage. DepEd’s 2023 classroom shortage counts, school by school, the classrooms a school lacks for its classes, from kindergarten to senior high school; Classroom Shortage in the Philippines, 2023 explains how it is computed. To compare towns of different size, each LGU’s shortage is divided by its SY 2024-25 enrollment. Across these 1,639 LGUs, 165,285 classrooms are short for 22,536,990 learners: 7.3 per 1,000. That rate counts every learner in the LGU’s enrollment table; the national 7.4 per 1,000 in the shortage report counts only schools in the shortage table. Only 18 LGUs (1.1%) have no shortage at all.
The two measures cover different grades and years. The shortage is a 2023 count for every level from kindergarten up; the CRLA covers Grades 1–3 in SY 2025-26. A shortage rate describes the schools a town’s learners attend, not a Grade 1 classroom.
Do LGUs short of classrooms have more struggling readers?
Yes, on average, though many towns do not follow the pattern. Each dot in the scatter plot is a city or municipality; the dashed lines mark the national rates and divide the plot into four groups.
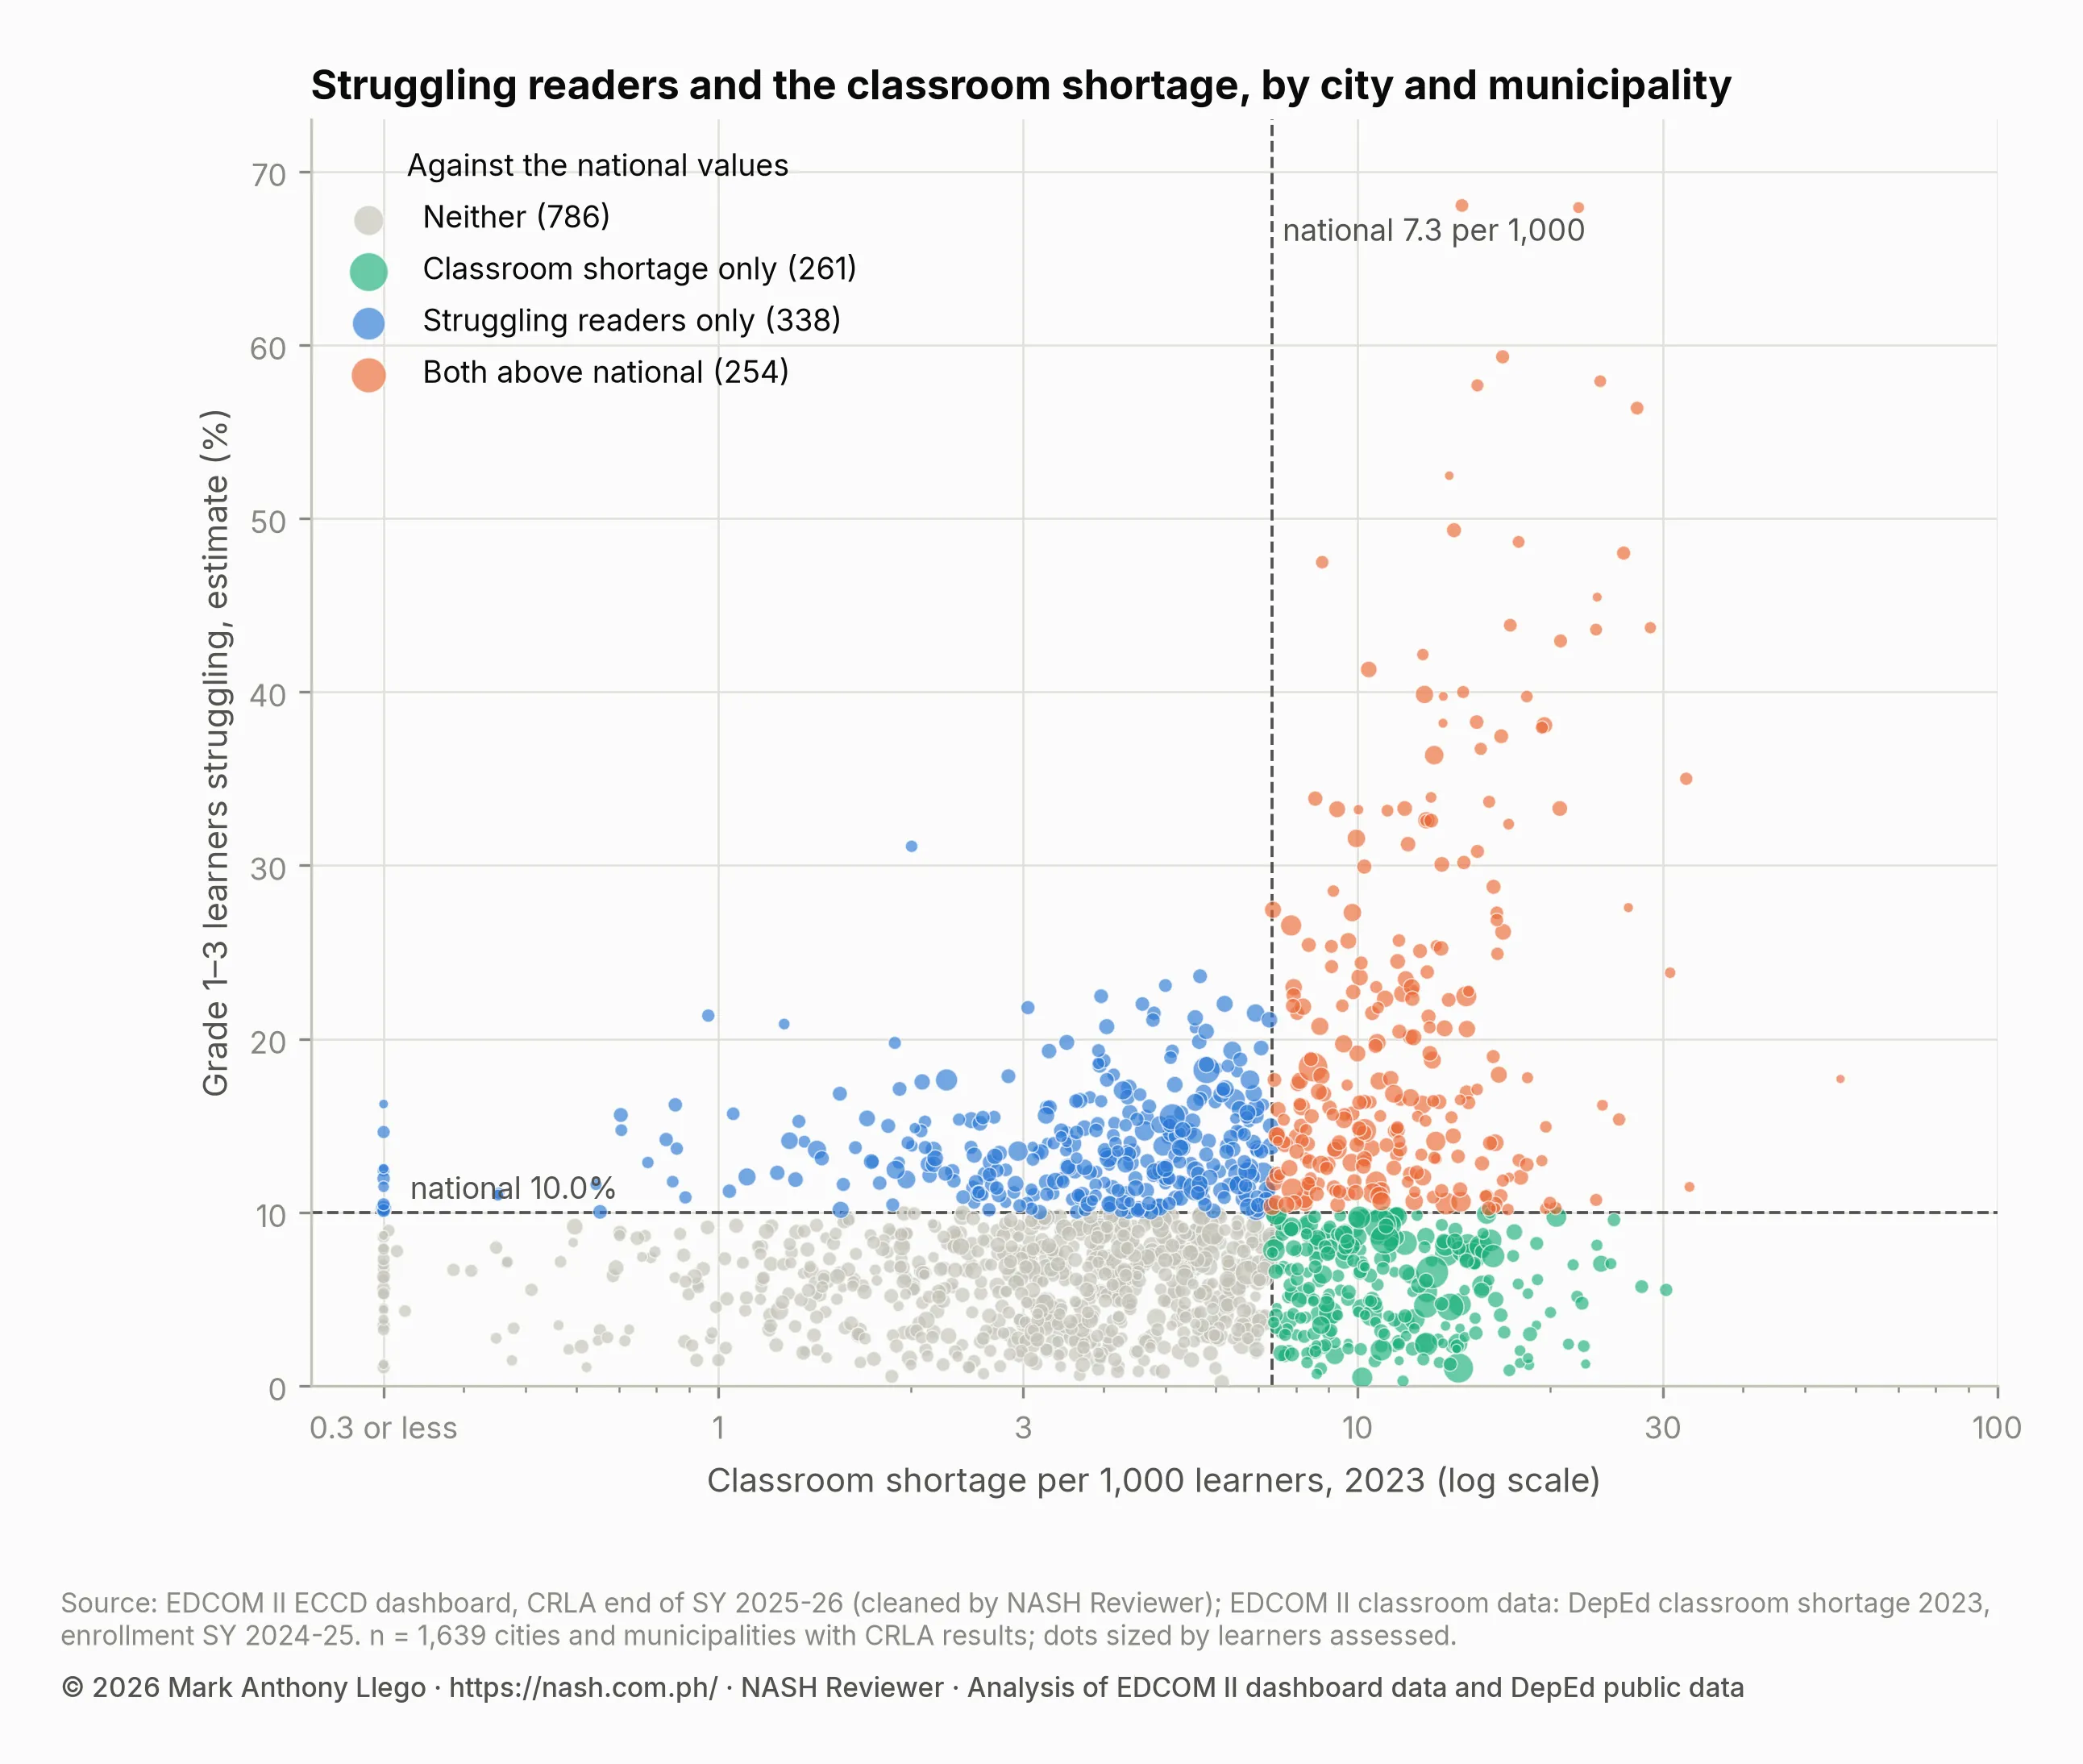
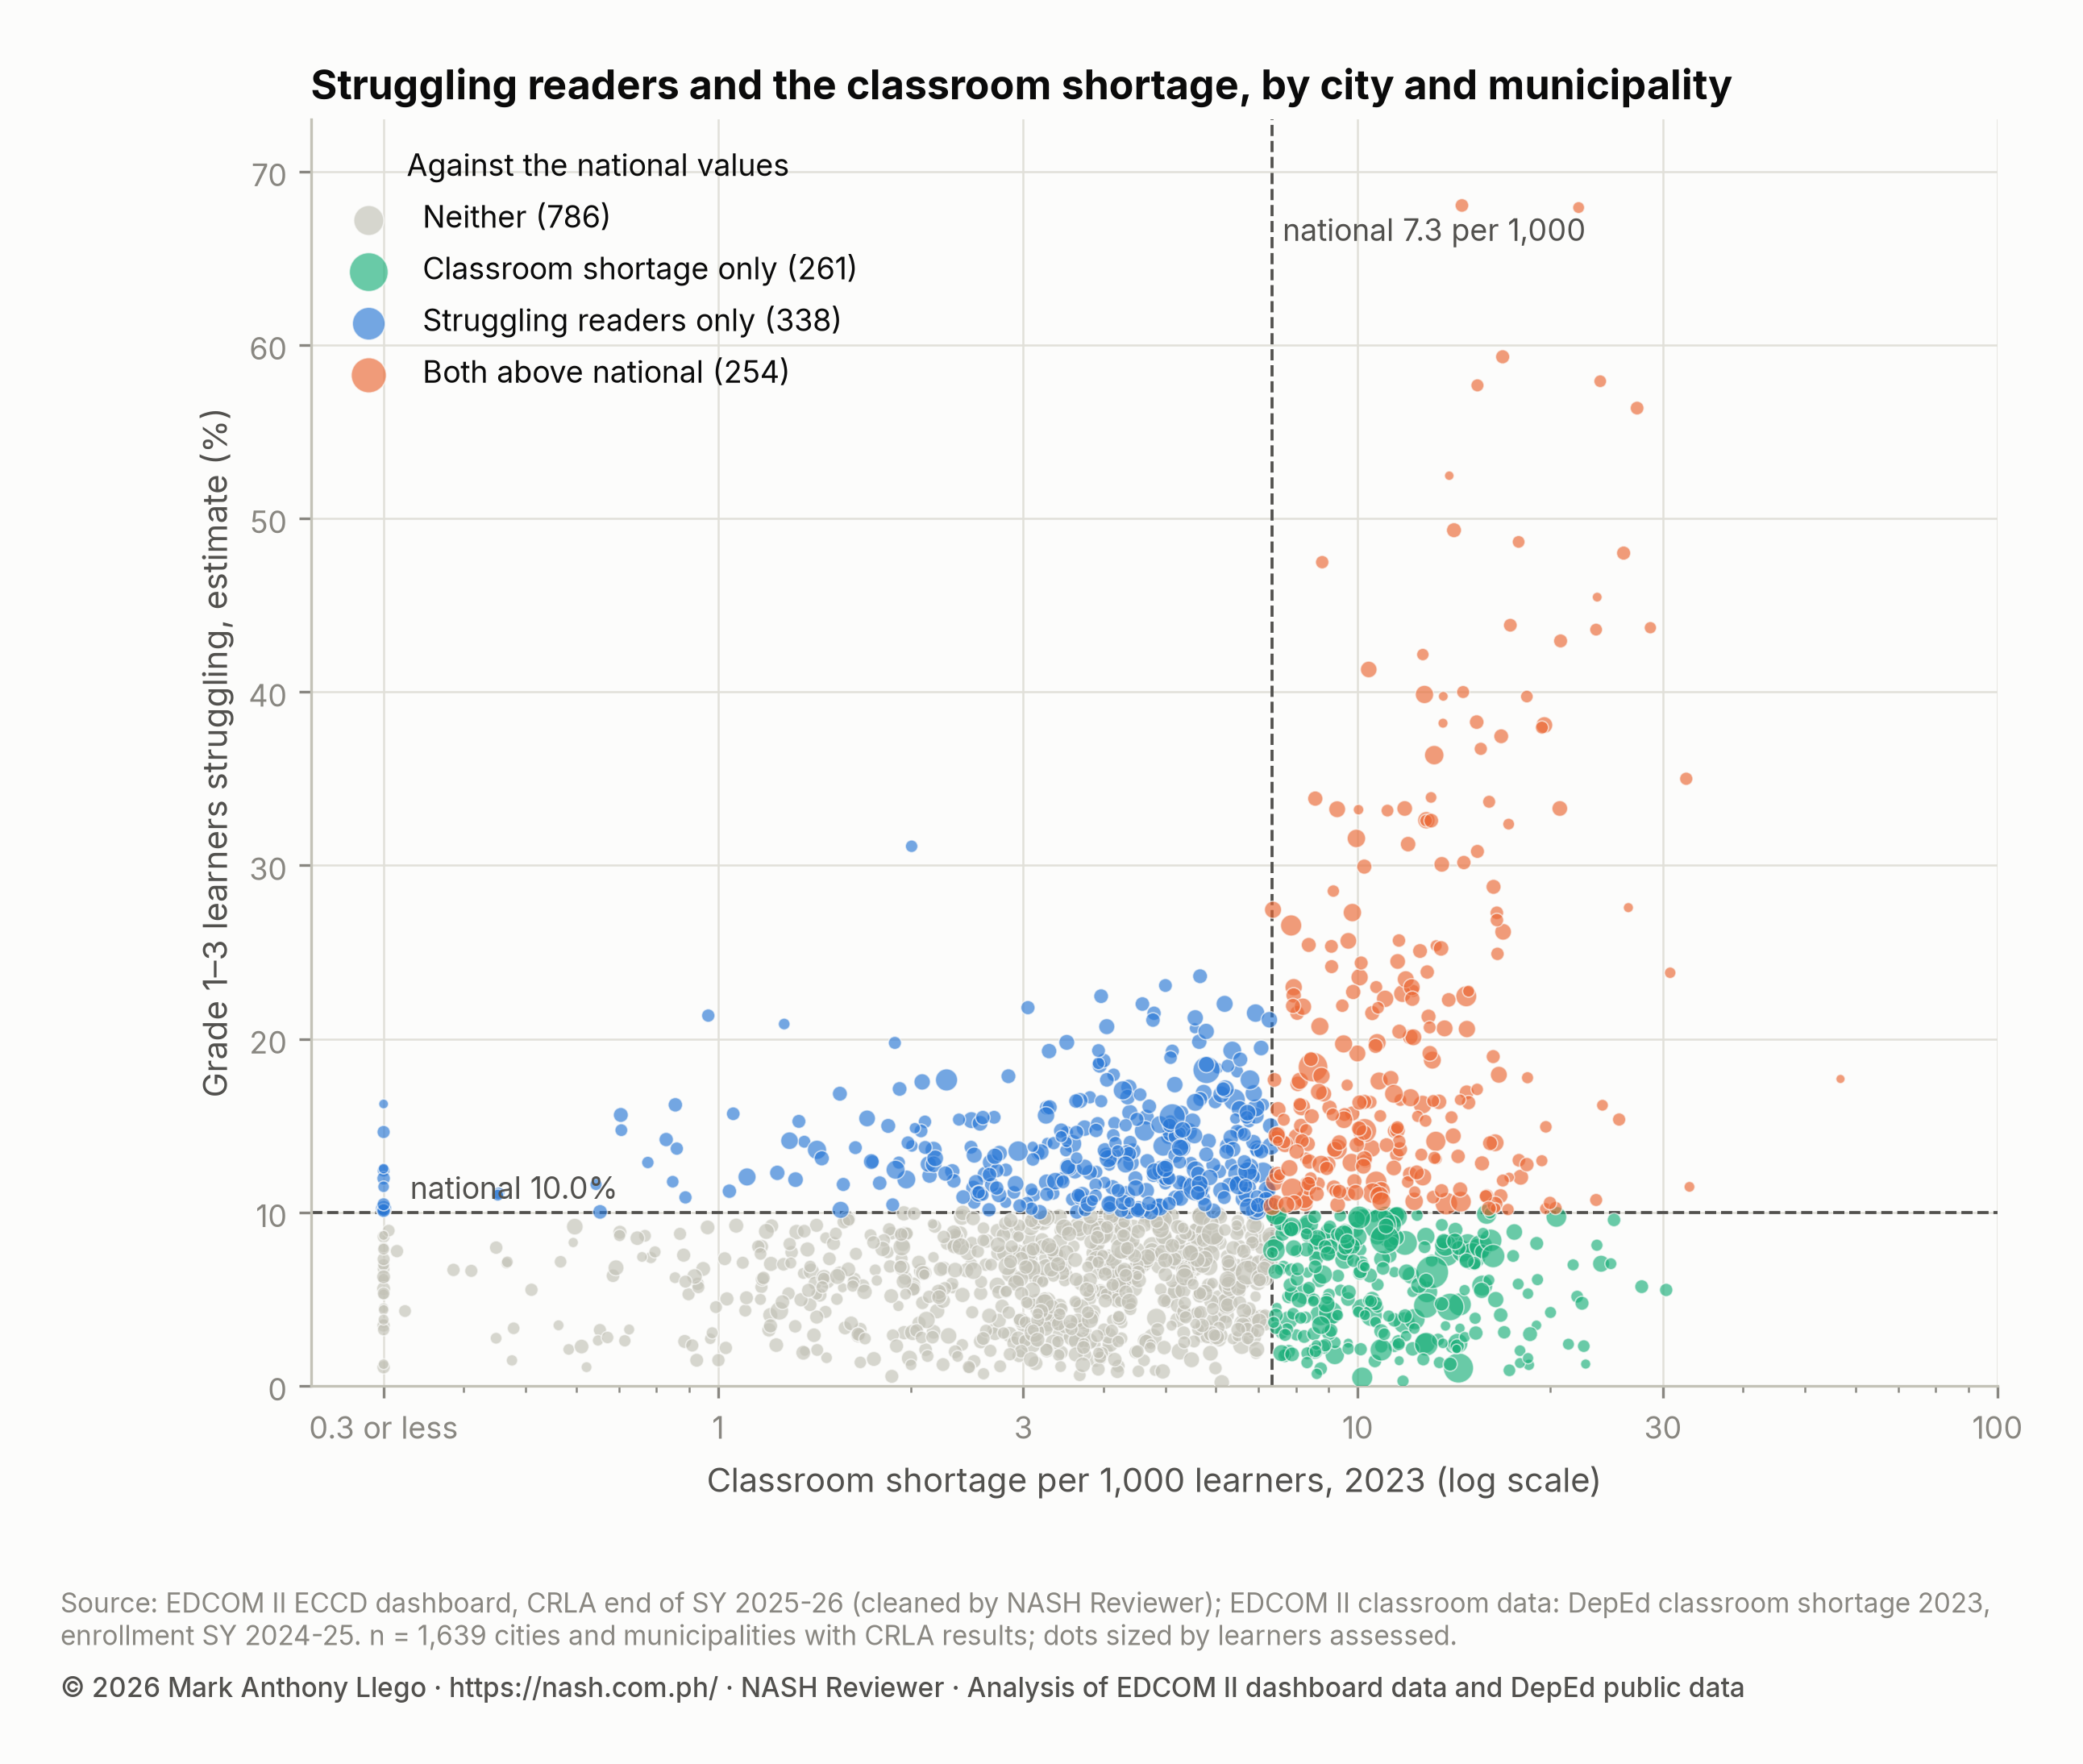
The Spearman rank correlation ranks the LGUs on each measure and asks how well the two orders agree: 0 means no agreement and 1 a perfect match. Here it is 0.23. Its 95% interval, 0.12 to 0.34, comes from a bootstrap that redraws whole provinces 2,000 times. Whole provinces are drawn because neighboring towns resemble each other, and treating each town as independent would overstate the evidence.
Much of the national correlation comes from BARMM and Sulu, where both struggling readers and the shortage are highest. Without them, across 1,515 LGUs, the correlation is 0.14.
Comparing LGUs in the same region
A national correlation can come from differences between regions alone. Computed inside each region, it is positive in 15 of 18, with a median of 0.22:
| Region | Cities and municipalities | Spearman correlation |
|---|---|---|
| MIMAROPA | 73 | 0.59 |
| Region VIII | 143 | 0.45 |
| Region XII | 49 | 0.42 |
| Region IX | 89 | 0.37 |
| Region III | 130 | 0.36 |
| Region X | 93 | 0.32 |
| Region IV-A | 142 | 0.26 |
| Region XI | 49 | 0.23 |
| Region VII | 101 | 0.23 |
| NIR | 63 | 0.22 |
| Region V | 114 | 0.21 |
| Region VI | 101 | 0.19 |
| Caraga | 73 | 0.08 |
| Region II | 93 | 0.07 |
| BARMM | 107 | 0.05 |
| Region I | 125 | -0.12 |
| NCR | 17 | -0.16 |
| CAR | 77 | -0.43 |
Regions with fewer LGUs give noisier values, and these carry no intervals. In CAR the pattern runs the other way: its towns with larger shortages tend to have fewer struggling readers.
A binomial regression puts the comparison on the scale of learners. It counts each LGU’s struggling readers out of its learners assessed and relates them to the shortage rate, measured as the logarithm of one plus the shortage per 1,000 learners. Standard errors allow for towns in the same province resembling each other. One standard deviation of that measure is 0.66, which at the median LGU is a move from 5.1 to 10.8 classrooms short per 1,000 learners.
| Model | Odds ratio per standard deviation of the logged shortage rate (95% interval) |
|---|---|
| All LGUs compared nationally | 1.15 (0.998 to 1.32) |
| LGUs compared within their region (region fixed effects) | 1.21 (1.11 to 1.31) |
An odds ratio of 1 means no association. Nationally, the interval just includes 1; within regions it lies above 1. Within regions, the odds that a learner struggles are about a fifth higher for each standard deviation of shortage; near the national 10.0%, that is roughly 1.8 percentage points. The direction agrees with the school-level result in School Resources and CRLA Reading Results, where schools with more learners per classroom had more struggling readers than comparable schools in the same division.
LGUs above the national rate on both
Splitting the LGUs at the two national rates gives four groups:
| Group | LGUs | Share of learners assessed | Share of struggling readers | Share of the 2023 shortage | Struggling | Short per 1,000 learners | Shortage met by SBP 2026 (planned) |
|---|---|---|---|---|---|---|---|
| Both above national | 254 | 16.5% | 30.9% | 23.6% | 18.6% | 11.2 | 5.2% |
| Struggling readers only | 338 | 21.6% | 30.2% | 13.5% | 14.0% | 4.5 | 11.4% |
| Classroom shortage only | 261 | 27.4% | 17.5% | 43.2% | 6.4% | 11.9 | 10.0% |
| Neither | 786 | 34.5% | 21.3% | 19.7% | 6.2% | 4.0 | 16.6% |
The 254 LGUs above on both have 158,029 struggling readers out of 847,498 learners assessed (18.6%), nearly twice their share of learners. The “Shortage met” column is the share of the 2023 shortage that SBP 2026 classrooms fill, counting each school’s new classrooms only up to its own shortage. In the LGUs above on both, 2,701 SBP classrooms are planned; 2,034 of them fall within a school’s own shortage and would meet 5.2% of a 38,970-classroom shortage, the smallest share of any group. These are planned classrooms, and part of SBP 2026 was still out for bidding. Do 2026 Classrooms Go Where the Shortage Is? explains how SBP 2026 classrooms were placed.
Which regions have the most LGUs above on both
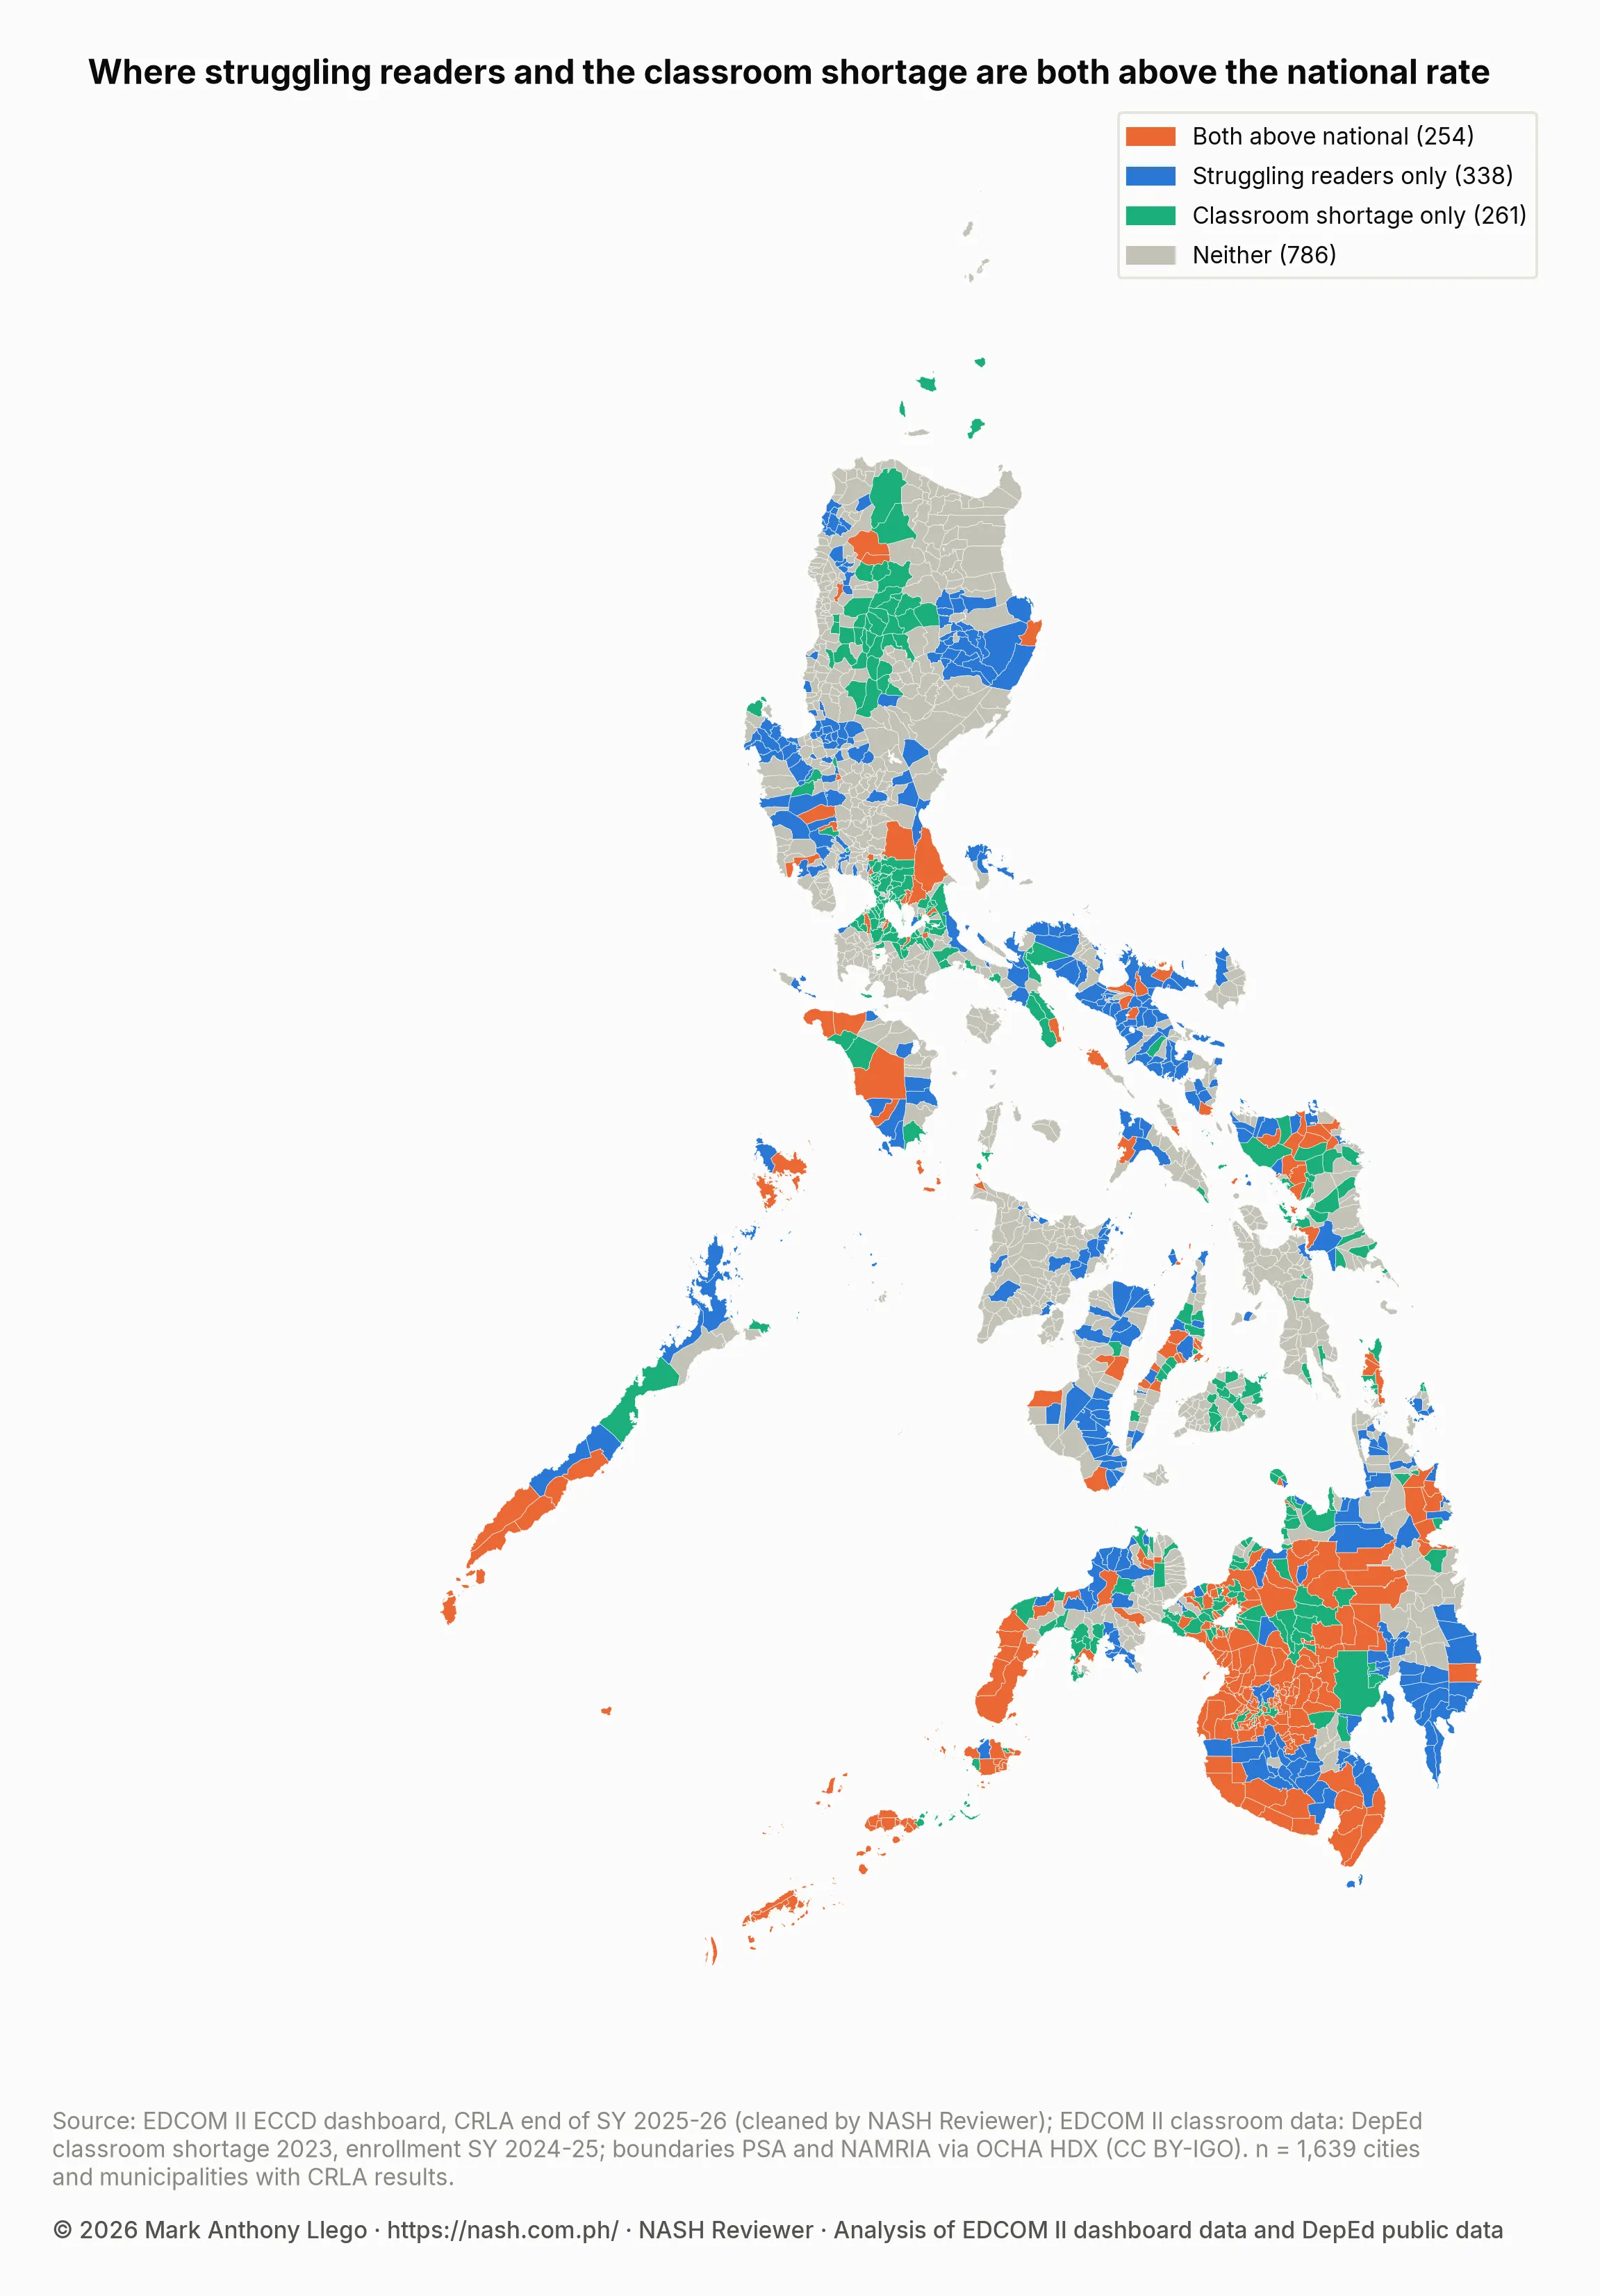
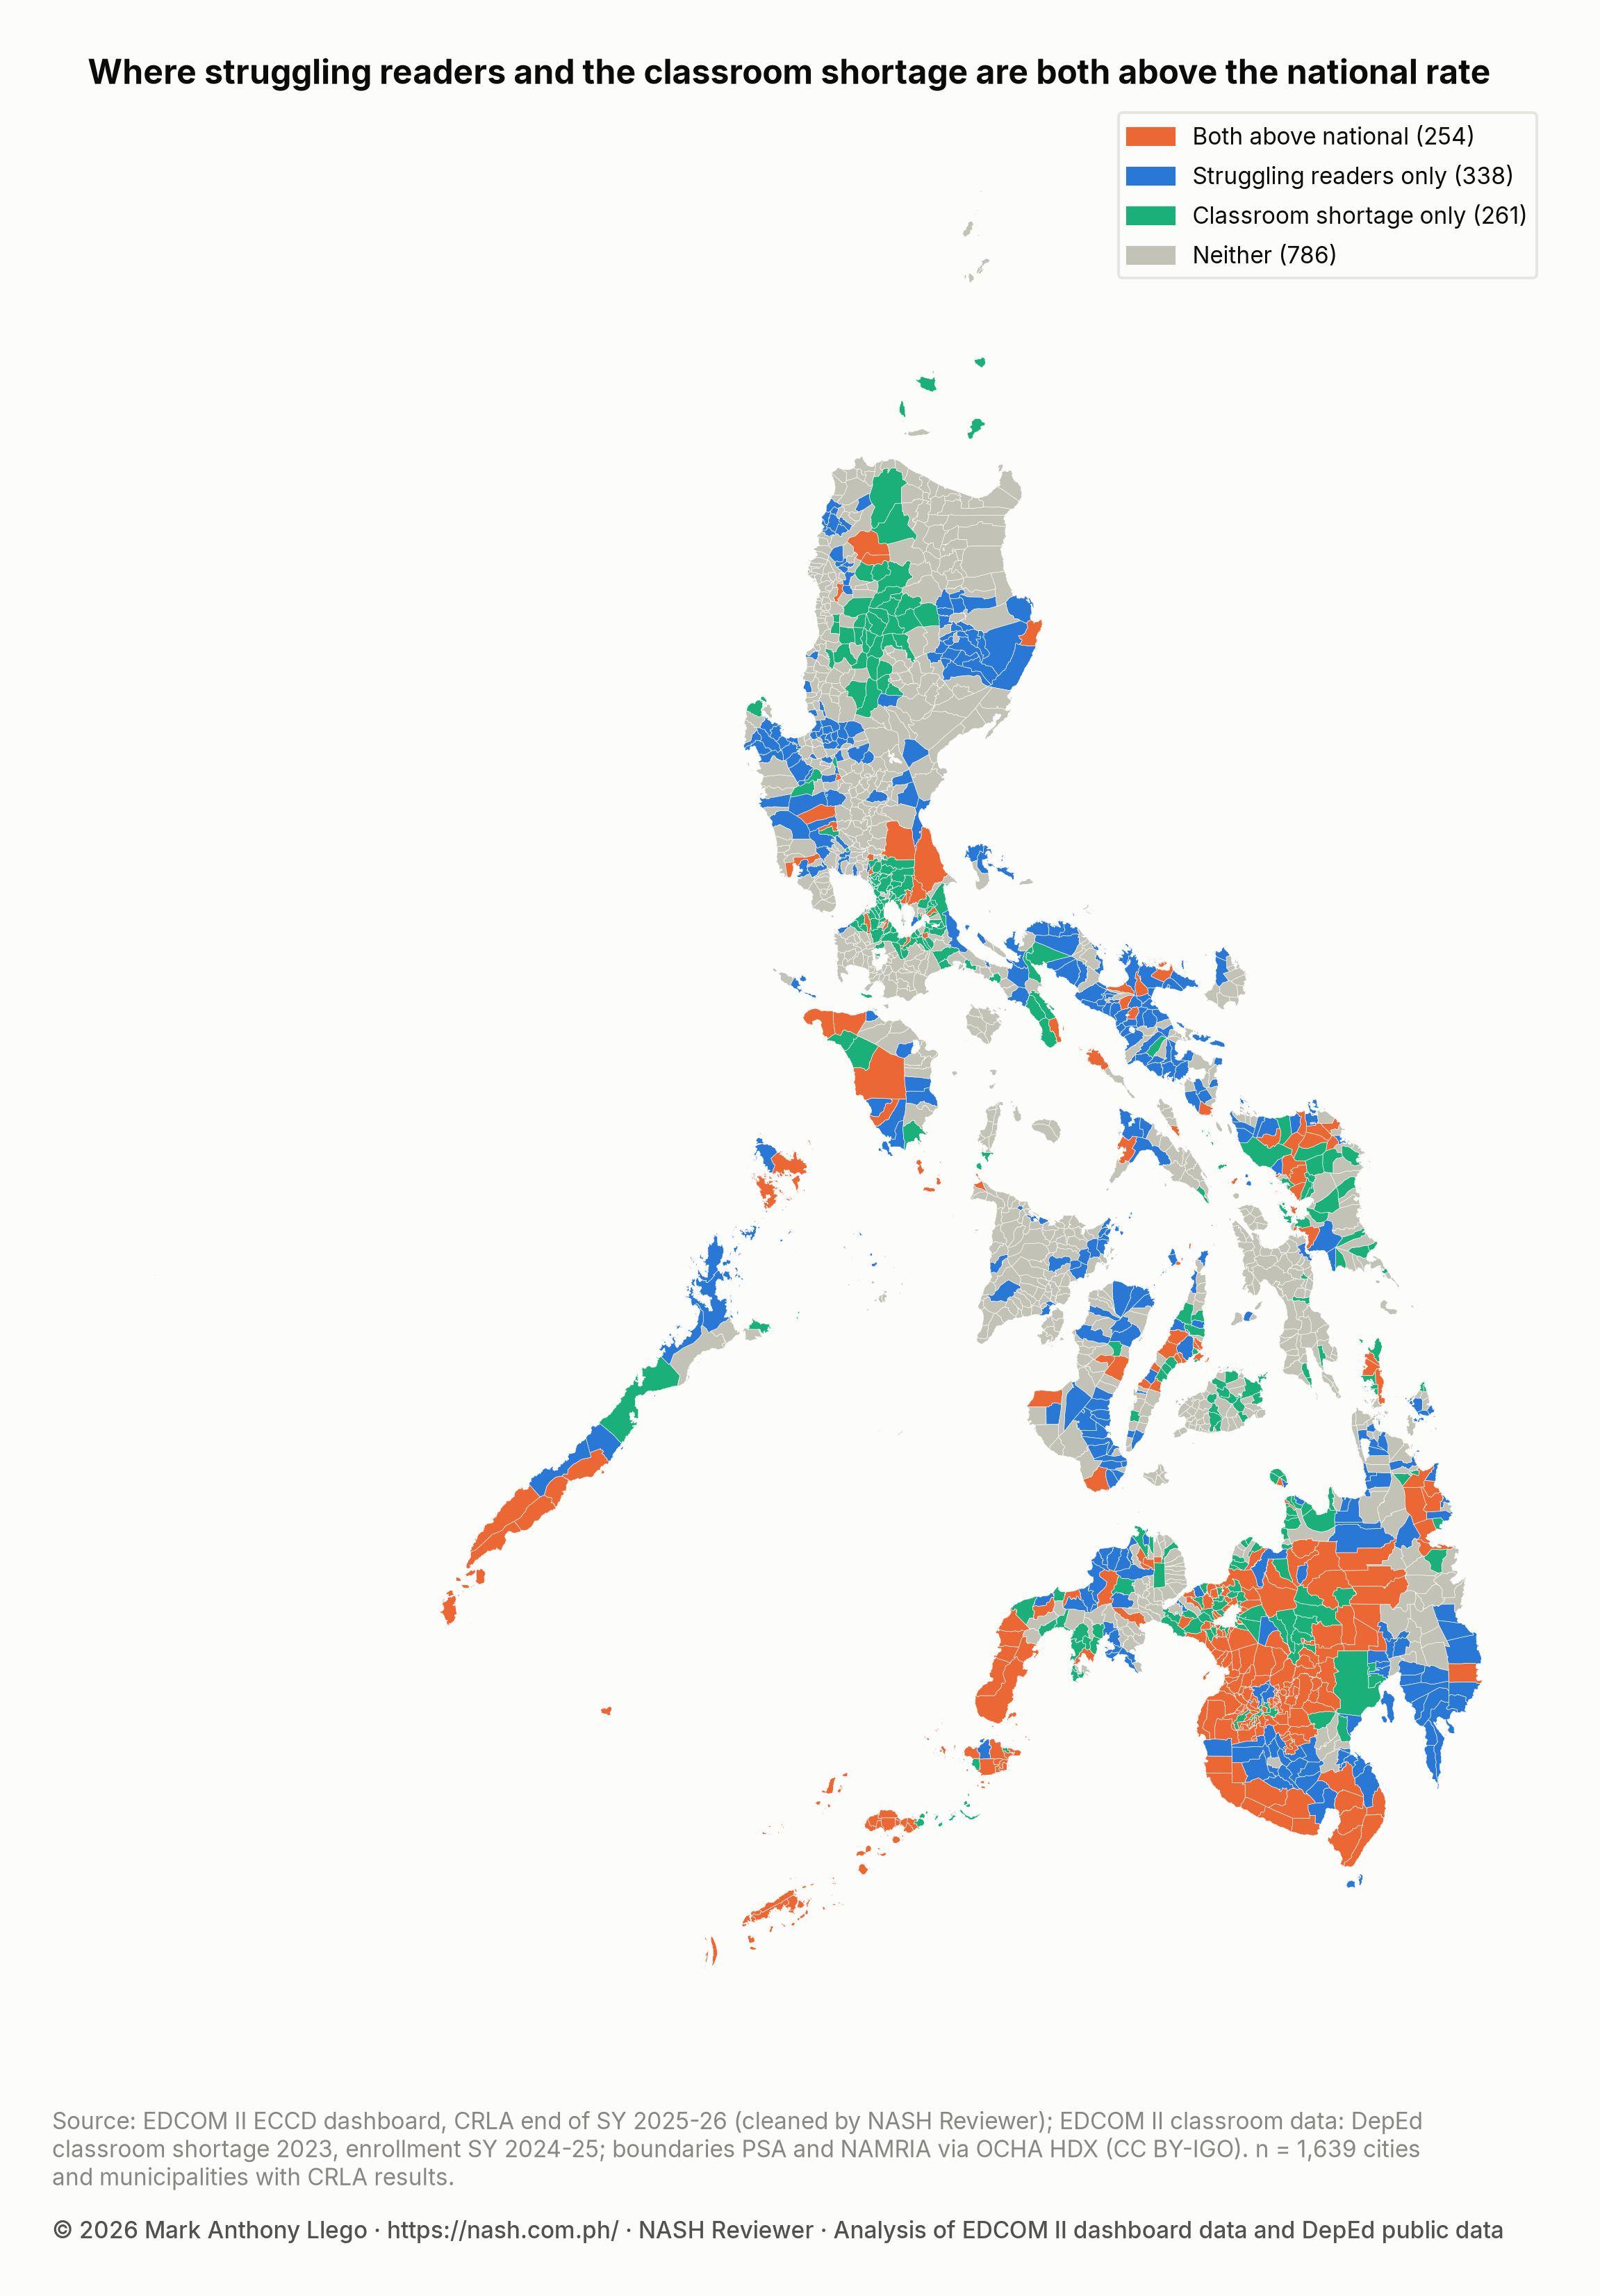
The 254 LGUs are spread unevenly. BARMM has 85 of its 107 cities and municipalities above on both, and they hold 95.2% of the region’s struggling readers. Region IX follows with 28 (66.2% of its struggling readers), 15 of them in Sulu, which the PSGC counts in Region IX; then Region XII with 27 (56.7%) and Region X with 24 (43.9%). Region I and NCR have none.
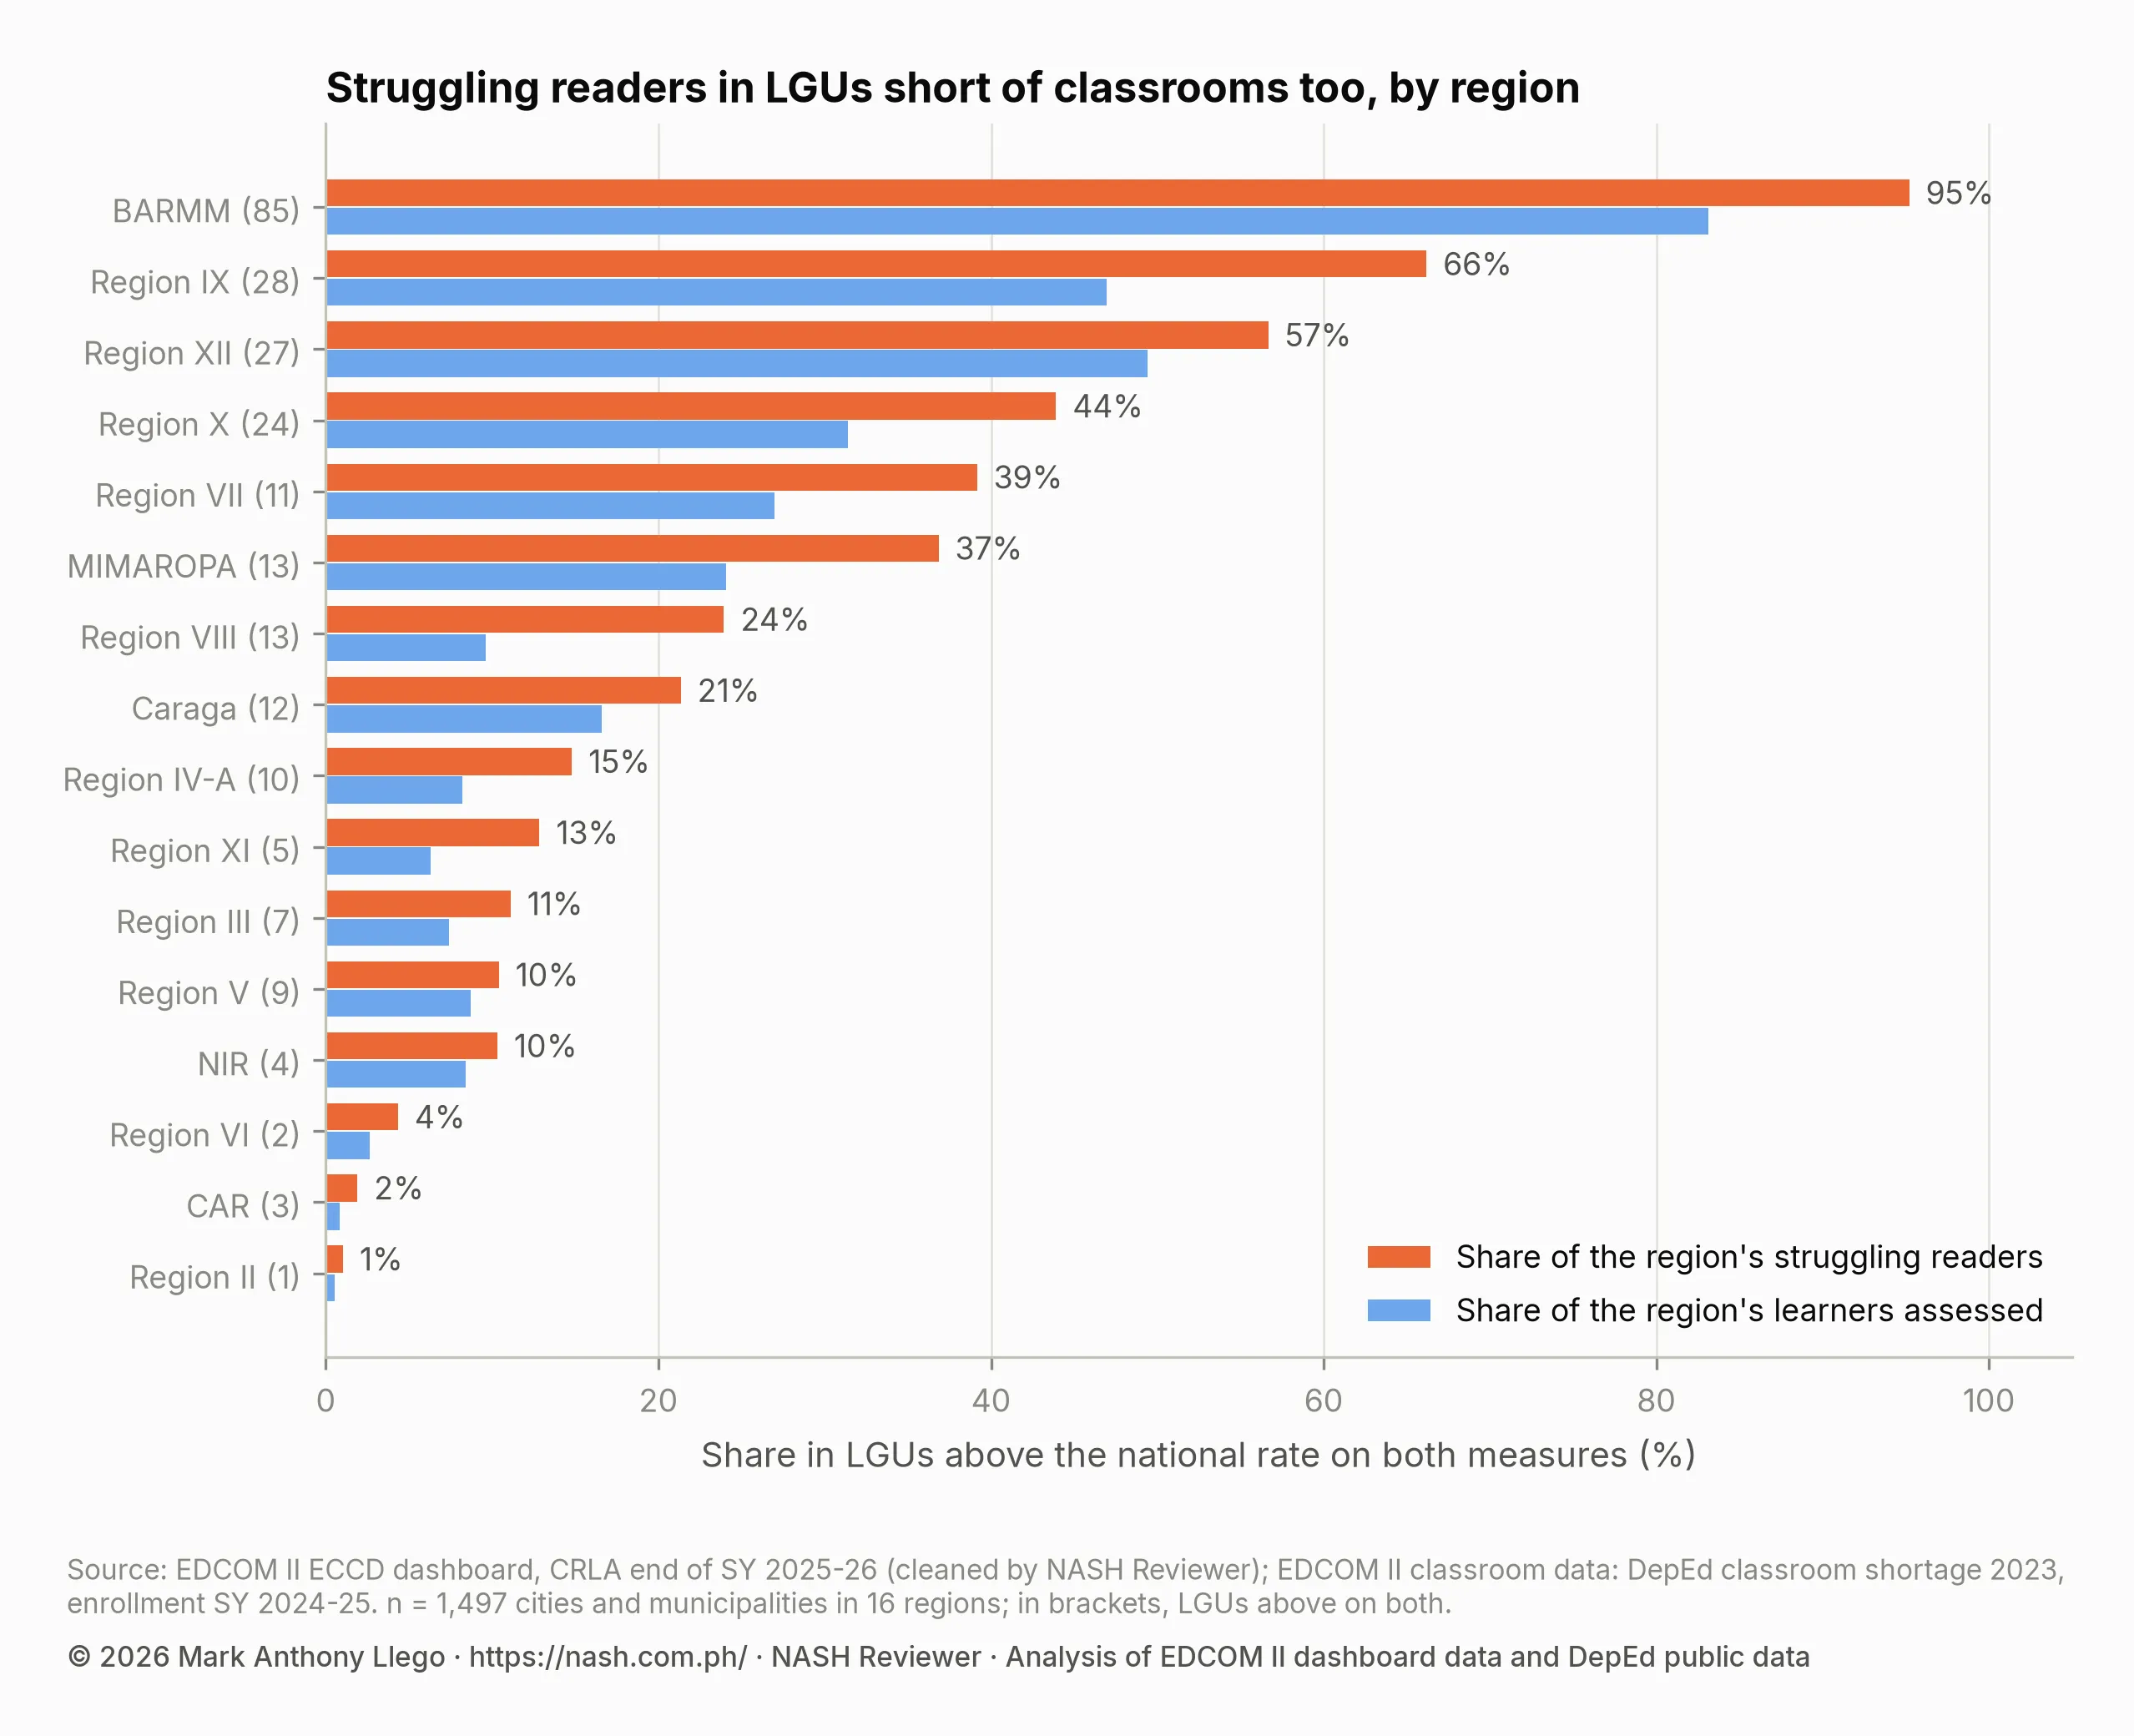
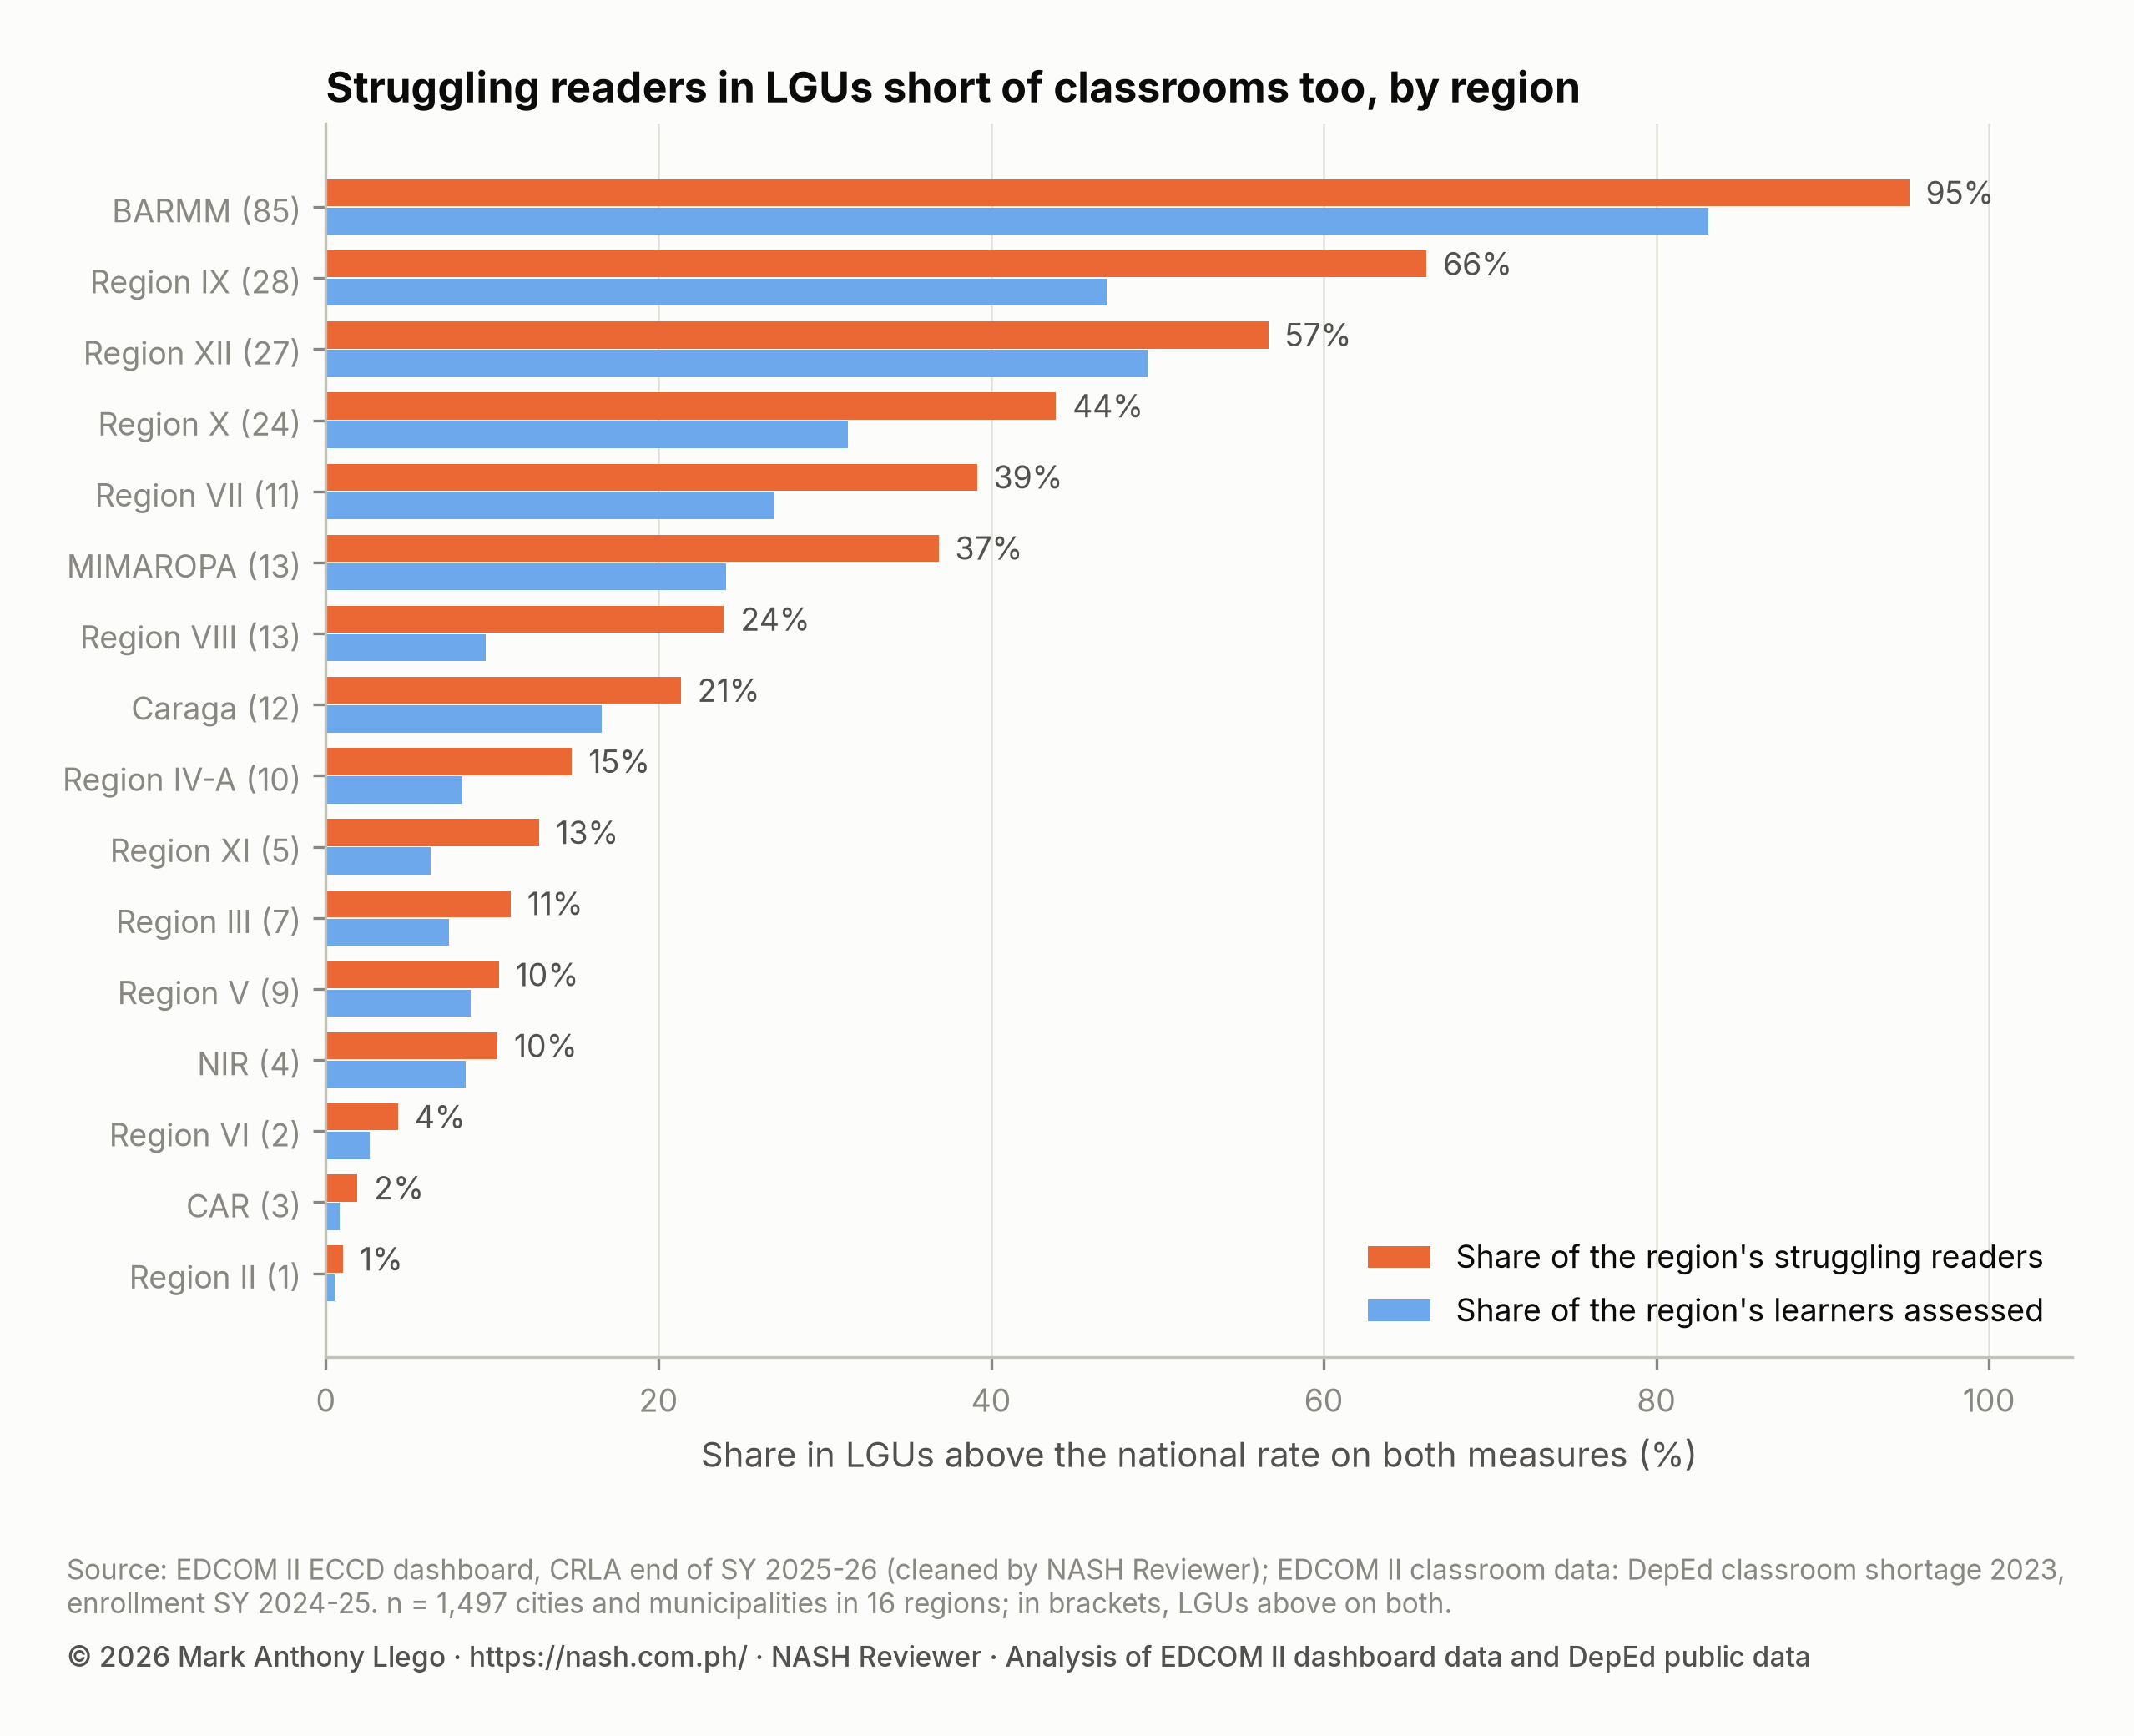
The overlap is not only a BARMM story. Outside BARMM and Sulu, 154 LGUs are above on both, with 103,986 struggling readers. Region VII has 11 such LGUs holding 39.1% of its struggling readers, and MIMAROPA has 13 holding 36.8%. Which LGUs Carry Several Early-Childhood Burdens? adds stunting and barangays without a child development center to these two measures.
Where the two cluster on the map
LGUs are not islands: a town’s learners may attend school in the next town, and neighbors share roads, incomes and histories. The bivariate Moran’s I measures whether an LGU’s share of struggling readers goes with its neighbors’ shortage rates. It is 0.293, where 0 would mean no such pattern, and none of 9,999 random reshufflings of the map came as high (p = 0.0001). Neighbors are LGUs that share a border or a corner, and the 48 island LGUs with no such neighbor are linked to the nearest one.
The local version finds where this happens. After a correction for testing 1,639 places at once (the Benjamini–Hochberg false discovery rate at 5%), 105 LGUs are high-high: many struggling readers, with neighbors short of classrooms. Of these, 53 are in BARMM, 16 in Region X, 12 in Region XII and 9 in Region IX (8 of them in Sulu). Together they hold 72,738 struggling readers, 14.2% of the national count, from 7.5% of the learners assessed. The cluster of each LGU is in the downloadable table.
Why the two may go together
A classroom shortage can affect early reading directly. When rooms are short, schools hold classes in shifts or crowd learners into one room, and Grade 1–3 learners may lose time on task and attention from the teacher; Class Shifts and Crowded Classrooms in DepEd Schools shows how common that is.
The link may also come from what both measures follow: poverty, conflict, distance, fast-growing enrollment and the language of instruction. These data cannot separate the two. They compare places, not learners, and a town’s shortage rate describes all its schools, while its struggling readers may be concentrated in a few. Read the association as a guide to where the two needs meet, not as the effect of a classroom on reading.
What this means for school heads
A school in an LGU above the national rate on both carries two problems that compete for the same local money. The table for all 1,639 LGUs shows which group a town is in, its share of struggling readers, its shortage and the SBP 2026 classrooms it is getting.
- Use the school’s own CRLA results for ARAL-Reading. Under DepEd Memorandum No. 064, s. 2025, Grade 1–3 learners at the Low or High Emerging level take part in ARAL-Reading, grouped by grade and proficiency level, and the school head finalizes the grouping (Encl. No. 2, items 4, 6 and 8). The memorandum let schools with several class shifts hold ARAL-Reading on weekends, in sessions of up to two hours (Encl. No. 2, item 19). The ARAL Program itself is set by DepEd Order No. 018, s. 2025, and DepEd Order No. 009, s. 2026 sets the SY 2026-2027 three-term calendar; Curriculum Implementation in DepEd: A School Head’s Guide explains how the two fit together.
- Bring both numbers to the Local School Board. Under Joint Circular No. 01, s. 2025, the Special Education Fund may pay for classrooms where there is a shortage and for para-teachers who serve as ARAL tutors (Annex C), but only for items in the DepEd-approved School Improvement Plan and Division Education Development Plan (Sec. 6.3) and not adequately funded by DepEd or other national agencies (Sec. 7.1). Local School Boards and the Special Education Fund explains what it may fund. EDCOM II’s template ordinances include one for the ARAL Program and one for barangay reading nooks, in its LGU Resource Center.
- Plan with the shortage that remains. Where SBP 2026 meets only a small part of the shortage, the School Improvement Plan should assume crowded rooms for some years and plan reading support around them.
Using data to set the school’s priorities and working with the LGU on them is part of Domain 1, Leading Strategically and Domain 5, Building Connections of the Philippine Professional Standards for School Heads.
Frequently asked questions
Does a classroom shortage cause more struggling readers?
These data cannot show that. They show that LGUs shorter of classrooms tend to have more struggling readers (rank correlation 0.23; odds ratio 1.21 per standard deviation within regions), but both may follow poverty, conflict or remoteness. At the school level, schools with more learners per classroom also had more struggling readers than comparable schools.
Which LGUs have both many struggling readers and a large classroom shortage?
254 of the 1,639 cities and municipalities are above the national rate on both: 10.0% struggling readers and 7.3 classrooms short per 1,000 learners. BARMM has 85 of them, Region IX 28, Region XII 27 and Region X 24. Each LGU’s group is in the downloadable table.
Do SBP 2026 classrooms go to these LGUs?
Fewer than to other LGUs, relative to need. In the LGUs above on both, the 2,701 planned SBP 2026 classrooms would meet 5.2% of the 2023 shortage, against 16.6% in LGUs below the national rate on both (SBP 2026 masterlist; DepEd classroom shortage 2023).
Why is the national shortage rate 7.3 here and 7.4 in other posts?
The 7.3 divides the shortage of the 1,639 LGUs with CRLA results by all their SY 2024-25 enrollment, 22,536,990 learners. The national 7.4 per 1,000 divides the full 165,443-classroom shortage by the 22,429,992 learners in the 47,524 schools with learners in the shortage table. At 7.4, Subic, Zambales, and Rizal, Palawan, would leave the 254, and the remaining 252 would hold 30.5% of struggling readers.
Download the data
- reading-shortage-lgus.csv: all 1,639 cities and municipalities with CRLA results, with learners assessed, struggling readers, the estimated share struggling, SY 2024-25 enrollment, the 2023 classroom shortage and its rate per 1,000 learners, SBP 2026 classrooms, the shortage left after SBP 2026, the group and the local map cluster. Sources: DepEd CRLA end of SY 2025-26 (EDCOM II ECCD dashboard); DepEd classroom shortage 2023, SY 2024-25 enrollment and SBP 2026 masterlist (EDCOM II classroom construction dashboard).
- reading-shortage-scatter.csv, reading-shortage-map.csv and reading-shortage-by-region.csv: the data behind Figures 1 to 3.
How the EDCOM Dashboard Data Was Cleaned and How the EDCOM Classroom Data Was Cleaned describe the cleaned data. The CSVs and charts may be reused only with written permission: email support@nash.com.ph. The underlying figures come from DepEd’s CRLA results and classroom data, which you can cite directly.
Sources
DepEd issuances
- DepEd Memorandum No. 064, s. 2025, Implementing Guidelines for the Academic Recovery and Accessible Learning Program in Reading for Key Stages 1 to 3, 1 August 2025, Encl. No. 2, items 4, 6, 8 and 19.
- DepEd Order No. 018, s. 2025, Implementing Guidelines of the Academic Recovery and Accessible Learning Program, 13 June 2025.
- DepEd Order No. 009, s. 2026, Guidelines on the Implementation of the Three-Term School Calendar in Basic Education, 16 April 2026.
- DepEd, DBM, DILG and DOF, Joint Circular No. 01, s. 2025, Omnibus Guidelines on the Use of the Special Education Fund, Secs. 6.3 and 7.1 and Annex C.
Data
- Department of Education, Comprehensive Rapid Literacy Assessment, end of SY 2025-26, as of 10 May 2026, as published in the EDCOM II Early Childhood Dashboard.
- Department of Education, 2023 classroom shortage by school, SY 2024-25 enrollment and the School Building Program 2026 masterlist, as published in the EDCOM II classroom construction dashboard; cleaned data at nash.com.ph/edcom-classroom-data.
- Boundaries: Philippine Statistics Authority and NAMRIA, via OCHA’s Humanitarian Data Exchange (CC BY-IGO).
EDCOM II
- EDCOM II. Template ordinances and resolutions, including those listed in the LGU Resource Center as “Institutionalizing the Local Implementation of the ARAL Program” and “Creating Barangay Reading Nooks”.
More in this series
- CRLA End-of-Year Results SY 2025-26: All 18 Regions
- CRLA Start vs End of SY 2025-26 in the Same Schools
- CRLA by Language: Mother Tongue, Filipino and English
- How to Read a School’s CRLA Results Fairly
- CRLA Variation: School, Division or Region?
- Where Struggling Readers Are Concentrated
- School Resources and CRLA Reading Results
- CRLA Results in Schools With and Without a Principal
- Action Research and Thesis Topics on Reading (CRLA)
- CRLA Reading Hotspots: A Map of Struggling Readers
- Stunting, Day Care Centers and Early Reading
- Literacy and Nutrition Programs Compared With Need
- Where Struggling Readers and Classroom Shortages Meet (this post)
- Which LGUs Carry Several Early-Childhood Burdens?
- How to Read EDCOM’s LGU Early Childhood Report Card
- CRLA Schools With No Struggling Readers: A Data Check
- How the EDCOM Dashboard Data Was Cleaned
- Regional reports: NCR, CAR, Region I, Region II, Region III, Region IV-A, MIMAROPA, Region V, Region VI, NIR, Region VII, Region VIII, Region IX, Region X, Region XI, Region XII, Caraga, BARMM
- Earlier reports: CRLA Results SY 2025-2026 (DepEd’s selected-school file), Do the Same DepEd Schools Lag on the ELLNA, NAT and CRLA?, DepEd School Inputs vs Test Results, EDCOM II Final Report: Guide for Aspiring School Heads, DepEd Data for Aspiring School Heads: Where to Start
Written by Mark Anthony Llego for NASH Reviewer. Sources: DepEd CRLA end of SY 2025-26, DepEd classroom shortage 2023, SY 2024-25 enrollment and SBP 2026 masterlist, as published by EDCOM II. NASH Reviewer is not affiliated with EDCOM II or DepEd. Charts may be reused only with written permission from support@nash.com.ph.