The President’s proposed budget for 2027, the National Expenditure Program (NEP) for FY 2027, gives the Department of Education ₱975,962,852,000. Of that, ₱973,401,129,000 goes to the Office of the Secretary, which runs every public school DepEd manages, and ₱2,561,723,000 to six attached agencies. The Office of the Secretary’s new appropriations, ₱914,244,750,000, are ₱44,451,359,000 (4.6%) less than its new appropriations for 2026; the rest is the automatic appropriation for retirement and life insurance premiums (NEP FY 2027, Volume I, p. 343).
The proposal moves money toward pay and away from buildings. Personnel services take 78.8% of the 2027 total, and their ₱766.74 billion is ₱60.95 billion more than in 2026, while capital outlays fall from ₱99.47 billion to ₱32.34 billion. Almost every high school’s MOOE line in the NEP repeats its FY 2026 School MOOE allocation to the peso, though DepEd says it will distribute 2027 school MOOE under a new formula. The proposal funds teaching positions already created and 2,021 counselor positions; the 1,000 new School Principal I positions the President’s Budget Message names have no line of their own in DepEd’s chapter of the NEP.
Every figure below is a line of the NEP, set against the learners enrolled in SY 2025-2026 where the question is how much each learner gets. The finder further down shows the 2027 lines of any region, schools division, or school with a junior or senior high line.
Key findings
- DepEd’s proposal for 2027 is ₱975.96 billion. The Office of the Secretary gets ₱973.40 billion: ₱914.24 billion in new appropriations and ₱59.16 billion in retirement and life insurance premiums. Its new appropriations were ₱958.70 billion in 2026 (NEP FY 2027, Vol. I, p. 343).
- Pay rises; buildings fall. Salaries of permanent positions rise by ₱43.45 billion, to ₱492.97 billion, while spending on buildings and other structures falls by ₱65.29 billion, to ₱32.23 billion. The target for new classrooms built falls from 4,869 in 2026 to 700 in 2027 (NEP FY 2027, Vol. I, pp. 595-597 and 599).
- The NEP repeats each high school’s FY 2026 MOOE, but DepEd plans a new formula. 10,507 of 10,508 junior high MOOE lines and 7,674 of 7,675 senior high lines equal DepEd’s FY 2026 School MOOE allocation to the peso, and three FY 2026 lines have no 2027 line. DepEd says it will “fully implement its Simplified Normative Funding Formula” in 2027 (DBM, NEP FY 2027 data; DepEd, School MOOE Allocation, FY 2026; Daily Tribune, September 24, 2026).
- The proposal pays to fill 64,530 teaching positions already created, and creates none. ₱31.22 billion at the Central Office pays for them; the NEP’s target for newly created teaching positions filled in 2027 is zero, and its ₱801.58 million for new positions is the amount DepEd and DBM give for 1,800 School Counselor Associate I and 221 School Division Counselor positions (NEP FY 2027 data and p. 600; DepEd-DBM joint statement, September 10, 2026; President’s Budget Message, p. 19).
- 1,000 new School Principal I positions are in the Budget Message and DBM’s statements, but in no line of DepEd’s NEP chapter. The Budget Message funds them within ₱513 million that also pays for promoting acting school heads and reclassifying Head Teachers; DepEd had asked for 14,126 (President’s Budget Message, p. 20; Philippine Daily Inquirer, September 8, 2026).
- The money per learner is uneven across regions. The regions’ 2027 lines come to ₱35,197 per learner enrolled in SY 2025-2026, from ₱28,594 in the National Capital Region to ₱54,741 in the Cordillera Administrative Region (NEP FY 2027 data; DepEd enrollment, SY 2025-2026).
- Across schools divisions, elementary money is the least even. The Gini index of money per learner across 218 divisions is 0.141 for elementary, 0.085 for junior high, and 0.051 for senior high, and by the Theil index 62.3% of the elementary inequality lies between regions. In junior and senior high, smaller divisions get more per learner however the line is fitted (NEP FY 2027 data; DepEd enrollment, SY 2025-2026).
How big DepEd’s 2027 budget is
The NEP prints each agency’s money three ways for three years: 2025 as spent (“actual”), 2026 as the current year’s program (“current”), and 2027 as proposed. The Office of the Secretary’s obligations, which include the retirement and life insurance premiums, are:
| Office of the Secretary | 2025 actual | 2026 current | 2027 proposed |
|---|---|---|---|
| Personnel services | ₱666,795,828,000 | ₱705,785,453,000 | ₱766,739,963,000 |
| Maintenance and other operating expenses (MOOE) | ₱146,195,306,000 | ₱207,379,562,000 | ₱174,322,251,000 |
| Capital outlays | ₱9,132,528,000 | ₱99,473,592,000 | ₱32,338,915,000 |
| Total obligations | ₱822,123,662,000 | ₱1,012,638,607,000 | ₱973,401,129,000 |
Table: NEP FY 2027, Volume I, Department of Education, Obligations by Object of Expenditures, pp. 595-597.
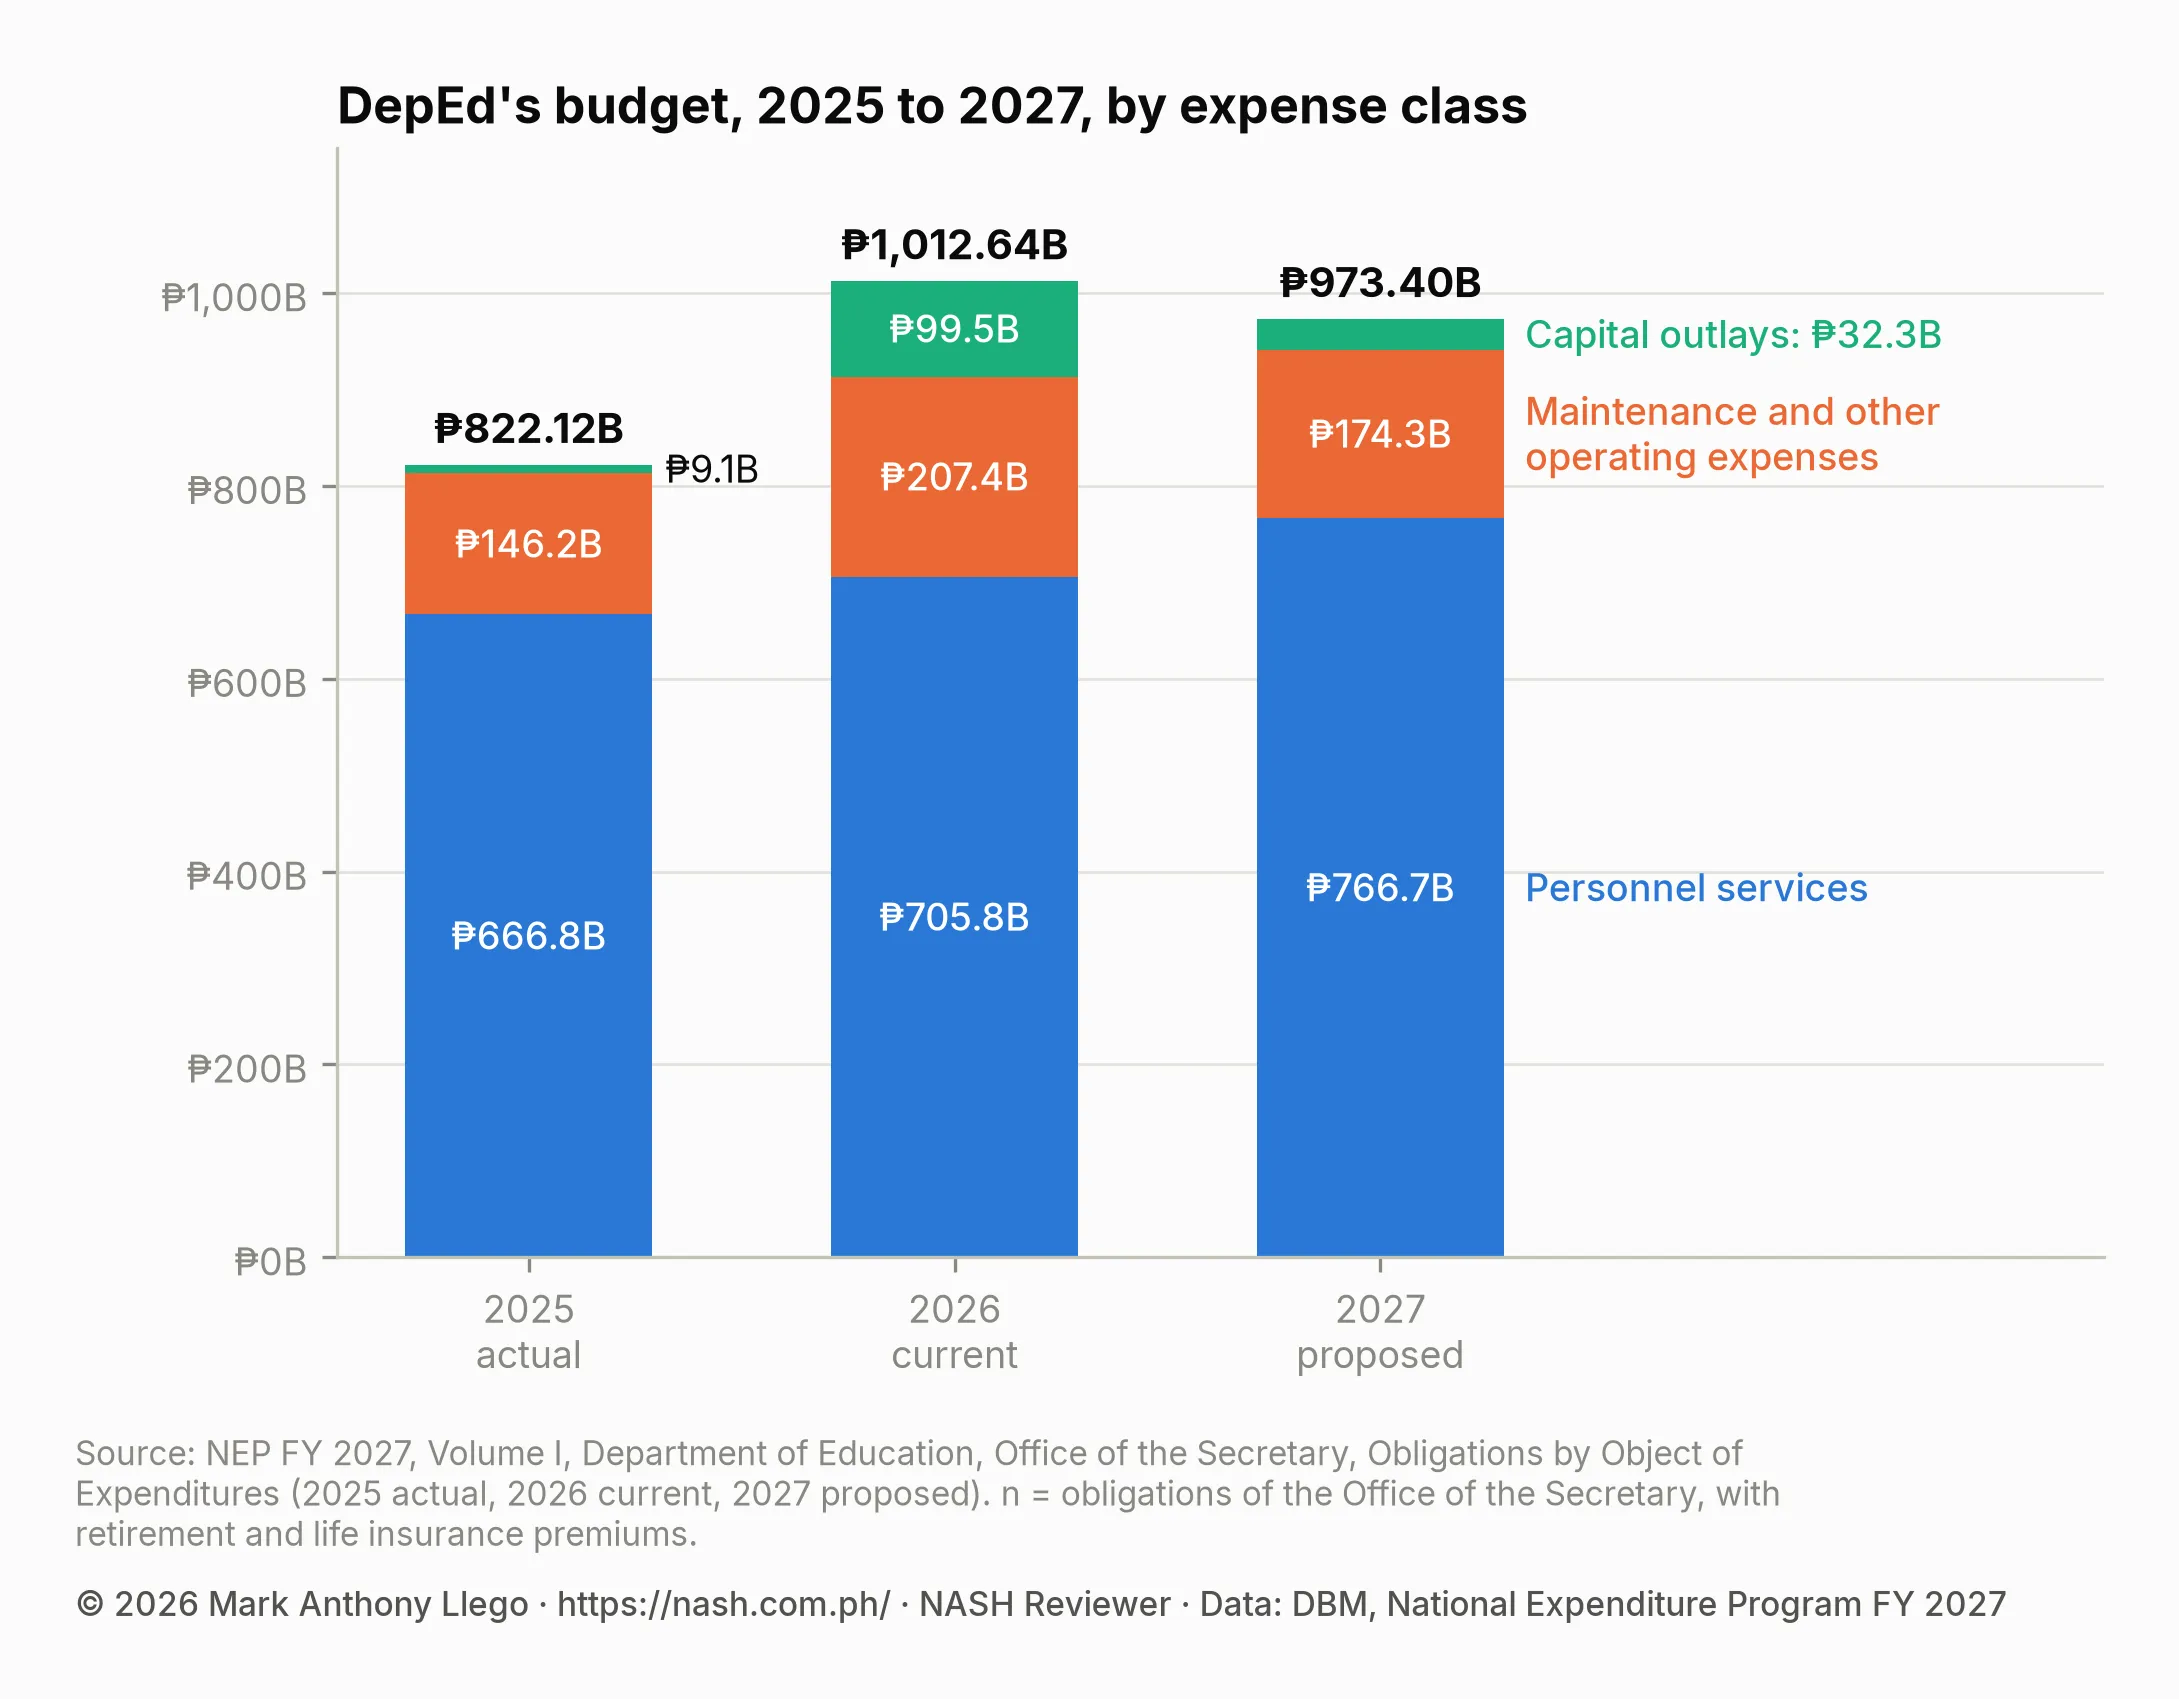
Two measures of the year-to-year change answer different questions. New general appropriations, what Congress is asked to approve for the year, fall from ₱958,696,109,000 in 2026 to ₱914,244,750,000, or 4.6%. Total obligations, which add the automatic appropriation for retirement and life insurance premiums (₱53,942,498,000 in 2026, ₱59,156,379,000 in 2027), fall from ₱1,012,638,607,000 to ₱973,401,129,000, or 3.9%: less than new appropriations, because the premiums rise by ₱5.21 billion (NEP FY 2027, Vol. I, p. 343).
The six attached agencies share ₱2,561,723,000, with their retirement and life insurance premiums: the National Museum of the Philippines ₱1,561,705,000, the Teacher Education Council ₱360,285,000, the National Academy of Sports ₱258,476,000, the National Book Development Board ₱169,964,000, the Philippine High School for the Arts ₱135,282,000, and the National Council for Children’s Television ₱76,011,000. The Early Childhood Care and Development Council has no 2027 appropriation in the NEP; its tables show 2025 spending only (NEP FY 2027, Vol. I, pp. 601-635).
What the 2027 budget pays for
Most of DepEd’s money pays people. Of the ₱973.40 billion, 78.8% is personnel services, 17.9% is MOOE, and 3.3% is capital outlays. The figure below slices the same total four ways: by expense class, by program (with every activity and project), by what the money buys, and by the office whose line carries it.
The budget, four ways
Where DepEd's ₱973.40 billion goes in the 2027 proposal
The Office of the Secretary: ₱914,244,750,000 in new appropriations and ₱59,156,379,000 in retirement and life insurance premiums, which the law appropriates automatically. With its attached agencies (₱2.56 billion), DepEd's proposal is ₱975,962,852,000.
By expense class
- Personnel services₱766.74 billion · 78.8%₱766,739,963,000. Salaries, allowances, bonuses, benefits, and the retirement and life insurance premiums.
- Maintenance and other operating expenses₱174.32 billion · 17.9%₱174,322,251,000. School and office operations, learning materials, feeding, training, subsidies.
- Capital outlays₱32.34 billion · 3.3%₱32,338,915,000. Buildings, land and equipment.
By program, with each activity and project
- General Administration and Support₱29.19 billion · 3.0%₱29,192,137,000
Its 2 activities and projects
- General Management and Supervision₱23.90 billion · 81.9%₱23,898,518,000
- Administration of Personnel Benefits₱5.29 billion · 18.1%₱5,293,619,000
- Support to Operations₱6.85 billion · 0.7%₱6,845,869,000
Its 10 activities and projects
- Learner Support Programs₱3.41 billion · 49.8%₱3,406,060,000
- Disaster Preparedness and Response Program₱2.21 billion · 32.3%₱2,210,697,000
- Physical fitness and school sports₱490.6 million · 7.2%₱490,569,000
- Organizational and Professional Development for Non-Teaching Personnel₱276.7 million · 4.0%₱276,657,000
- Planning and Management Information Systems₱174.4 million · 2.5%₱174,394,000
- Building Partnerships and Linkages Program₱84.6 million · 1.2%₱84,617,000
- Management and Administration of Learning Resources₱67 million · 1.0%₱66,973,000
- Legal Service and Development of Education-Related Laws and Rules₱63.2 million · 0.9%₱63,166,000
- Education Information and Communication Services₱45.8 million · 0.7%₱45,760,000
- Development and Management of Bilateral and Multilateral Education Projects₱27 million · 0.4%₱26,976,000
- Education Policy Development Program₱14.50 billion · 1.5%₱14,496,223,000
Its 7 activities and projects
- Curricular programs, learning management models, standards and strategy development₱8.29 billion · 57.2%₱8,287,670,000
- Basic Education Curriculum₱2.81 billion · 19.4%₱2,809,771,000
- Policy and Research Program₱2.67 billion · 18.4%₱2,669,549,000
- National Assessment Systems for Basic Education₱545.1 million · 3.8%₱545,097,000
- Early Language Literacy and Numeracy₱106.2 million · 0.7%₱106,231,000
- Development and Promotion of Campus Journalism₱62.1 million · 0.4%₱62,118,000
- National Literacy Policies and Programs₱15.8 million · 0.1%₱15,787,000
- Basic Education Inputs Program₱82.70 billion · 8.5%₱82,698,010,000
Its 8 activities and projects: By program, with each activity and project
- New School Personnel Positions₱31.74 billion · 38.4%₱31,739,474,000
- Basic Education Facilities₱30.55 billion · 36.9%₱30,551,016,000
- Textbooks and other Instructional Materials₱6.47 billion · 7.8%₱6,471,618,000
- Computerization Program₱5.79 billion · 7.0%₱5,789,345,000
- Quick Response Fund₱3.00 billion · 3.6%₱3,000,000,000
- Learning Tools and Equipment₱2.89 billion · 3.5%₱2,888,717,000
- Infrastructure for Safer and Resilient Schools (ISRS) Project WB Loan No. 9704-PHForeign-assisted project₱2.16 billion · 2.6%₱2,160,380,000
- Improvement and Acquisition of School Sites₱97.5 million · 0.1%₱97,460,000
- Inclusive Education Program₱5.36 billion · 0.6%₱5,360,270,000
Its 5 activities and projects
- Flexible Learning Options (ADM/ALS/EiE)₱3.85 billion · 71.8%₱3,848,780,000
- Special Needs Education Program₱850 million · 15.9%₱849,980,000
- Madrasah Education Program₱504.3 million · 9.4%₱504,282,000
- Multigrade Education₱81.1 million · 1.5%₱81,060,000
- Indigenous Peoples Education (IPEd) Program₱76.2 million · 1.4%₱76,168,000
- Support to Schools and Learners Program₱831.07 billion · 85.4%₱831,066,834,000
Its 8 activities and projects: By program, with each activity and project
- Operation of Schools - Elementary (Kinder to Grade 6)₱422.80 billion · 50.9%₱422,797,074,000
- Operation of Schools - Junior High School (Grade 7 to Grade 10)₱233.57 billion · 28.1%₱233,571,556,000
- Operation of Schools - Senior High School (Grade 11 to Grade 12)₱85.04 billion · 10.2%₱85,040,944,000
- Government Assistance and Subsidies₱38.12 billion · 4.6%₱38,122,494,000
- Implementation of the Grant of Cash Allowance, Hardship Pay, and Reclassification of Positions₱28.25 billion · 3.4%₱28,249,460,000
- School-Based Feeding Program (SBFP)₱11.43 billion · 1.4%₱11,431,217,000
- Project for Learning Upgrade Support and Decentralization (PLUS-D) WB Loan No. 9933-PHForeign-assisted project₱10.81 billion · 1.3%₱10,814,196,000
- World Teachers' Day Incentive Benefits₱1.04 billion · 0.1%₱1,039,893,000
- Education Human Resource Development Program₱3.74 billion · 0.4%₱3,741,786,000
Its 3 activities and projects
- Human resource development for personnel in schools and learning centers₱3.02 billion · 80.7%₱3,018,722,000
- Teacher Effectiveness and Competencies Enhancement Project (TEACEP) WB Loan No. 9481-PHForeign-assisted project₱719.8 million · 19.2%₱719,823,000
- Teacher Quality and Development Program₱3.2 million · 0.1%₱3,241,000
By what the money buys
- Salaries of permanent positions₱492.97 billion · 50.6%₱492,971,596,000
- Bonuses and cash gift₱87.38 billion · 9.0%₱87,377,872,000
- Retirement, insurance and other contributions₱72.73 billion · 7.5%₱72,725,137,000
- Allowances and other pay₱52.22 billion · 5.4%₱52,224,201,000
- Positions to fill and create, reclassification, step increments, loyalty awards and incentives₱49.98 billion · 5.1%₱49,983,031,000
- Supplies and materials₱49.41 billion · 5.1%₱49,412,189,000
- Government Assistance and Subsidies (ESC, senior high and joint delivery vouchers)₱38.12 billion · 3.9%₱38,122,494,000
- Other operating expenses₱35.16 billion · 3.6%₱35,161,681,000
- Capital outlays: buildings, land and equipment₱32.34 billion · 3.3%₱32,338,915,000
- Subsidies to operating units (school-based programs)₱25.52 billion · 2.6%₱25,521,076,000
- Textbooks, learning materials and the teaching allowance₱16.84 billion · 1.7%₱16,835,768,000
- Training₱12.54 billion · 1.3%₱12,536,864,000
- Substitute teachers and casual staff₱8.19 billion · 0.8%₱8,190,305,000
By the office that holds the line
- Central Office₱164.67 billion · 16.9%₱164,667,845,000. Its largest lines are Government Assistance and Subsidies (ESC and the vouchers), the pay for teaching positions to be filled, school buildings, a World Bank project and the teaching allowance; none of it is assigned to a region in the NEP.
- Schools division offices₱532.40 billion · 54.7%₱532,401,489,000. The 221 division offices' lines, which carry every elementary teacher's pay and elementary school MOOE.
- Schools₱239.24 billion · 24.6%₱239,238,165,000. The 11,001 schools with lines of their own, for junior and senior high school.
- Regional offices₱37.09 billion · 3.8%₱37,093,630,000. The 17 regional offices, with Baguio Teachers Camp.
DBM, National Expenditure Program FY 2027, data (NEP-FY2027.xlsx), Department of Education, Office of the Secretary. Shares are of ₱973,401,129,000; each program's activities are shares of the program.
The program view shows where DepEd’s work sits. The Support to Schools and Learners Program, which carries the salaries and MOOE of every school, holds ₱831.07 billion with its premiums; its three largest activities are the operation of elementary schools (₱422.80 billion), junior high schools (₱233.57 billion) and senior high schools (₱85.04 billion). The Basic Education Inputs Program, which buys classrooms, textbooks, computers and new teachers’ pay, holds ₱82.70 billion.
The programs’ budgets for three years, as the NEP’s performance tables print them, show where the 2027 cut falls:
| Program | 2025 actual | 2026 | 2027 proposed | 2026 to 2027 |
|---|---|---|---|---|
| Education Policy Development | ₱14,935,348,000 | ₱16,927,578,000 | ₱14,496,223,000 | −14.4% |
| Basic Education Inputs | ₱57,425,714,000 | ₱174,723,403,000 | ₱82,698,010,000 | −52.7% |
| Inclusive Education | ₱6,737,196,000 | ₱6,780,332,000 | ₱5,360,270,000 | −20.9% |
| Support to Schools and Learners | ₱669,887,328,000 | ₱767,976,021,000 | ₱831,066,834,000 | +8.2% |
| Education Human Resource Development | ₱3,836,533,000 | ₱5,136,357,000 | ₱3,741,786,000 | −27.2% |
| Operations | ₱752,822,119,000 | ₱971,543,691,000 | ₱937,363,123,000 | −3.5% |
Table: NEP FY 2027, Volume I, Department of Education, Performance Information, pp. 597-600. Operations excludes General Administration and Support and Support to Operations.
What changed from 2026 to 2027
The object-of-expenditure table shows each kind of spending for both years. Fifteen items moved by ₱1 billion or more.
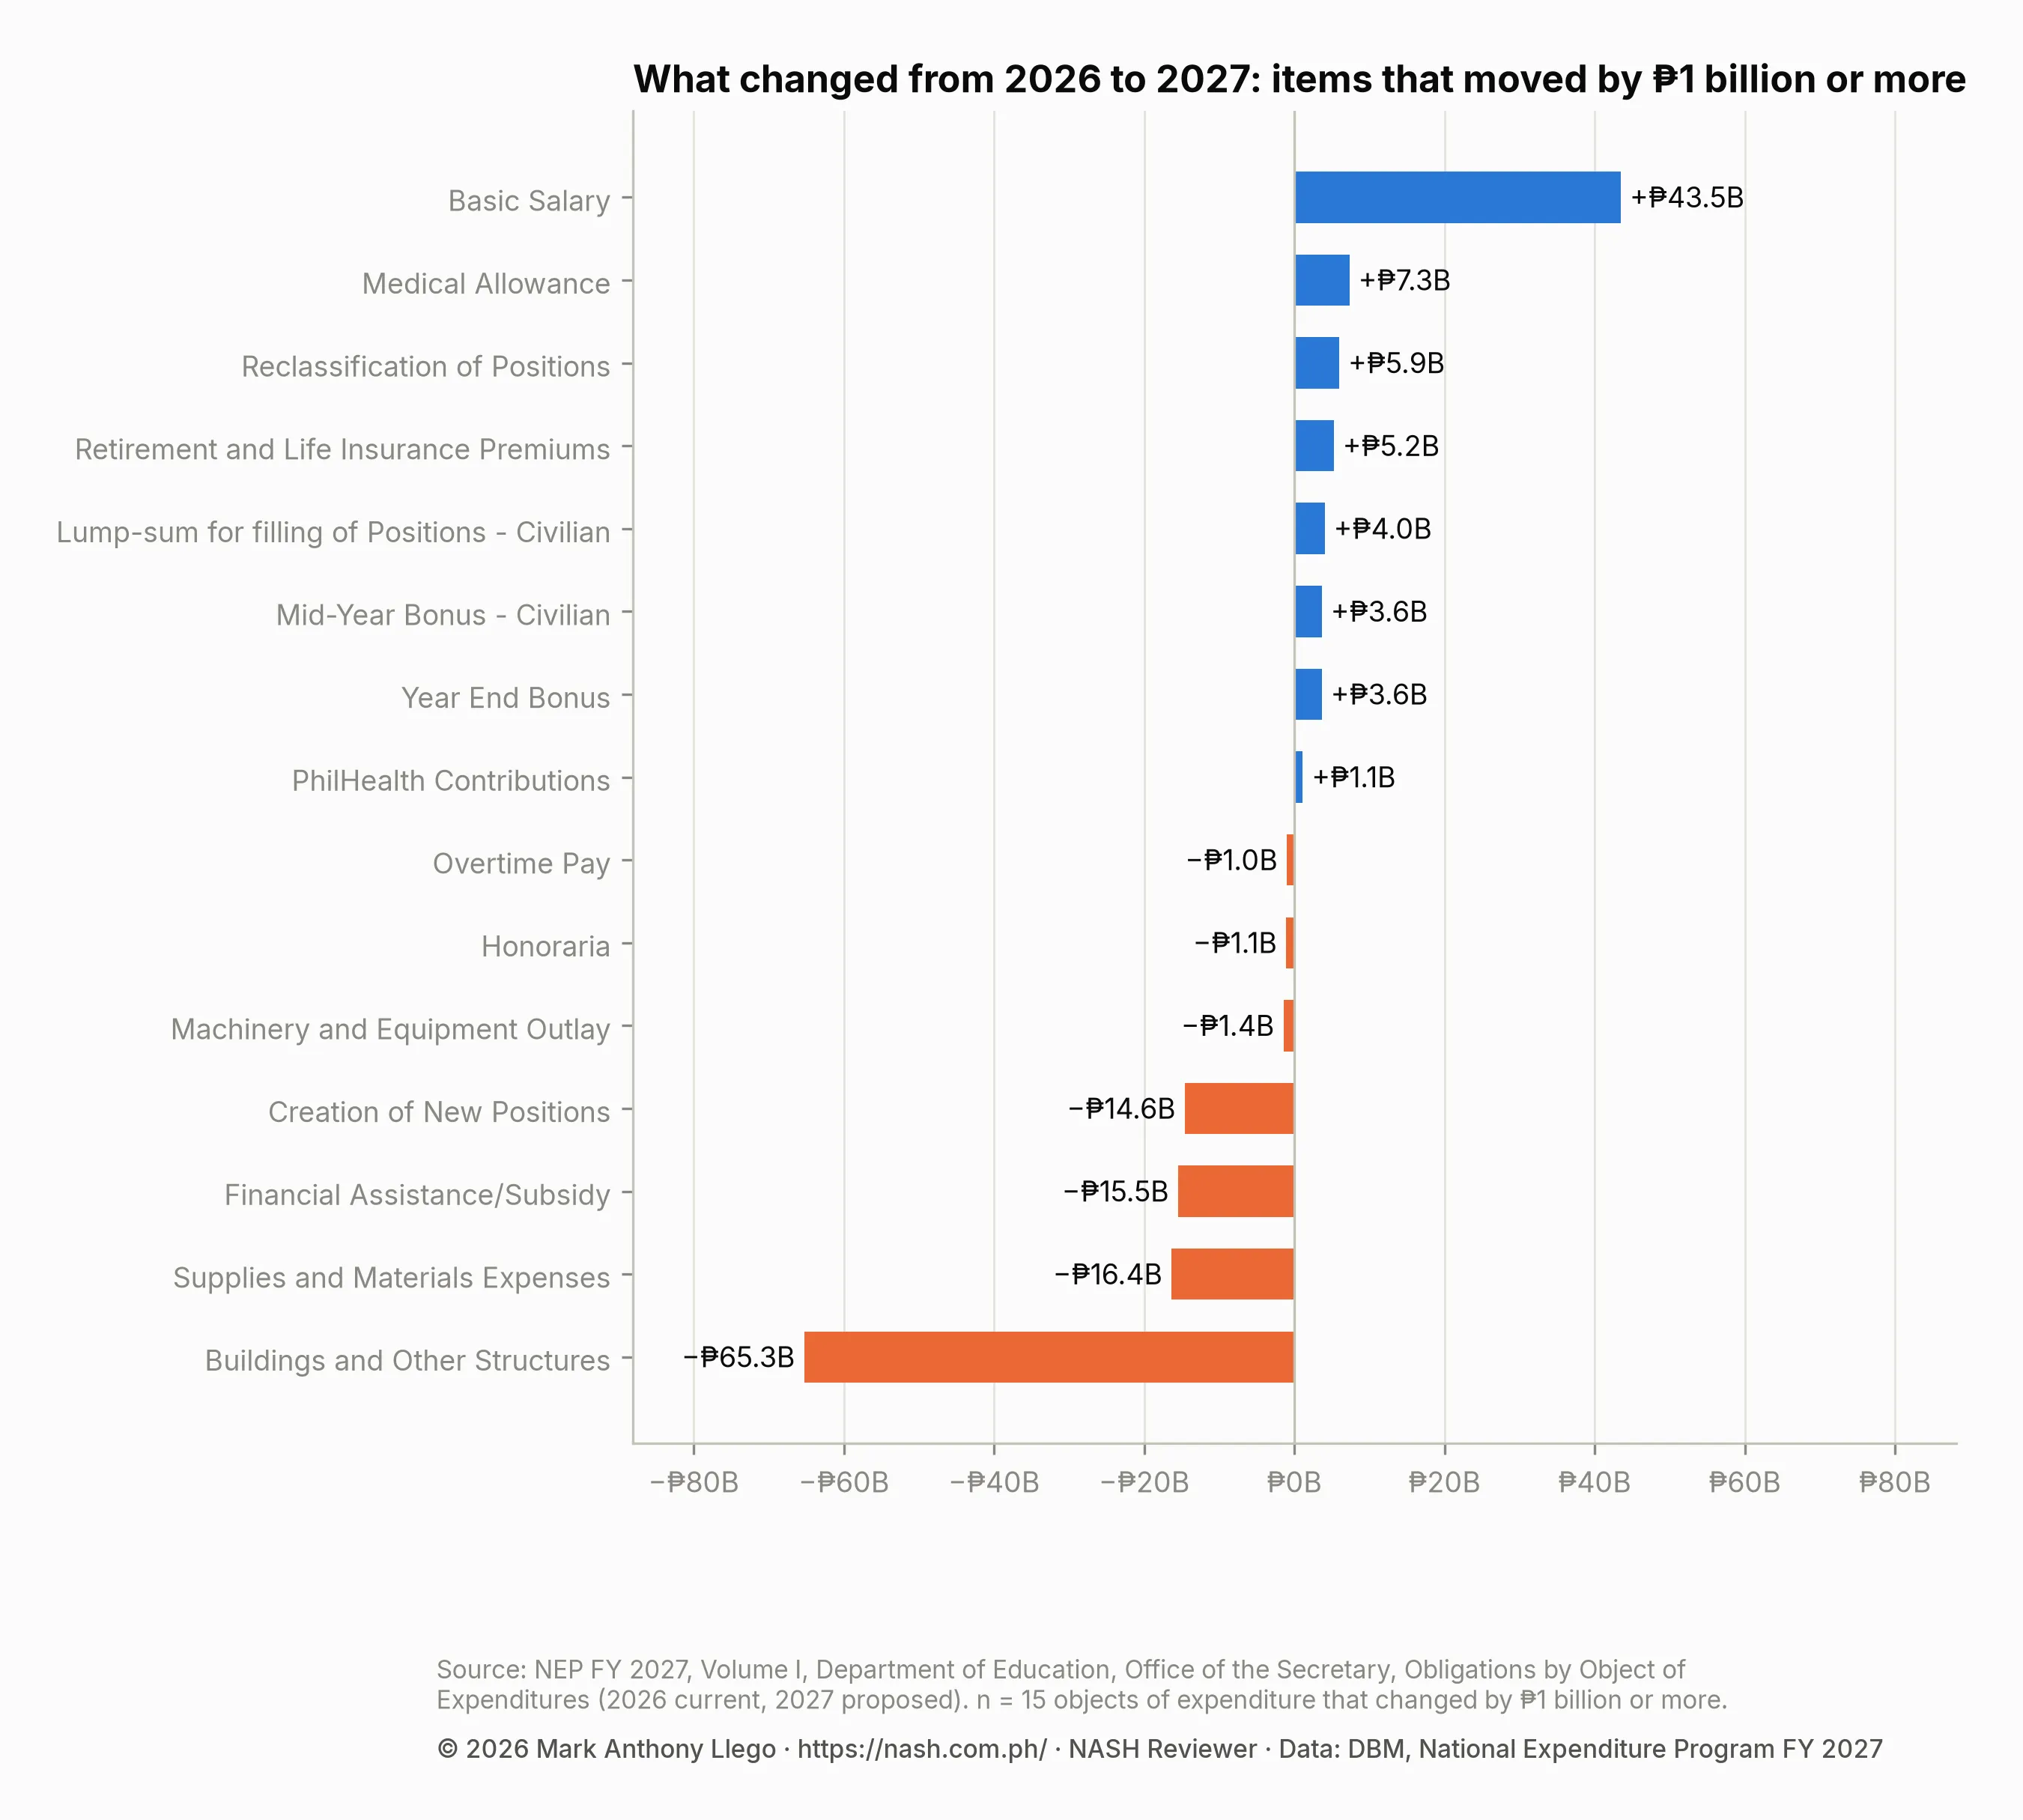
- Salaries rise. Basic salary goes from ₱449,520,117,000 to ₱492,971,596,000. A Medical Allowance line of ₱7,302,344,000, ₱7,000 for each of the 1,043,192 filled positions, appears in DepEd’s table for the first time; Executive Order No. 64, s. 2024 grants the allowance from 2025, and DepEd’s 2025 and 2026 columns carry no line for it.
- School buildings fall the most. Buildings and other structures go from ₱97,518,578,000 to ₱32,232,193,000. The 2027 Basic Education Facilities line is ₱30,551,016,000 (Special Provision 5), and a ₱3,000,000,000 Quick Response Fund is kept for school buildings damaged by disasters (Special Provision 4). The NEP’s own targets follow: 700 new classrooms constructed in 2027 against 4,869 in 2026, and 5,887 under construction (p. 599).
- Money for new positions falls from ₱15,393,163,000 to ₱801,583,000. The 2026 figure paid for the positions created that year; the 2027 figure pays for counselors (see “Teachers, principals and other positions in 2027”).
- Supplies and subsidies fall. Supplies and materials go from ₱82,499,433,000 to ₱66,147,772,000, and financial assistance and subsidies from ₱79,125,199,000 to ₱63,643,570,000. The textbooks and learning materials target falls from 135,614,186 in 2026 to 25,996,563 (p. 599).
Where the money sits: Central Office, regions, divisions and schools
Every peso in the NEP sits in a line of one office, and the money reaches schools through that office. Of the ₱914.24 billion in new appropriations:
| Office whose lines carry it | New appropriations, 2027 | Share |
|---|---|---|
| The 221 schools division offices | ₱491,354,870,000 | 53.7% |
| The 11,001 schools with lines of their own | ₱221,351,947,000 | 24.2% |
| The Central Office | ₱164,590,038,000 | 18.0% |
| The 17 regional offices and Baguio Teachers Camp | ₱36,947,895,000 | 4.0% |
Table: DBM, NEP FY 2027 data, Department of Education, Office of the Secretary, by operating unit.
Three facts about where the lines sit matter for reading any region’s or school’s figure:
- The Central Office holds every peso of capital outlays. All ₱32,338,915,000 of 2027 capital outlays is in its lines, so no region, division or school shows any money for buildings in the NEP. Its largest lines are Government Assistance and Subsidies for the Educational Service Contracting, Senior High School Voucher and Joint Delivery Voucher programs (₱38.12 billion), the pay for teaching positions to be filled (₱31.22 billion), school buildings (₱30.55 billion), the PLUS-D World Bank project (₱10.81 billion) and the teaching allowance (₱10.36 billion).
- Elementary schools have no lines of their own. Every elementary teacher’s pay and every elementary school’s MOOE sit in the division office’s elementary line; the Central Office holds another ₱500,655,000 of elementary MOOE, assigned to no division.
- Most high schools have their own lines in DBM’s data, but the printed NEP names only some. DBM’s data gives 11,001 schools offering junior or senior high a line of their own. The printed book names 2,696 of them, the implementing units that manage their own funds, and prints the money of the other 8,305 inside its division’s “Division Office - Proper” line. The 2,696 are all 2,679 implementing units of DepEd’s FY 2026 School MOOE list and 17 schools that were not implementing units there. How a school becomes an implementing unit is in Implementing Unit or Non-IU: How a School Gets Its MOOE.
Per learner, by region
The regions’ lines come to ₱749,654,712,000. Set against the 21,298,625 learners enrolled in SY 2025-2026 in public schools DepEd manages outside BARMM, that is ₱35,197 per learner. These figures leave out the Central Office’s ₱164.59 billion, which no region holds yet. Much of it, the pay for new teachers (₱31.22 billion) and school buildings (₱30.55 billion), will reach regions later and not evenly, and ₱38.12 billion goes to the voucher and service-contracting programs, so the comparison covers only the money already assigned to each region.
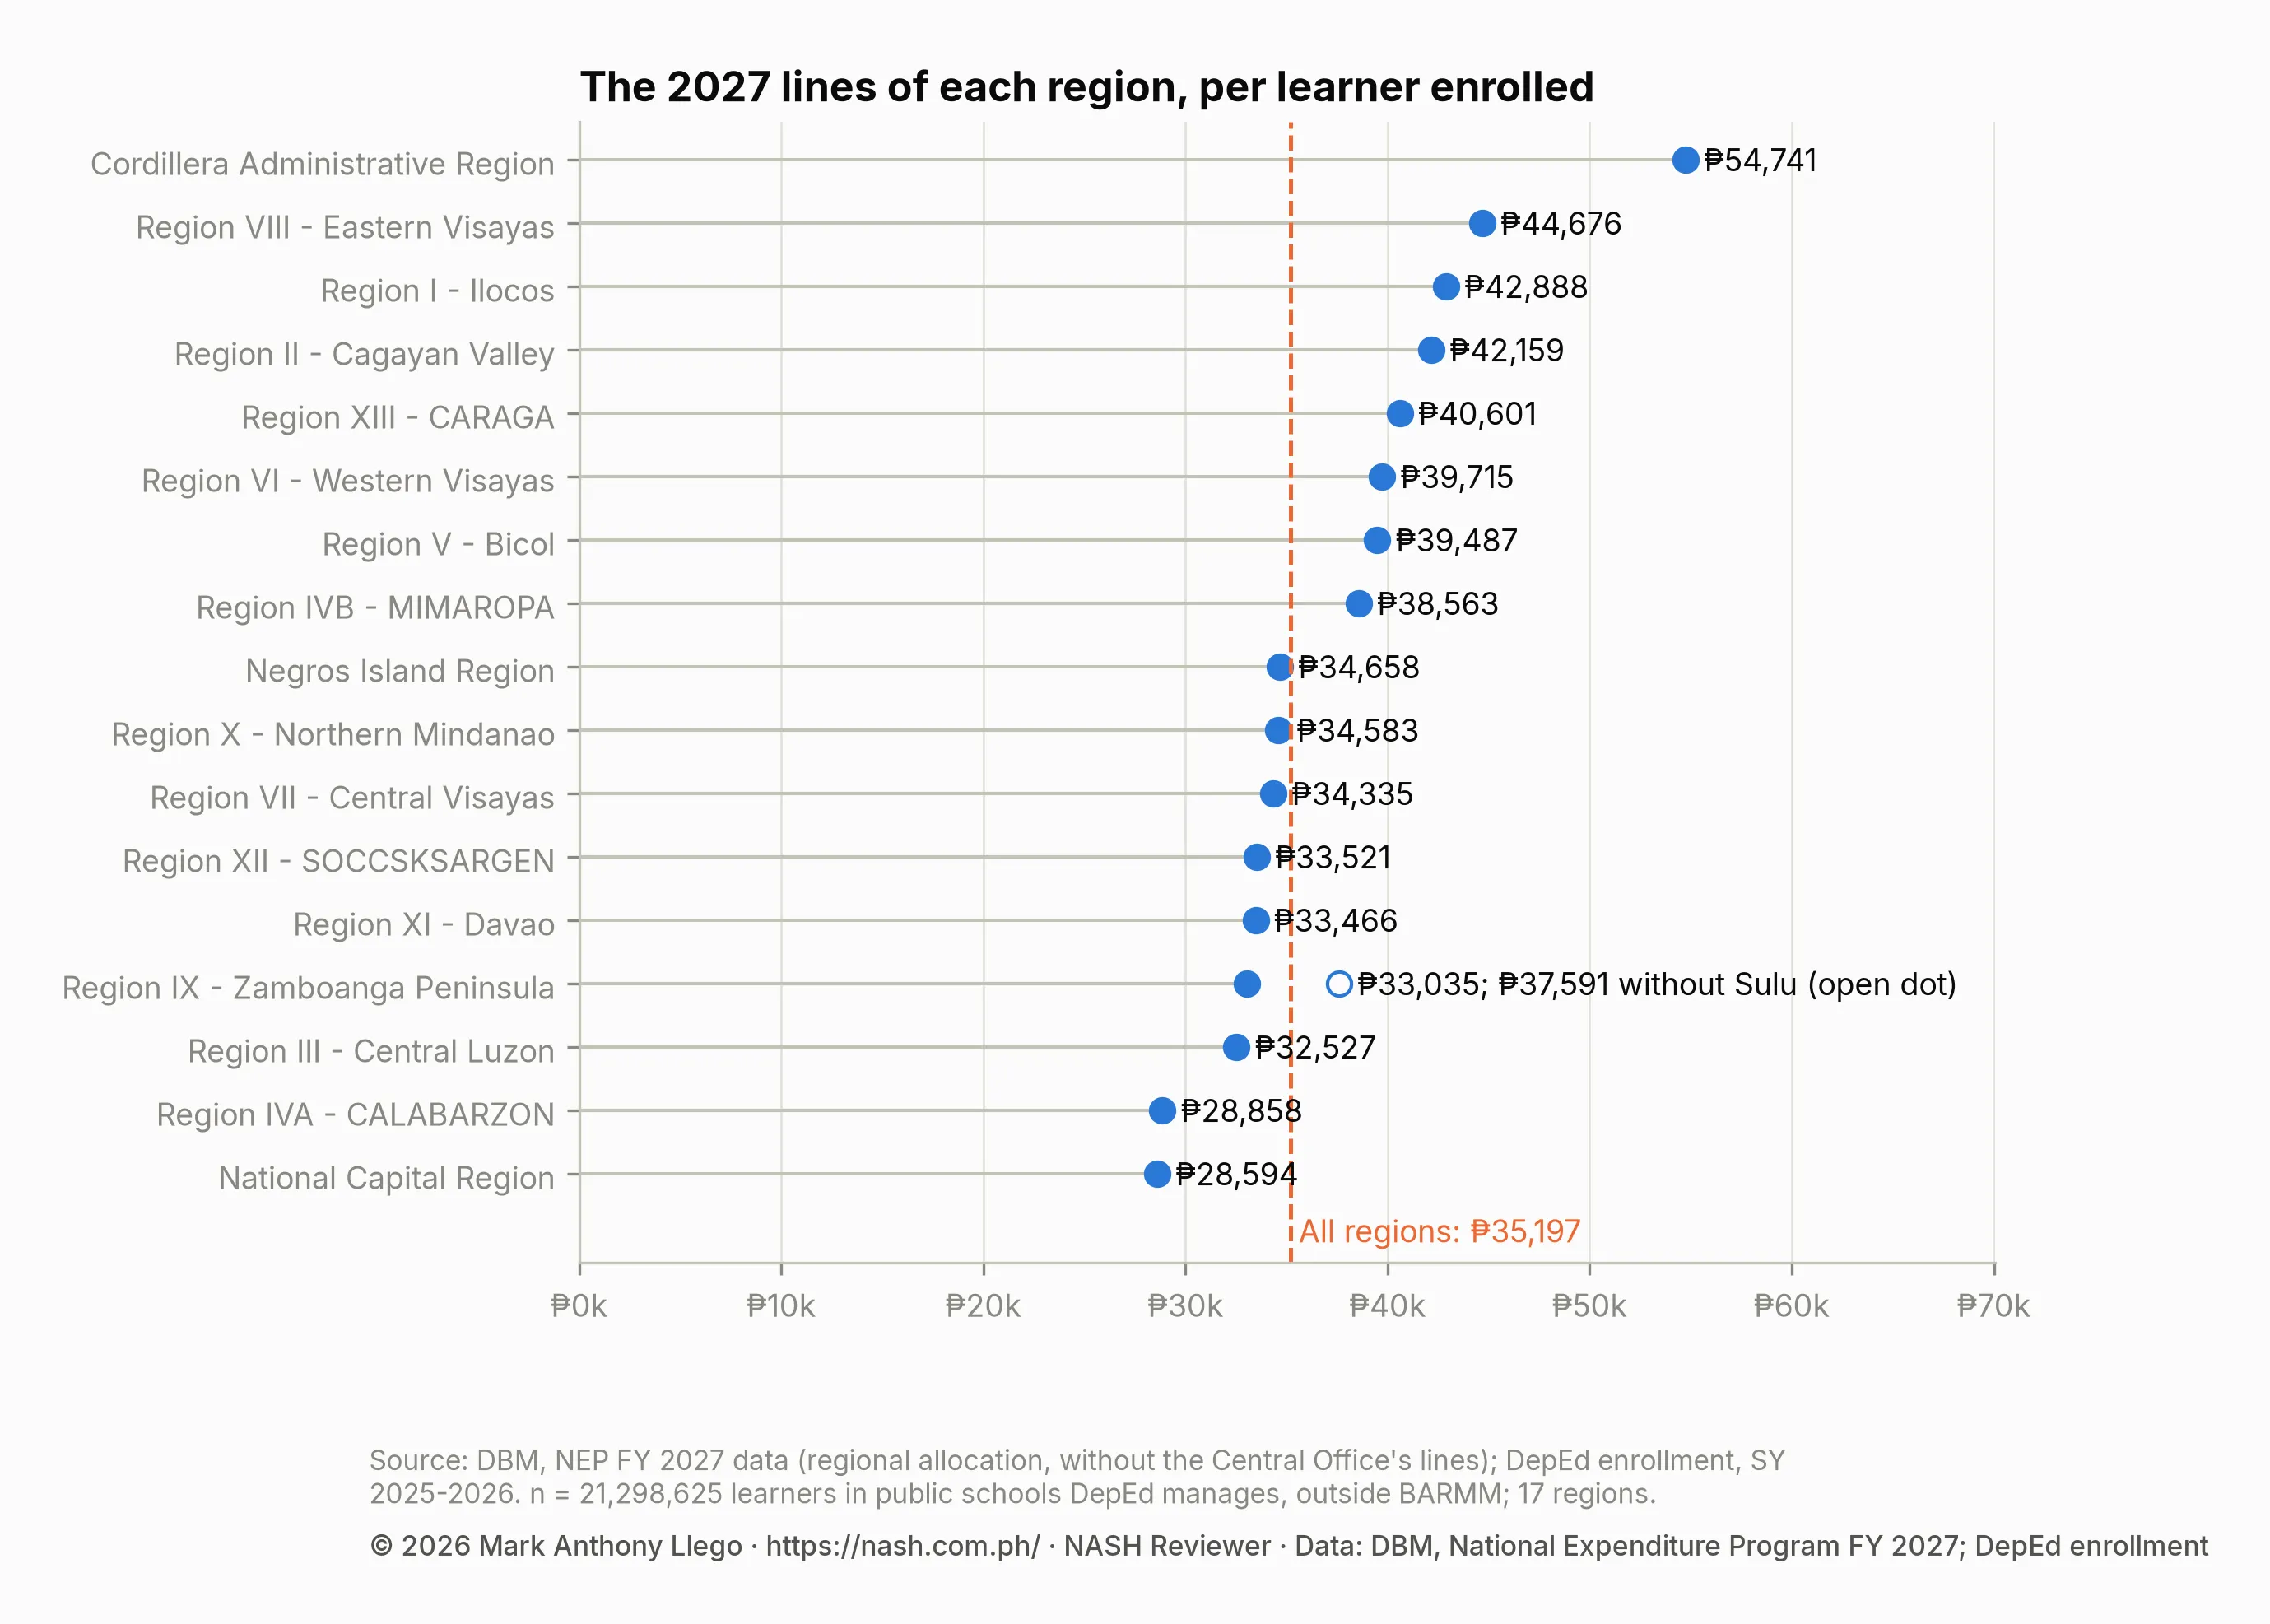
| Region | 2027 lines | Learners, SY 2025-2026 | Per learner | Against all regions |
|---|---|---|---|---|
| Cordillera Administrative Region | ₱18,415,972,000 | 336,419 | ₱54,741 | 156% |
| Region VIII - Eastern Visayas | ₱48,087,662,000 | 1,076,354 | ₱44,676 | 127% |
| Region I - Ilocos | ₱44,079,317,000 | 1,027,777 | ₱42,888 | 122% |
| Region II - Cagayan Valley | ₱32,011,978,000 | 759,314 | ₱42,159 | 120% |
| Region XIII - Caraga | ₱27,242,987,000 | 670,999 | ₱40,601 | 115% |
| Region VI - Western Visayas | ₱38,531,926,000 | 970,199 | ₱39,715 | 113% |
| Region V - Bicol | ₱58,829,938,000 | 1,489,850 | ₱39,487 | 112% |
| Region IV-B - MIMAROPA | ₱30,310,888,000 | 786,010 | ₱38,563 | 110% |
| Negros Island Region | ₱37,253,488,000 | 1,074,891 | ₱34,658 | 98% |
| Region X - Northern Mindanao | ₱38,642,003,000 | 1,117,374 | ₱34,583 | 98% |
| Region VII - Central Visayas | ₱47,386,869,000 | 1,380,130 | ₱34,335 | 98% |
| Region XII - SOCCSKSARGEN | ₱34,108,324,000 | 1,017,516 | ₱33,521 | 95% |
| Region XI - Davao | ₱38,837,468,000 | 1,160,512 | ₱33,466 | 95% |
| Region IX - Zamboanga Peninsula | ₱35,133,401,000 | 1,063,522 | ₱33,035 | 94% |
| Region III - Central Luzon | ₱76,994,161,000 | 2,367,099 | ₱32,527 | 92% |
| Region IV-A - CALABARZON | ₱87,514,090,000 | 3,032,606 | ₱28,858 | 82% |
| National Capital Region | ₱56,274,240,000 | 1,968,053 | ₱28,594 | 81% |
Table: DBM, NEP FY 2027 data, regional allocation; DepEd enrollment, SY 2025-2026. “Against all regions” divides by ₱35,197.
Region IX includes the Division of Sulu: the Supreme Court excluded Sulu from BARMM in 2024, and Executive Order No. 91, s. 2025 declared it part of Region IX. Sulu’s 2027 lines carry ₱485,878,000 of MOOE and no personnel services at all. For 2026, “BARMM committed to shoulder the salaries of basic education personnel in Sulu”, with DepEd providing the schools’ MOOE (DBM, February 9, 2026); DepEd’s chapter of the NEP carries no salaries for Sulu in 2027. Education in the Bangsamoro follows Sulu’s transition. Without Sulu, Region IX’s lines come to ₱37,591 per learner.
Find your region, division or school
Choose a region or a division to see its 2027 lines, its learners, and where it ranks. Type part of a school’s name to see a school’s junior and senior high lines. The table under the finder lists every division by region, and works without the finder.
Finder
Find your region, schools division or school
Each figure is a line of the 2027 proposal. Per-learner amounts set a division's elementary, junior high and senior high lines against the learners enrolled in SY 2025-2026; a rank of 1 is the most per learner of 218.
Elementary schools have no lines of their own: their money is in the division's elementary line.
Every region and division
The Central Office holds ₱164,590,038,000, assigned to no region; the regions' ₱749,654,712,000 is shown here. Amounts are the 2027 new appropriations, without the retirement and life insurance premiums.
National Capital Region (NCR): ₱56.27 billion, 1,968,053 learners, ₱28,594 per learner
| Division | All lines | Elementary | Junior high | Senior high | Learners | Per learner |
|---|---|---|---|---|---|---|
| Caloocan | ₱6,578,761,000 | ₱3,419,983,000 | ₱2,670,254,000 | ₱336,069,000 | 257,595 | ₱24,947 |
| Las Piñas | ₱2,622,244,000 | ₱1,180,841,000 | ₱1,174,858,000 | ₱182,625,000 | 86,663 | ₱29,290 |
| Makati | ₱1,084,819,000 | ₱551,709,000 | ₱359,410,000 | ₱100,227,000 | 30,667 | ₱32,978 |
| Malabon City | ₱1,953,477,000 | ₱1,029,339,000 | ₱721,474,000 | ₱118,821,000 | 67,235 | ₱27,807 |
| Mandaluyong | ₱1,554,505,000 | ₱647,842,000 | ₱652,621,000 | ₱171,707,000 | 50,855 | ₱28,948 |
| Manila | ₱7,784,871,000 | ₱4,284,383,000 | ₱2,854,732,000 | ₱424,109,000 | 241,414 | ₱31,329 |
| Marikina | ₱2,083,060,000 | ₱861,371,000 | ₱929,327,000 | ₱208,803,000 | 74,037 | ₱27,007 |
| Muntinlupa | ₱2,025,655,000 | ₱997,415,000 | ₱694,405,000 | ₱254,133,000 | 82,591 | ₱23,561 |
| Navotas City | ₱1,351,115,000 | ₱697,057,000 | ₱438,139,000 | ₱134,697,000 | 44,327 | ₱28,648 |
| Parañaque | ₱2,596,464,000 | ₱1,217,244,000 | ₱985,223,000 | ₱310,867,000 | 98,767 | ₱25,447 |
| Pasay City | ₱1,822,877,000 | ₱793,221,000 | ₱675,303,000 | ₱267,204,000 | 63,578 | ₱27,301 |
| Pasig City | ₱3,434,604,000 | ₱1,534,887,000 | ₱1,323,172,000 | ₱485,956,000 | 138,234 | ₱24,191 |
| Quezon City | ₱10,668,059,000 | ₱5,234,296,000 | ₱4,372,416,000 | ₱865,803,000 | 404,037 | ₱25,920 |
| San Juan City | ₱404,043,000 | ₱212,708,000 | ₱110,383,000 | ₱32,724,000 | 11,492 | ₱30,962 |
| Taguig and Pateros | ₱4,784,063,000 | ₱2,408,284,000 | ₱1,885,918,000 | ₱391,818,000 | 189,558 | ₱24,721 |
| Valenzuela | ₱3,478,543,000 | ₱1,629,970,000 | ₱1,425,820,000 | ₱332,468,000 | 127,003 | ₱26,679 |
Region I - Ilocos: ₱44.08 billion, 1,027,777 learners, ₱42,888 per learner
| Division | All lines | Elementary | Junior high | Senior high | Learners | Per learner |
|---|---|---|---|---|---|---|
| Alaminos City | ₱829,620,000 | ₱410,934,000 | ₱230,702,000 | ₱115,491,000 | 21,453 | ₱35,292 |
| Batac City | ₱447,102,000 | ₱232,889,000 | ₱103,465,000 | ₱46,679,000 | 8,874 | ₱43,164 |
| Candon City | ₱557,530,000 | ₱258,104,000 | ₱157,129,000 | ₱73,865,000 | 11,520 | ₱42,456 |
| Dagupan City | ₱1,212,608,000 | ₱583,506,000 | ₱387,798,000 | ₱147,005,000 | 33,373 | ₱33,509 |
| Ilocos Norte | ₱3,708,477,000 | ₱2,057,977,000 | ₱991,212,000 | ₱446,517,000 | 76,943 | ₱45,432 |
| Ilocos Sur | ₱4,654,389,000 | ₱2,831,333,000 | ₱1,106,587,000 | ₱457,162,000 | 99,329 | ₱44,248 |
| La Union | ₱5,341,674,000 | ₱2,811,910,000 | ₱1,624,273,000 | ₱668,624,000 | 126,945 | ₱40,213 |
| Laoag City | ₱845,553,000 | ₱362,828,000 | ₱291,457,000 | ₱118,554,000 | 20,499 | ₱37,701 |
| Pangasinan I | ₱11,206,518,000 | ₱5,928,768,000 | ₱3,566,867,000 | ₱1,291,956,000 | 290,901 | ₱37,083 |
| Pangasinan II | ₱8,903,078,000 | ₱4,571,376,000 | ₱2,837,819,000 | ₱1,108,224,000 | 231,029 | ₱36,867 |
| San Carlos City | ₱1,655,478,000 | ₱847,694,000 | ₱511,054,000 | ₱187,960,000 | 43,142 | ₱35,852 |
| San Fernando City | ₱776,912,000 | ₱358,052,000 | ₱248,540,000 | ₱106,195,000 | 19,743 | ₱36,103 |
| Urdaneta City | ₱1,237,028,000 | ₱556,988,000 | ₱421,060,000 | ₱151,539,000 | 30,604 | ₱36,910 |
| Vigan City | ₱638,742,000 | ₱234,506,000 | ₱234,182,000 | ₱107,635,000 | 13,422 | ₱42,939 |
Cordillera Administrative Region (CAR): ₱18.42 billion, 336,419 learners, ₱54,741 per learner
| Division | All lines | Elementary | Junior high | Senior high | Learners | Per learner |
|---|---|---|---|---|---|---|
| Abra | ₱2,638,640,000 | ₱1,723,885,000 | ₱578,948,000 | ₱220,397,000 | 47,230 | ₱53,424 |
| Apayao | ₱1,527,837,000 | ₱930,325,000 | ₱366,890,000 | ₱129,525,000 | 26,736 | ₱53,364 |
| Baguio City | ₱2,029,722,000 | ₱994,737,000 | ₱753,749,000 | ₱180,211,000 | 57,387 | ₱33,609 |
| Benguet | ₱4,056,393,000 | ₱2,374,812,000 | ₱1,066,665,000 | ₱391,916,000 | 82,140 | ₱46,669 |
| Ifugao | ₱2,236,052,000 | ₱1,473,013,000 | ₱477,750,000 | ₱167,718,000 | 40,036 | ₱52,914 |
| Kalinga | ₱1,521,285,000 | ₱911,895,000 | ₱379,878,000 | ₱131,672,000 | 23,076 | ₱61,685 |
| Mt. Province | ₱2,217,391,000 | ₱1,254,070,000 | ₱681,825,000 | ₱163,116,000 | 32,621 | ₱64,345 |
| Tabuk City | ₱1,291,717,000 | ₱696,497,000 | ₱370,019,000 | ₱133,930,000 | 27,193 | ₱44,145 |
Region II - Cagayan Valley: ₱32.01 billion, 759,314 learners, ₱42,159 per learner
| Division | All lines | Elementary | Junior high | Senior high | Learners | Per learner |
|---|---|---|---|---|---|---|
| Batanes | ₱430,491,000 | ₱189,198,000 | ₱138,798,000 | ₱38,300,000 | 3,902 | ₱93,874 |
| Cagayan | ₱9,161,589,000 | ₱5,325,133,000 | ₱2,461,658,000 | ₱999,412,000 | 225,245 | ₱39,007 |
| Cauayan City | ₱1,182,825,000 | ₱610,082,000 | ₱321,119,000 | ₱170,420,000 | 32,748 | ₱33,639 |
| Ilagan City | ₱1,326,928,000 | ₱704,463,000 | ₱383,615,000 | ₱157,221,000 | 32,793 | ₱37,975 |
| Isabela | ₱9,929,983,000 | ₱5,598,127,000 | ₱2,868,039,000 | ₱1,039,283,000 | 252,186 | ₱37,692 |
| Nueva Vizcaya | ₱4,056,156,000 | ₱2,354,420,000 | ₱1,035,315,000 | ₱467,558,000 | 103,132 | ₱37,402 |
| Quirino | ₱2,109,160,000 | ₱1,133,192,000 | ₱586,874,000 | ₱240,501,000 | 45,269 | ₱43,309 |
| Santiago City | ₱985,038,000 | ₱528,218,000 | ₱279,338,000 | ₱109,499,000 | 30,584 | ₱29,985 |
| Tuguegarao City | ₱1,145,331,000 | ₱520,290,000 | ₱387,134,000 | ₱153,123,000 | 33,455 | ₱31,701 |
Region III - Central Luzon: ₱76.99 billion, 2,367,099 learners, ₱32,527 per learner
| Division | All lines | Elementary | Junior high | Senior high | Learners | Per learner |
|---|---|---|---|---|---|---|
| Angeles City | ₱2,348,655,000 | ₱1,222,849,000 | ₱787,667,000 | ₱250,085,000 | 86,173 | ₱26,233 |
| Aurora | ₱2,223,844,000 | ₱1,225,550,000 | ₱713,611,000 | ₱179,427,000 | 53,532 | ₱39,576 |
| Balanga City | ₱808,290,000 | ₱323,201,000 | ₱272,711,000 | ₱154,363,000 | 25,313 | ₱29,640 |
| Baliwag City | ₱776,321,000 | ₱441,249,000 | ₱228,570,000 | ₱28,268,000 | 25,594 | ₱27,275 |
| Bataan | ₱4,530,542,000 | ₱2,409,558,000 | ₱1,471,084,000 | ₱524,958,000 | 156,928 | ₱28,074 |
| Bulacan | ₱11,808,749,000 | ₱6,665,555,000 | ₱3,762,725,000 | ₱1,174,232,000 | 441,442 | ₱26,283 |
| Cabanatuan City | ₱1,600,250,000 | ₱974,258,000 | ₱405,407,000 | ₱136,303,000 | 55,564 | ₱27,283 |
| Gapan City | ₱967,696,000 | ₱467,988,000 | ₱309,876,000 | ₱131,182,000 | 27,857 | ₱32,633 |
| Mabalacat City | ₱1,473,166,000 | ₱761,241,000 | ₱558,614,000 | ₱94,886,000 | 49,216 | ₱28,746 |
| Malolos City | ₱1,373,181,000 | ₱650,493,000 | ₱513,098,000 | ₱124,028,000 | 41,207 | ₱31,248 |
| Meycauayan City | ₱918,994,000 | ₱549,115,000 | ₱241,698,000 | ₱72,708,000 | 34,206 | ₱25,245 |
| Muñoz Science City | ₱758,254,000 | ₱374,651,000 | ₱228,047,000 | ₱102,768,000 | 18,255 | ₱38,645 |
| Nueva Ecija | ₱11,106,430,000 | ₱6,194,045,000 | ₱3,323,571,000 | ₱1,336,107,000 | 315,456 | ₱34,406 |
| Olongapo City | ₱1,503,953,000 | ₱722,047,000 | ₱575,980,000 | ₱123,831,000 | 46,300 | ₱30,710 |
| Pampanga | ₱10,293,539,000 | ₱5,641,617,000 | ₱3,271,143,000 | ₱1,120,059,000 | 326,913 | ₱30,690 |
| San Fernando City | ₱1,912,457,000 | ₱881,579,000 | ₱692,000,000 | ₱254,995,000 | 63,450 | ₱28,819 |
| San Jose City | ₱1,014,863,000 | ₱555,885,000 | ₱271,743,000 | ₱127,719,000 | 31,223 | ₱30,598 |
| San Jose del Monte City | ₱3,048,878,000 | ₱1,618,678,000 | ₱1,067,838,000 | ₱275,413,000 | 124,806 | ₱23,732 |
| Tarlac | ₱7,708,602,000 | ₱4,163,792,000 | ₱2,346,168,000 | ₱971,585,000 | 239,607 | ₱31,224 |
| Tarlac City | ₱1,922,926,000 | ₱1,238,866,000 | ₱458,952,000 | ₱133,237,000 | 64,770 | ₱28,270 |
| Zambales | ₱4,573,328,000 | ₱2,540,541,000 | ₱1,459,795,000 | ₱450,817,000 | 139,287 | ₱31,957 |
Region IVA - CALABARZON: ₱87.51 billion, 3,032,606 learners, ₱28,858 per learner
| Division | All lines | Elementary | Junior high | Senior high | Learners | Per learner |
|---|---|---|---|---|---|---|
| Antipolo City | ₱4,001,085,000 | ₱2,059,245,000 | ₱1,433,968,000 | ₱387,891,000 | 171,061 | ₱22,688 |
| Bacoor City | ₱2,010,948,000 | ₱1,117,109,000 | ₱681,965,000 | ₱135,388,000 | 79,364 | ₱24,375 |
| Batangas | ₱10,852,520,000 | ₱6,040,824,000 | ₱3,115,508,000 | ₱1,361,226,000 | 325,185 | ₱31,149 |
| Batangas City | ₱2,012,742,000 | ₱1,056,095,000 | ₱634,325,000 | ₱210,106,000 | 59,184 | ₱32,112 |
| Biñan City | ₱1,582,676,000 | ₱792,305,000 | ₱512,635,000 | ₱183,926,000 | 61,312 | ₱24,283 |
| Cabuyao City | ₱1,409,128,000 | ₱698,751,000 | ₱532,131,000 | ₱82,860,000 | 57,082 | ₱23,015 |
| Calaca City | ₱250,751,000 | ₱30,063,000 | ₱166,570,000 | ₱7,066,000 | 19,012 | ₱31,149 |
| Calamba City | ₱2,490,413,000 | ₱1,321,351,000 | ₱784,085,000 | ₱272,510,000 | 101,976 | ₱23,319 |
| Carmona City | ₱218,392,000 | ₱17,353,000 | ₱146,340,000 | ₱6,828,000 | 18,572 | ₱23,322 |
| Cavite | ₱9,432,253,000 | ₱5,156,116,000 | ₱2,988,698,000 | ₱1,015,854,000 | 381,522 | ₱23,322 |
| Cavite City | ₱676,951,000 | ₱331,451,000 | ₱205,610,000 | ₱75,915,000 | 18,391 | ₱33,330 |
| Dasmariñas City | ₱3,043,035,000 | ₱1,470,698,000 | ₱1,161,628,000 | ₱308,282,000 | 114,599 | ₱25,660 |
| General Trias City | ₱1,731,822,000 | ₱962,525,000 | ₱511,819,000 | ₱164,677,000 | 81,381 | ₱20,140 |
| Imus City | ₱1,828,788,000 | ₱936,705,000 | ₱683,989,000 | ₱134,061,000 | 74,020 | ₱23,706 |
| Laguna | ₱6,304,715,000 | ₱3,483,449,000 | ₱1,884,839,000 | ₱683,079,000 | 208,549 | ₱29,017 |
| Lipa City | ₱2,068,134,000 | ₱1,062,148,000 | ₱657,520,000 | ₱231,716,000 | 75,932 | ₱25,699 |
| Lucena City | ₱1,390,308,000 | ₱883,427,000 | ₱312,363,000 | ₱89,661,000 | 51,708 | ₱24,860 |
| Quezon | ₱13,545,930,000 | ₱7,462,091,000 | ₱3,955,547,000 | ₱1,630,667,000 | 419,163 | ₱31,129 |
| Rizal | ₱10,858,951,000 | ₱5,926,086,000 | ₱3,526,836,000 | ₱1,130,568,000 | 447,963 | ₱23,626 |
| San Pablo City | ₱1,734,697,000 | ₱941,446,000 | ₱527,065,000 | ₱154,667,000 | 56,327 | ₱28,817 |
| San Pedro City | ₱1,334,529,000 | ₱658,270,000 | ₱503,853,000 | ₱80,351,000 | 50,410 | ₱24,647 |
| Sta. Rosa City | ₱1,511,974,000 | ₱793,678,000 | ₱505,665,000 | ₱116,250,000 | 62,926 | ₱22,496 |
| Sto. Tomas City | ₱888,626,000 | ₱504,618,000 | ₱248,409,000 | ₱48,792,000 | 35,566 | ₱22,545 |
| Tanauan City | ₱1,172,279,000 | ₱604,026,000 | ₱403,501,000 | ₱69,512,000 | 39,422 | ₱27,321 |
| Tayabas City | ₱715,907,000 | ₱355,280,000 | ₱211,101,000 | ₱78,422,000 | 21,979 | ₱29,337 |
Region IVB - MIMAROPA: ₱30.31 billion, 786,010 learners, ₱38,563 per learner
| Division | All lines | Elementary | Junior high | Senior high | Learners | Per learner |
|---|---|---|---|---|---|---|
| Calapan City | ₱1,213,417,000 | ₱591,807,000 | ₱374,758,000 | ₱156,687,000 | 30,603 | ₱36,704 |
| Marinduque | ₱2,425,163,000 | ₱1,403,720,000 | ₱670,739,000 | ₱245,195,000 | 54,280 | ₱42,735 |
| Occidental Mindoro | ₱4,616,891,000 | ₱2,648,664,000 | ₱1,334,684,000 | ₱461,676,000 | 132,884 | ₱33,450 |
| Oriental Mindoro | ₱6,473,315,000 | ₱3,811,748,000 | ₱1,875,579,000 | ₱599,923,000 | 172,004 | ₱36,553 |
| Palawan | ₱8,576,401,000 | ₱4,793,155,000 | ₱2,431,678,000 | ₱967,099,000 | 252,886 | ₱32,394 |
| Puerto Princesa City | ₱2,107,130,000 | ₱996,071,000 | ₱683,487,000 | ₱332,124,000 | 69,314 | ₱29,023 |
| Romblon | ₱3,347,968,000 | ₱1,812,831,000 | ₱1,019,430,000 | ₱381,067,000 | 74,039 | ₱43,400 |
Region V - Bicol: ₱58.83 billion, 1,489,850 learners, ₱39,487 per learner
| Division | All lines | Elementary | Junior high | Senior high | Learners | Per learner |
|---|---|---|---|---|---|---|
| Albay | ₱7,828,181,000 | ₱4,329,774,000 | ₱2,293,367,000 | ₱963,954,000 | 210,607 | ₱36,025 |
| Camarines Norte | ₱5,019,738,000 | ₱2,799,222,000 | ₱1,502,723,000 | ₱561,845,000 | 154,346 | ₱31,512 |
| Camarines Sur | ₱15,224,674,000 | ₱8,349,632,000 | ₱4,477,239,000 | ₱1,836,022,000 | 422,961 | ₱34,667 |
| Catanduanes | ₱3,168,869,000 | ₱1,818,570,000 | ₱892,944,000 | ₱339,126,000 | 70,314 | ₱43,386 |
| Iriga City | ₱969,182,000 | ₱492,042,000 | ₱306,450,000 | ₱110,144,000 | 23,976 | ₱37,898 |
| Legazpi City | ₱1,442,553,000 | ₱755,580,000 | ₱441,633,000 | ₱156,711,000 | 41,899 | ₱32,314 |
| Ligao City | ₱1,246,235,000 | ₱597,335,000 | ₱385,997,000 | ₱172,962,000 | 32,529 | ₱35,547 |
| Masbate | ₱8,902,327,000 | ₱5,333,265,000 | ₱2,303,563,000 | ₱909,582,000 | 208,660 | ₱40,959 |
| Masbate City | ₱1,017,688,000 | ₱508,846,000 | ₱282,575,000 | ₱131,751,000 | 27,675 | ₱33,358 |
| Naga City | ₱1,482,689,000 | ₱689,472,000 | ₱503,025,000 | ₱203,625,000 | 47,176 | ₱29,594 |
| Sorsogon | ₱6,476,967,000 | ₱3,506,169,000 | ₱1,932,432,000 | ₱795,676,000 | 167,033 | ₱37,324 |
| Sorsogon City | ₱1,590,219,000 | ₱790,317,000 | ₱483,457,000 | ₱210,271,000 | 44,105 | ₱33,648 |
| Tabaco City | ₱1,402,825,000 | ₱604,808,000 | ₱500,431,000 | ₱208,977,000 | 38,569 | ₱34,074 |
Region VI - Western Visayas: ₱38.53 billion, 970,199 learners, ₱39,715 per learner
| Division | All lines | Elementary | Junior high | Senior high | Learners | Per learner |
|---|---|---|---|---|---|---|
| Aklan | ₱4,940,432,000 | ₱2,639,631,000 | ₱1,516,093,000 | ₱610,513,000 | 120,694 | ₱39,490 |
| Antique | ₱5,297,209,000 | ₱3,138,973,000 | ₱1,391,077,000 | ₱573,426,000 | 135,084 | ₱37,780 |
| Capiz | ₱5,723,482,000 | ₱3,169,803,000 | ₱1,656,970,000 | ₱727,845,000 | 130,474 | ₱42,573 |
| Guimaras | ₱1,598,838,000 | ₱837,596,000 | ₱456,740,000 | ₱194,106,000 | 40,763 | ₱36,515 |
| Iloilo | ₱15,352,291,000 | ₱8,061,215,000 | ₱4,704,971,000 | ₱2,120,675,000 | 417,683 | ₱35,642 |
| Iloilo City | ₱2,308,069,000 | ₱1,198,061,000 | ₱747,456,000 | ₱252,364,000 | 74,351 | ₱29,561 |
| Passi City | ₱799,277,000 | ₱377,828,000 | ₱243,645,000 | ₱109,045,000 | 20,521 | ₱35,599 |
| Roxas City | ₱1,109,456,000 | ₱593,441,000 | ₱307,322,000 | ₱109,748,000 | 30,629 | ₱32,992 |
Negros Island Region (NIR): ₱37.25 billion, 1,074,891 learners, ₱34,658 per learner
| Division | All lines | Elementary | Junior high | Senior high | Learners | Per learner |
|---|---|---|---|---|---|---|
| Bacolod City | ₱3,011,960,000 | ₱1,531,763,000 | ₱1,013,204,000 | ₱351,676,000 | 109,672 | ₱26,412 |
| Bago City | ₱1,113,352,000 | ₱551,129,000 | ₱355,357,000 | ₱110,519,000 | 35,648 | ₱28,529 |
| Bais City | ₱789,715,000 | ₱371,956,000 | ₱252,993,000 | ₱101,474,000 | 19,814 | ₱36,662 |
| Bayawan City | ₱1,384,452,000 | ₱713,362,000 | ₱375,381,000 | ₱194,814,000 | 44,023 | ₱29,157 |
| Cadiz City | ₱1,252,637,000 | ₱630,494,000 | ₱357,520,000 | ₱170,930,000 | 38,666 | ₱29,973 |
| Canlaon City | ₱470,387,000 | ₱248,165,000 | ₱116,687,000 | ₱54,915,000 | 14,304 | ₱29,346 |
| Dumaguete City | ₱724,580,000 | ₱364,020,000 | ₱200,910,000 | ₱101,925,000 | 24,435 | ₱27,291 |
| Escalante City | ₱821,862,000 | ₱376,322,000 | ₱270,116,000 | ₱108,224,000 | 24,330 | ₱31,018 |
| Guihulngan City | ₱1,083,906,000 | ₱542,792,000 | ₱328,508,000 | ₱144,507,000 | 34,258 | ₱29,652 |
| Himamaylan City | ₱919,400,000 | ₱498,938,000 | ₱224,958,000 | ₱109,597,000 | 27,168 | ₱30,679 |
| Kabankalan City | ₱1,507,212,000 | ₱796,933,000 | ₱437,815,000 | ₱181,159,000 | 48,378 | ₱29,268 |
| La Carlota City | ₱657,354,000 | ₱311,073,000 | ₱202,415,000 | ₱90,960,000 | 16,908 | ₱35,749 |
| Negros Occidental | ₱8,917,059,000 | ₱5,103,032,000 | ₱2,432,410,000 | ₱1,065,706,000 | 283,432 | ₱30,346 |
| Negros Oriental | ₱6,236,747,000 | ₱3,741,812,000 | ₱1,546,498,000 | ₱670,792,000 | 172,242 | ₱34,597 |
| Sagay City | ₱1,304,224,000 | ₱652,306,000 | ₱390,221,000 | ₱162,937,000 | 37,561 | ₱32,094 |
| San Carlos City | ₱1,086,062,000 | ₱627,656,000 | ₱256,240,000 | ₱110,592,000 | 29,527 | ₱33,681 |
| Silay City | ₱967,935,000 | ₱466,896,000 | ₱300,732,000 | ₱115,411,000 | 27,840 | ₱31,718 |
| Sipalay City | ₱757,155,000 | ₱343,199,000 | ₱231,267,000 | ₱102,657,000 | 19,273 | ₱35,133 |
| Siquijor | ₱895,732,000 | ₱470,222,000 | ₱250,144,000 | ₱95,543,000 | 20,175 | ₱40,442 |
| Tanjay City | ₱872,154,000 | ₱437,244,000 | ₱287,088,000 | ₱79,423,000 | 25,262 | ₱31,817 |
| Victorias City | ₱665,697,000 | ₱314,494,000 | ₱202,913,000 | ₱91,655,000 | 21,975 | ₱27,716 |
Region VII - Central Visayas: ₱47.39 billion, 1,380,130 learners, ₱34,335 per learner
| Division | All lines | Elementary | Junior high | Senior high | Learners | Per learner |
|---|---|---|---|---|---|---|
| Bogo City | ₱637,205,000 | ₱331,638,000 | ₱158,100,000 | ₱83,886,000 | 18,792 | ₱30,525 |
| Bohol | ₱11,278,520,000 | ₱6,618,678,000 | ₱3,083,364,000 | ₱1,281,741,000 | 267,648 | ₱41,038 |
| Carcar City | ₱1,064,874,000 | ₱536,017,000 | ₱317,304,000 | ₱115,784,000 | 33,994 | ₱28,508 |
| Cebu City | ₱4,924,902,000 | ₱2,414,621,000 | ₱1,772,401,000 | ₱583,556,000 | 173,233 | ₱27,539 |
| Cebu Province | ₱17,066,760,000 | ₱9,352,795,000 | ₱5,050,146,000 | ₱2,173,463,000 | 535,034 | ₱30,982 |
| Danao City | ₱1,242,214,000 | ₱567,008,000 | ₱474,565,000 | ₱99,669,000 | 34,733 | ₱32,858 |
| Lapu-lapu City | ₱2,547,578,000 | ₱1,299,534,000 | ₱881,946,000 | ₱247,403,000 | 99,709 | ₱24,360 |
| Mandaue City | ₱1,950,515,000 | ₱957,060,000 | ₱686,509,000 | ₱200,252,000 | 64,310 | ₱28,671 |
| Naga City | ₱1,035,482,000 | ₱455,471,000 | ₱383,344,000 | ₱130,741,000 | 30,010 | ₱32,308 |
| Tagbilaran City | ₱716,036,000 | ₱298,671,000 | ₱247,880,000 | ₱111,496,000 | 18,931 | ₱34,760 |
| Talisay City | ₱1,393,114,000 | ₱689,771,000 | ₱441,500,000 | ₱177,014,000 | 53,004 | ₱24,683 |
| Toledo City | ₱1,504,787,000 | ₱803,613,000 | ₱442,008,000 | ₱162,381,000 | 50,732 | ₱27,754 |
Region VIII - Eastern Visayas: ₱48.09 billion, 1,076,354 learners, ₱44,676 per learner
| Division | All lines | Elementary | Junior high | Senior high | Learners | Per learner |
|---|---|---|---|---|---|---|
| Baybay City | ₱1,062,867,000 | ₱550,233,000 | ₱318,327,000 | ₱131,204,000 | 24,945 | ₱40,079 |
| Biliran | ₱1,850,481,000 | ₱1,013,883,000 | ₱535,647,000 | ₱213,542,000 | 46,806 | ₱37,668 |
| Borongan City | ₱788,088,000 | ₱406,127,000 | ₱219,772,000 | ₱106,755,000 | 17,544 | ₱41,761 |
| Calbayog City | ₱2,113,359,000 | ₱1,249,089,000 | ₱618,711,000 | ₱208,125,000 | 47,138 | ₱44,039 |
| Catbalogan City | ₱1,054,707,000 | ₱514,533,000 | ₱310,590,000 | ₱143,340,000 | 26,552 | ₱36,474 |
| Eastern Samar | ₱4,489,989,000 | ₱2,680,855,000 | ₱1,232,323,000 | ₱486,504,000 | 96,984 | ₱45,365 |
| Leyte | ₱13,414,196,000 | ₱8,191,666,000 | ₱3,565,123,000 | ₱1,448,975,000 | 337,094 | ₱39,175 |
| Maasin City | ₱813,487,000 | ₱457,088,000 | ₱238,673,000 | ₱58,736,000 | 14,134 | ₱53,382 |
| Northern Samar | ₱6,779,566,000 | ₱4,050,352,000 | ₱1,948,781,000 | ₱673,031,000 | 161,643 | ₱41,277 |
| Ormoc City | ₱1,743,265,000 | ₱898,302,000 | ₱568,585,000 | ₱178,927,000 | 53,028 | ₱31,037 |
| Samar | ₱6,225,540,000 | ₱3,854,443,000 | ₱1,631,853,000 | ₱551,484,000 | 128,518 | ₱46,980 |
| Southern Leyte | ₱3,238,422,000 | ₱1,882,111,000 | ₱898,076,000 | ₱338,634,000 | 69,802 | ₱44,681 |
| Tacloban City | ₱1,797,229,000 | ₱913,869,000 | ₱642,491,000 | ₱213,738,000 | 52,166 | ₱33,932 |
Region IX - Zamboanga Peninsula: ₱35.13 billion, 1,063,522 learners, ₱33,035 per learner
| Division | All lines | Elementary | Junior high | Senior high | Learners | Per learner |
|---|---|---|---|---|---|---|
| Dapitan City | ₱891,866,000 | ₱450,515,000 | ₱245,955,000 | ₱100,161,000 | 20,443 | ₱38,968 |
| Dipolog City | ₱1,205,700,000 | ₱530,742,000 | ₱399,014,000 | ₱172,706,000 | 32,912 | ₱33,497 |
| Isabela City | ₱1,252,027,000 | ₱659,048,000 | ₱339,142,000 | ₱140,176,000 | 31,998 | ₱35,576 |
| Pagadian City | ₱1,557,138,000 | ₱775,050,000 | ₱520,133,000 | ₱145,315,000 | 43,890 | ₱32,821 |
| Sulu | ₱485,878,000 | ₱361,615,000 | ₱73,616,000 | ₱19,832,000 | 141,816 | Not comparable |
| Zamboanga City | ₱6,019,787,000 | ₱3,217,912,000 | ₱1,836,976,000 | ₱771,015,000 | 234,814 | ₱24,811 |
| Zamboanga Sibugay | ₱5,959,951,000 | ₱3,392,613,000 | ₱1,672,291,000 | ₱587,428,000 | 157,190 | ₱35,959 |
| Zamboanga del Norte | ₱7,912,665,000 | ₱4,709,119,000 | ₱1,919,441,000 | ₱791,046,000 | 211,429 | ₱35,093 |
| Zamboanga del Sur | ₱8,007,886,000 | ₱4,707,650,000 | ₱2,138,069,000 | ₱678,253,000 | 189,030 | ₱39,803 |
Region X - Northern Mindanao: ₱38.64 billion, 1,117,374 learners, ₱34,583 per learner
| Division | All lines | Elementary | Junior high | Senior high | Learners | Per learner |
|---|---|---|---|---|---|---|
| Bukidnon | ₱8,422,720,000 | ₱5,463,194,000 | ₱1,882,934,000 | ₱892,735,000 | 279,129 | ₱29,516 |
| Cagayan de Oro City | ₱3,713,489,000 | ₱2,048,644,000 | ₱1,210,117,000 | ₱360,429,000 | 138,334 | ₱26,163 |
| Camiguin | ₱953,143,000 | ₱502,051,000 | ₱268,010,000 | ₱128,344,000 | 21,822 | ₱41,170 |
| El Salvador City | ₱412,188,000 | ₱204,462,000 | ₱106,056,000 | ₱47,663,000 | 12,401 | ₱28,883 |
| Gingoog City | ₱1,367,008,000 | ₱731,929,000 | ₱353,720,000 | ₱191,384,000 | 33,830 | ₱37,749 |
| Iligan City | ₱2,399,112,000 | ₱1,331,388,000 | ₱719,262,000 | ₱264,692,000 | 78,956 | ₱29,324 |
| Lanao del Norte | ₱4,493,285,000 | ₱2,908,623,000 | ₱1,041,511,000 | ₱405,078,000 | 138,443 | ₱31,459 |
| Malaybalay City | ₱1,677,045,000 | ₱804,253,000 | ₱523,920,000 | ₱253,606,000 | 51,812 | ₱30,529 |
| Misamis Occidental | ₱2,922,578,000 | ₱1,922,989,000 | ₱674,344,000 | ₱228,465,000 | 65,464 | ₱43,166 |
| Misamis Oriental | ₱5,885,779,000 | ₱3,279,828,000 | ₱1,847,170,000 | ₱597,183,000 | 184,445 | ₱31,035 |
| Oroquieta City | ₱781,514,000 | ₱399,585,000 | ₱232,883,000 | ₱89,761,000 | 15,489 | ₱46,629 |
| Ozamiz City | ₱1,132,767,000 | ₱570,746,000 | ₱350,254,000 | ₱130,126,000 | 30,414 | ₱34,561 |
| Tangub City | ₱718,924,000 | ₱374,501,000 | ₱204,415,000 | ₱82,913,000 | 17,065 | ₱38,783 |
| Valencia City | ₱1,572,468,000 | ₱895,132,000 | ₱413,632,000 | ₱177,756,000 | 49,770 | ₱29,868 |
Region XI - Davao: ₱38.84 billion, 1,160,512 learners, ₱33,466 per learner
| Division | All lines | Elementary | Junior high | Senior high | Learners | Per learner |
|---|---|---|---|---|---|---|
| Davao City | ₱10,002,386,000 | ₱5,404,929,000 | ₱3,192,130,000 | ₱1,168,654,000 | 364,012 | ₱26,828 |
| Davao Occidental | ₱2,733,606,000 | ₱1,648,651,000 | ₱707,365,000 | ₱271,656,000 | 71,224 | ₱36,893 |
| Davao Oriental | ₱4,026,788,000 | ₱2,412,383,000 | ₱1,075,586,000 | ₱408,446,000 | 107,100 | ₱36,381 |
| Davao de Oro | ₱5,842,692,000 | ₱3,137,482,000 | ₱1,806,073,000 | ₱736,028,000 | 182,333 | ₱31,150 |
| Davao del Norte | ₱3,949,447,000 | ₱2,166,702,000 | ₱1,108,039,000 | ₱544,360,000 | 117,348 | ₱32,545 |
| Davao del Sur | ₱3,556,956,000 | ₱2,174,383,000 | ₱877,907,000 | ₱375,646,000 | 104,840 | ₱32,697 |
| Digos City | ₱1,240,368,000 | ₱649,816,000 | ₱416,949,000 | ₱87,926,000 | 39,835 | ₱28,987 |
| Island Garden City of Samal | ₱1,027,738,000 | ₱511,034,000 | ₱303,278,000 | ₱147,218,000 | 28,316 | ₱33,957 |
| Mati City | ₱1,353,673,000 | ₱695,020,000 | ₱406,212,000 | ₱157,088,000 | 37,597 | ₱33,469 |
| Panabo City | ₱1,407,816,000 | ₱708,613,000 | ₱411,180,000 | ₱199,110,000 | 47,098 | ₱28,003 |
| Tagum City | ₱1,718,138,000 | ₱827,720,000 | ₱582,682,000 | ₱222,952,000 | 60,809 | ₱26,860 |
Region XII - SOCCSKSARGEN: ₱34.11 billion, 1,017,516 learners, ₱33,521 per learner
| Division | All lines | Elementary | Junior high | Senior high | Learners | Per learner |
|---|---|---|---|---|---|---|
| Cotabato | ₱9,044,768,000 | ₱5,137,389,000 | ₱2,563,193,000 | ₱1,030,145,000 | 276,595 | ₱31,565 |
| General Santos City | ₱3,904,146,000 | ₱1,979,010,000 | ₱1,270,845,000 | ₱546,302,000 | 150,907 | ₱25,156 |
| Kidapawan City | ₱1,439,135,000 | ₱688,434,000 | ₱433,496,000 | ₱218,879,000 | 40,207 | ₱33,348 |
| Koronadal City | ₱1,319,485,000 | ₱655,265,000 | ₱384,067,000 | ₱189,186,000 | 41,624 | ₱29,515 |
| Sarangani | ₱4,894,882,000 | ₱2,748,819,000 | ₱1,399,364,000 | ₱558,658,000 | 141,723 | ₱33,212 |
| South Cotabato | ₱5,982,281,000 | ₱3,323,536,000 | ₱1,649,288,000 | ₱845,145,000 | 188,055 | ₱30,938 |
| Sultan Kudarat | ₱5,140,180,000 | ₱3,135,186,000 | ₱1,272,227,000 | ₱567,829,000 | 156,362 | ₱31,819 |
| Tacurong City | ₱807,452,000 | ₱420,087,000 | ₱220,343,000 | ₱104,990,000 | 22,043 | ₱33,817 |
Region XIII - CARAGA: ₱27.24 billion, 670,999 learners, ₱40,601 per learner
| Division | All lines | Elementary | Junior high | Senior high | Learners | Per learner |
|---|---|---|---|---|---|---|
| Agusan del Norte | ₱2,710,904,000 | ₱1,530,118,000 | ₱746,407,000 | ₱282,390,000 | 69,973 | ₱36,570 |
| Agusan del Sur | ₱5,969,832,000 | ₱3,469,191,000 | ₱1,614,291,000 | ₱609,843,000 | 158,739 | ₱35,866 |
| Bayugan City | ₱1,074,684,000 | ₱580,812,000 | ₱292,181,000 | ₱116,079,000 | 25,856 | ₱38,253 |
| Bislig City | ₱905,218,000 | ₱478,332,000 | ₱244,095,000 | ₱75,908,000 | 20,219 | ₱39,484 |
| Butuan City | ₱2,925,647,000 | ₱1,396,265,000 | ₱1,032,591,000 | ₱363,269,000 | 84,500 | ₱33,043 |
| Cabadbaran City | ₱654,108,000 | ₱329,325,000 | ₱175,276,000 | ₱80,120,000 | 18,239 | ₱32,059 |
| Dinagat Island | ₱1,297,985,000 | ₱662,087,000 | ₱374,337,000 | ₱141,848,000 | 27,747 | ₱42,465 |
| Siargao | ₱1,414,418,000 | ₱820,158,000 | ₱355,258,000 | ₱122,434,000 | 34,098 | ₱38,062 |
| Surigao City | ₱1,182,623,000 | ₱657,570,000 | ₱290,028,000 | ₱120,091,000 | 32,487 | ₱32,865 |
| Surigao del Norte | ₱2,410,172,000 | ₱1,201,535,000 | ₱728,657,000 | ₱334,080,000 | 61,698 | ₱36,699 |
| Surigao del Sur | ₱4,772,233,000 | ₱2,707,610,000 | ₱1,312,535,000 | ₱503,605,000 | 121,479 | ₱37,239 |
| Tandag City | ₱589,008,000 | ₱287,785,000 | ₱167,071,000 | ₱63,434,000 | 15,964 | ₱32,466 |
DBM, NEP FY 2027 data; DepEd, enrollment, SY 2025-2026 (public schools DepEd manages, outside BARMM); DepEd, School MOOE allocation, FY 2026.
Reading a division’s card:
- “All of its 2027 lines” is everything in the division’s own lines: the division office, every elementary school’s pay and MOOE, and the lines of its schools that have their own. It leaves out the Central Office’s and the regional office’s lines.
- “Per learner” is the division’s elementary, junior high and senior high lines over its learners at each level. A rank of 1 is the most per learner among 218 divisions.
- “Against the size line” compares a level’s line with what divisions of the same number of learners get on average, on the line fitted through all 218 (explained under “Does the money follow the learners?”). At 1.00× a division gets what its size predicts; at 1.25×, a quarter more.
A school’s card gives its junior and senior high lines (personnel services and MOOE), whether the printed NEP names it, whether its MOOE lines equal its FY 2026 allocation, and its MOOE per learner beside the median for schools of its size.
Your school’s MOOE in 2027
The NEP’s school lines repeat the FY 2026 allocations. Of the 10,508 schools whose junior high MOOE appears both in the NEP and in DepEd’s FY 2026 School MOOE allocation list, 10,507 have the same amount to the peso; of the 7,675 with senior high MOOE in both, 7,674 do. Two lines rise: Butuan City Integrated High School’s junior high line (₱1,499,000 in the NEP against ₱1,484,000 in FY 2026) and Tuguegarao City West High School’s senior high line (₱907,000 against ₱436,000). Three FY 2026 lines have no 2027 line: Tuguegarao City West High School’s junior high (₱1,015,000), Babag National High School - Babag Night HS Extension’s junior high (₱704,000) and San Matias National High School’s senior high (₱3,722,000). The divisions’ elementary MOOE lines come to ₱35,732,817,000, within 0.1% of the ₱35,696,423,000 of elementary MOOE in the FY 2026 list, and the Central Office holds another ₱1,503,308,000 of the three school-operation activities’ MOOE, assigned to no school.
The NEP line may not be what a school receives. DepEd puts its 2027 school-level MOOE at ₱61.02 billion, which is the NEP’s school-operation MOOE with the Central Office’s share, and says that “for 2027, DepEd will also fully implement its Simplified Normative Funding Formula”, under which “school enrollment and baseline data will be used to determine operating requirements”. Its per-learner rates rise from ₱2,792 to ₱2,982 for elementary, ₱2,631 to ₱2,744 for junior high, and ₱3,264 to ₱3,558 for senior high (Daily Tribune, September 24, 2026). A school’s 2027 amount is the one in DepEd’s FY 2027 School MOOE allocation list, once DepEd issues it.
The FY 2026 list was computed with the normative formula: a fixed amount for each school’s curricular offering plus an amount for every learner, from SY 2024-2025 enrollment. School MOOE under the Normative Formula works the formula out, and School MOOE, FY 2020 to FY 2026 follows each school’s allocation over seven years. 246 schools in the 2027 NEP have operating-unit codes that are not on the FY 2026 list, so there is no FY 2026 amount to compare.
Because the formula gives every school a fixed amount, a small school’s NEP line comes to more per learner:
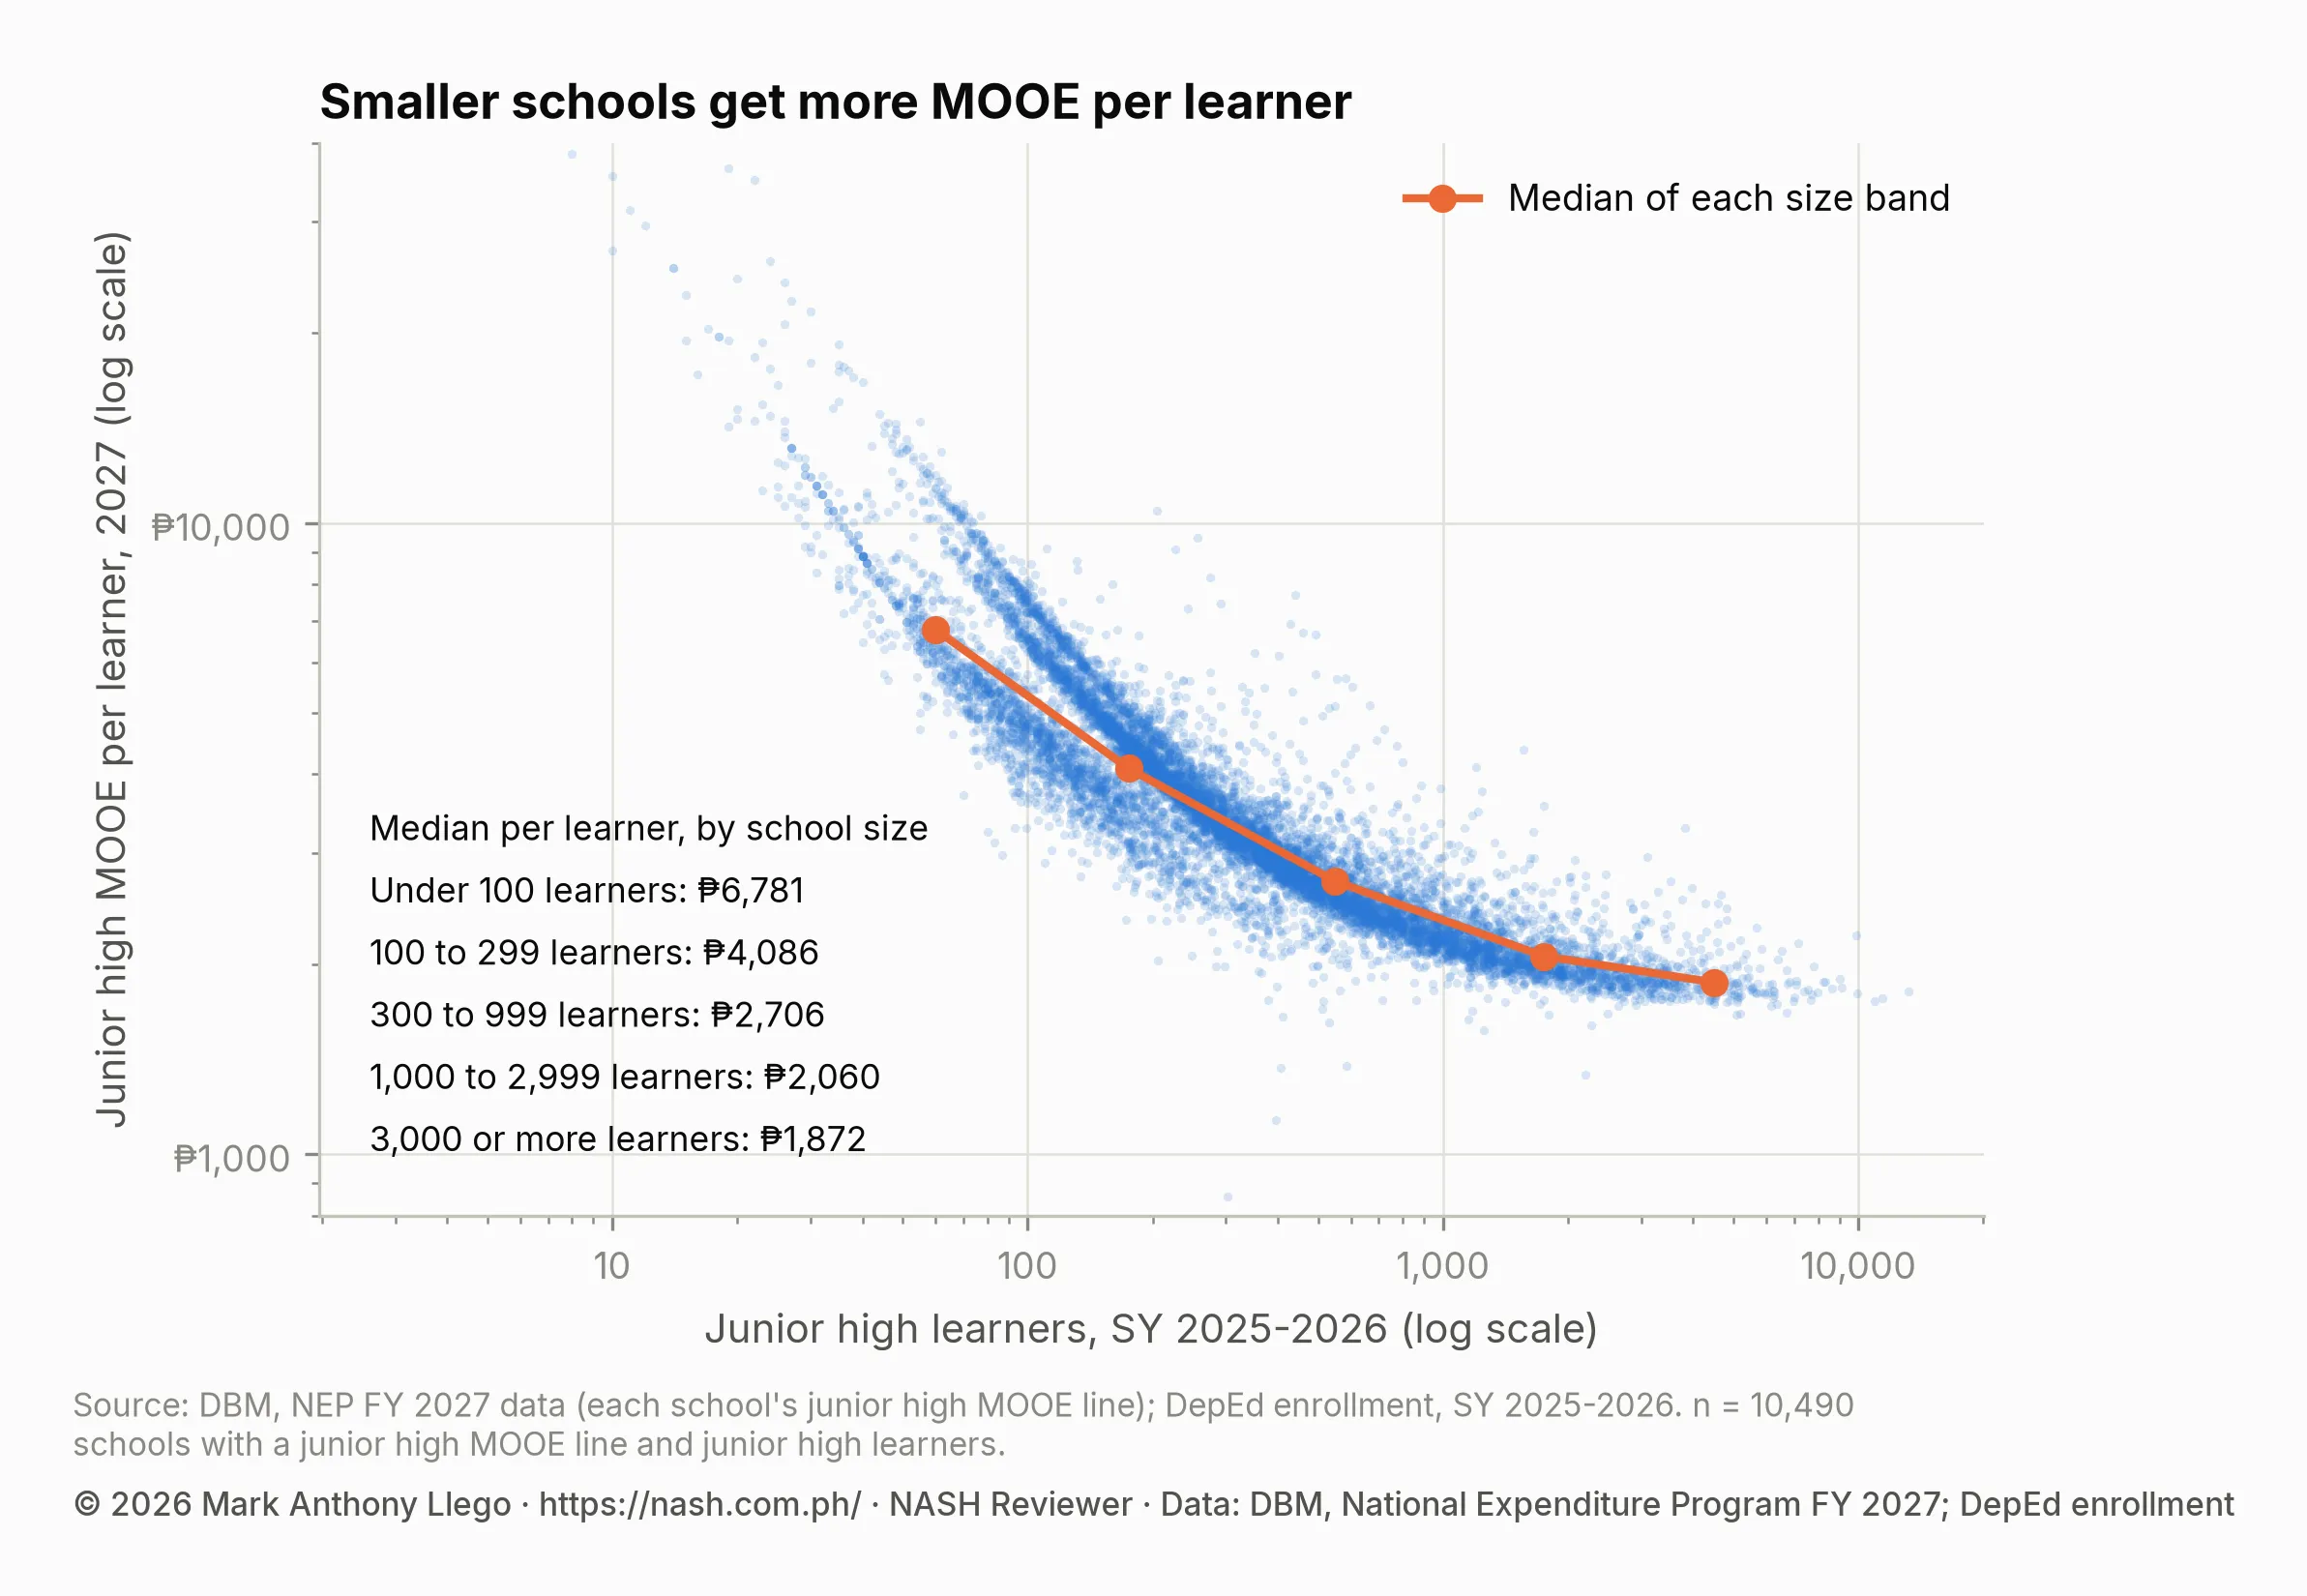
Across the 10,490 schools with both a junior high MOOE line and junior high learners, the Spearman rank correlation between a school’s size and its MOOE per learner is −0.94: with few exceptions, the larger the school, the less it gets per learner. Senior high MOOE follows the same pattern (−0.86 across 7,622 schools), from a median of ₱5,427 per learner in schools with under 100 senior high learners to ₱2,794 in those with 3,000 or more.
Does the money follow the learners?
A school head reading a division’s line will ask whether it is fair: whether learners in one division get much more or much less than learners elsewhere. The figures in this section answer that for the money that reaches schools: each division’s elementary, junior high and senior high lines, set against its learners at that level in SY 2025-2026.
How the figures are computed
- Money. A division’s line for a level is the personnel services, MOOE and capital outlays of that level’s activity in the division (Operation of Schools - Elementary, Junior High School or Senior High School), held by the division office and its schools. Lines the Central Office and regional office hold are left out, because no division holds them yet.
- Learners. The learners at that level in the division’s public schools that DepEd manages, SY 2025-2026.
- Three divisions. The 2027 lines of the new Divisions of Calaca City and Carmona City carry no elementary or senior high salaries, so each is counted with the province division around it (Batangas, Cavite). Sulu’s lines carry no personnel services, so it is left out. That leaves 218 comparable divisions.
- Weighting. Every inequality measure weights a division by its learners, so it describes what learners get, not what the average division gets. The fitted lines count each division once.
- No sampling error. The figures cover every division, not a sample, so they carry no margin of error. Where an interval appears below, it gives the range of slopes consistent with how widely divisions scatter around the line.
What the measures show
Statistics
How evenly the 2027 money is spread across schools divisions, per learner
Each curve lines up the 218 comparable divisions from the least money per learner to the most, and adds up their learners (across) and their money (up). If every learner got the same, the curve would be the dashed line; the further it sags, the more uneven the money.
Elementary: ₱31,308 per learner on average, 12,441,276 learners
Across: share of elementary learners, from the divisions with the least per learner. Up: their share of the elementary money. Gridlines every 25%.
- Gini index0.1410 when every learner gets the same; near 1 when a few learners get nearly all of it.
- Theil index0.031662.3% of it lies between regions and 37.7% between divisions of the same region.
- 90th to 10th percentile1.97×The learner at the 90th percentile is in a division with ₱42,298 per learner; at the 10th, ₱21,424.
- McLoone index0.816What the half of learners below the median gets, over what they would get at the median (₱30,724).
- Verstegen index1.220The same for the half above the median: how far the top pulls away.
- Coefficient of variation25.6%The spread of per-learner money across learners, as a share of the mean.
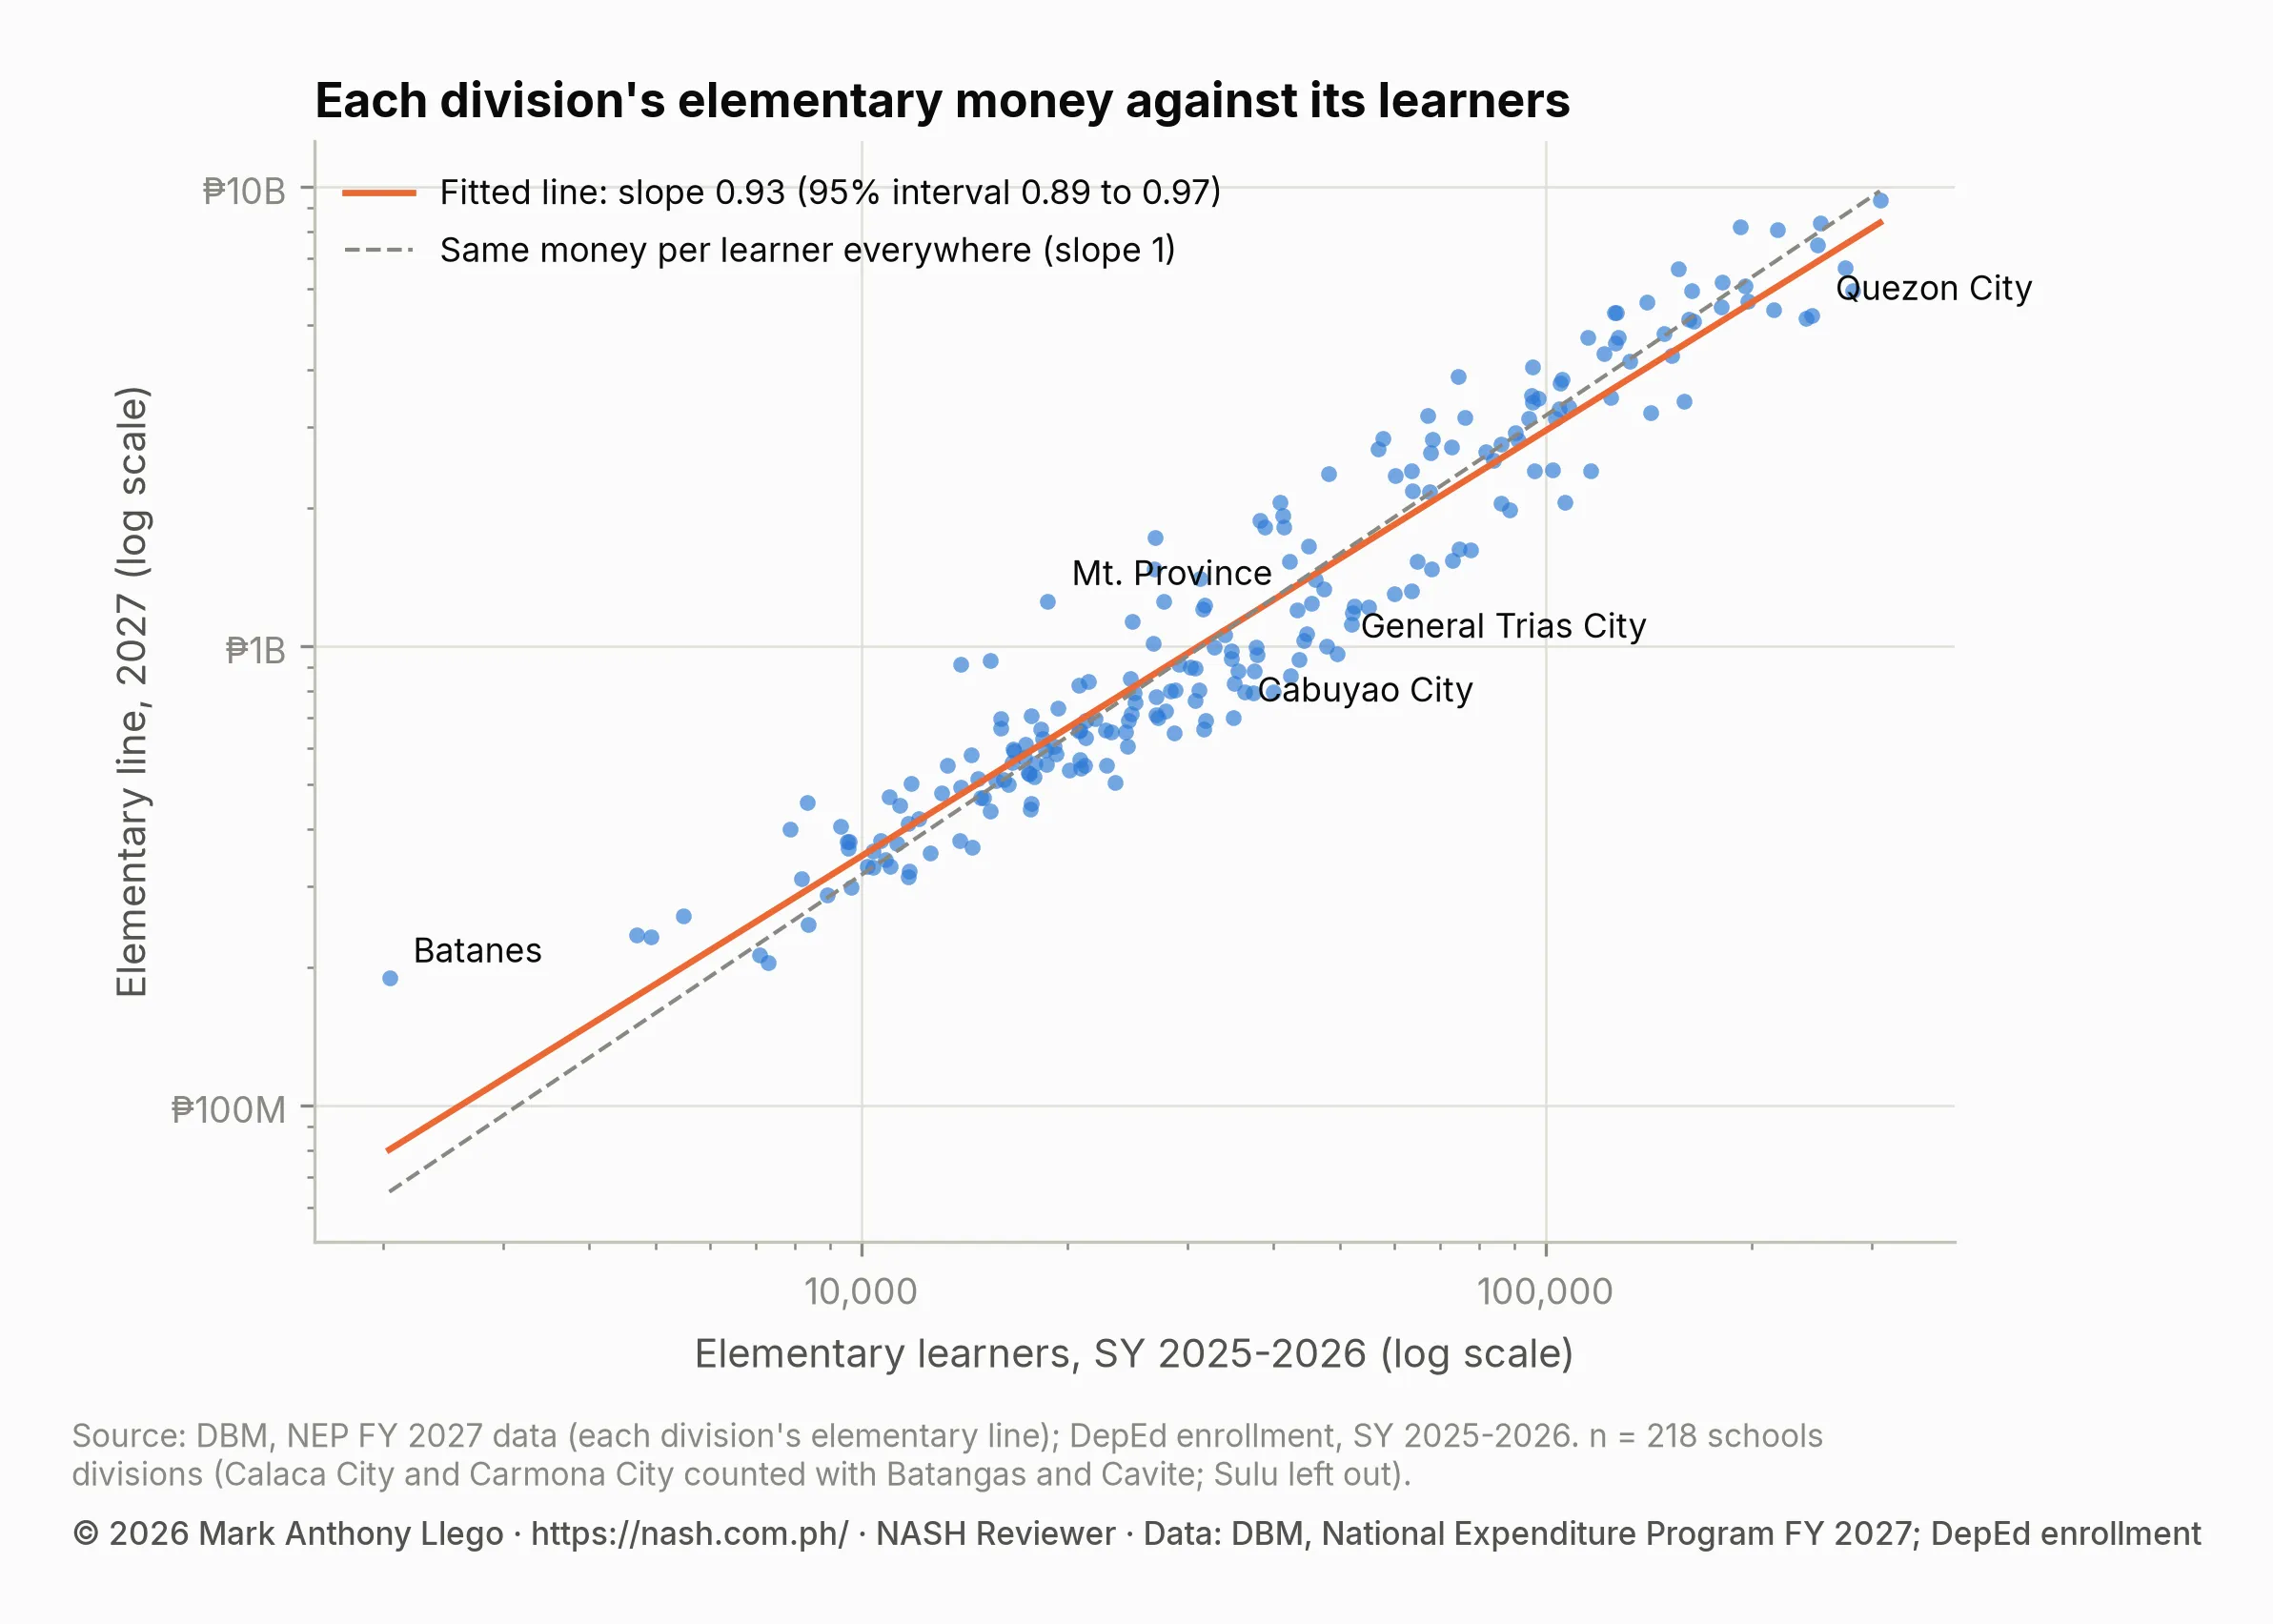
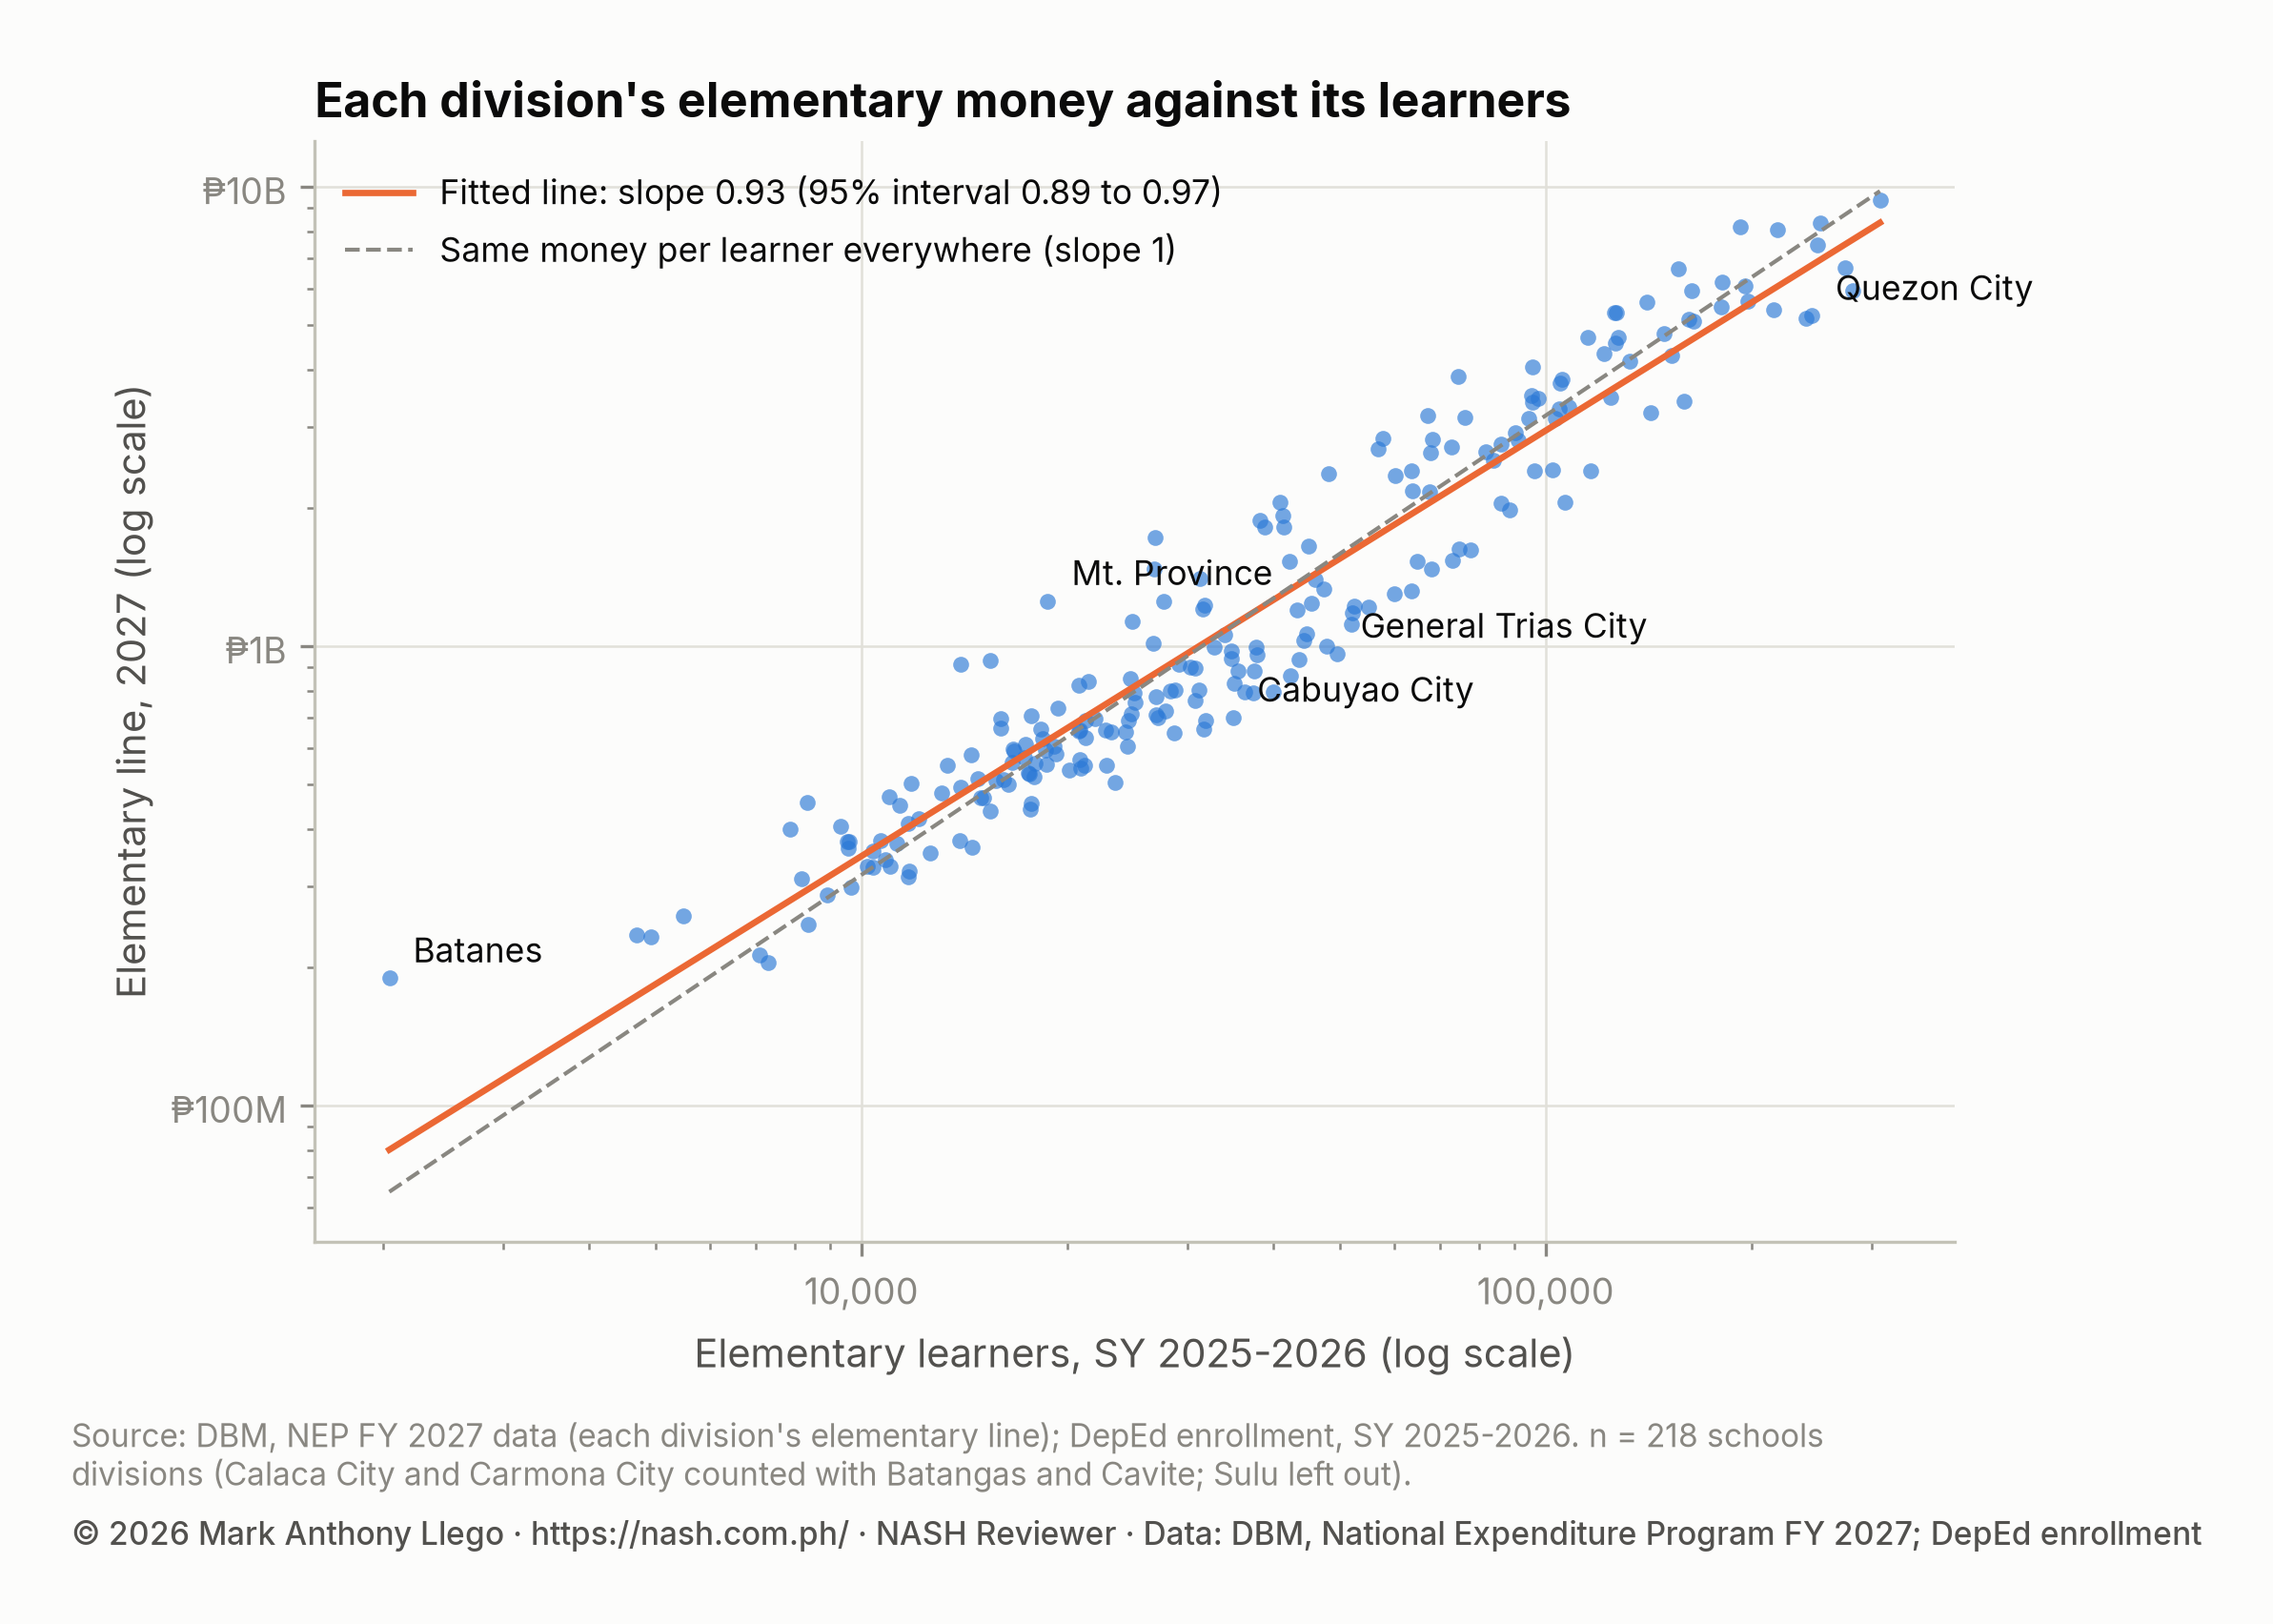
- Money against learners0.926For each 1% more elementary learners a division has, its elementary line is 0.93% larger (95% interval 0.89 to 0.97; R² 0.92). A median line through the same divisions: 0.98 (0.93 to 1.02). Below 1 on both, smaller divisions get more per learner.
- Least and most per learner₱19,281 to ₱92,653Antipolo City and Batanes.
Junior high: ₱33,809 per learner on average, 6,362,576 learners
Across: share of junior high learners, from the divisions with the least per learner. Up: their share of the junior high money. Gridlines every 25%.
- Gini index0.0850 when every learner gets the same; near 1 when a few learners get nearly all of it.
- Theil index0.011953.5% of it lies between regions and 46.5% between divisions of the same region.
- 90th to 10th percentile1.46×The learner at the 90th percentile is in a division with ₱40,138 per learner; at the 10th, ₱27,413.
- McLoone index0.898What the half of learners below the median gets, over what they would get at the median (₱33,124).
- Verstegen index1.143The same for the half above the median: how far the top pulls away.
- Coefficient of variation15.7%The spread of per-learner money across learners, as a share of the mean.
- Money against learners0.931For each 1% more junior high learners a division has, its junior high line is 0.93% larger (95% interval 0.90 to 0.97; R² 0.96). A median line through the same divisions: 0.95 (0.92 to 0.98). Below 1 on both, smaller divisions get more per learner.
- Least and most per learner₱20,655 to ₱112,024General Trias City and Batanes.
Senior high: ₱33,224 per learner on average, 2,352,957 learners
Across: share of senior high learners, from the divisions with the least per learner. Up: their share of the senior high money. Gridlines every 25%.
- Gini index0.0510 when every learner gets the same; near 1 when a few learners get nearly all of it.
- Theil index0.004520.1% of it lies between regions and 79.9% between divisions of the same region.
- 90th to 10th percentile1.24×The learner at the 90th percentile is in a division with ₱36,832 per learner; at the 10th, ₱29,604.
- McLoone index0.933What the half of learners below the median gets, over what they would get at the median (₱33,096).
- Verstegen index1.076The same for the half above the median: how far the top pulls away.
- Coefficient of variation9.6%The spread of per-learner money across learners, as a share of the mean.
- Money against learners0.961For each 1% more senior high learners a division has, its senior high line is 0.96% larger (95% interval 0.94 to 0.98; R² 0.98). A median line through the same divisions: 0.97 (0.95 to 0.99). Below 1 on both, smaller divisions get more per learner.
- Least and most per learner₱23,175 to ₱61,675Taguig and Pateros and Batanes.
Choose a division to mark it on the open curve.
DBM, NEP FY 2027 data, the elementary, junior high and senior high lines of each schools division; DepEd, enrollment, SY 2025-2026. Every inequality measure weights a division by its learners; the fitted lines count each division once.
The measures are the ones school-finance researchers use to compare spending across districts:
| Level | Mean per learner | Gini index | Theil index (share between regions) | 90th to 10th percentile | McLoone index | Verstegen index |
|---|---|---|---|---|---|---|
| Elementary | ₱31,308 | 0.141 | 0.0316 (62.3%) | 1.97 | 0.816 | 1.220 |
| Junior high | ₱33,809 | 0.085 | 0.0119 (53.6%) | 1.46 | 0.898 | 1.143 |
| Senior high | ₱33,224 | 0.051 | 0.0045 (20.1%) | 1.24 | 0.933 | 1.076 |
Table: DBM, NEP FY 2027 data, division lines by level; DepEd enrollment, SY 2025-2026; 218 divisions, weighted by learners.
- The Gini index is 0 when every learner gets the same, and near 1 when a few learners get nearly all of it. Elementary money (0.141) is spread less evenly than junior high (0.085) or senior high money (0.051).
- The Theil index splits the same inequality into a part between regions and a part between divisions of the same region. For elementary schools 62.3% lies between regions: much of the gap is where a division is, not which division it is. For senior high only 20.1% does.
- The 90th-to-10th percentile ratio compares the learner at the 90th percentile with the learner at the 10th. An elementary learner at the 90th percentile is in a division with 1.97 times the money per learner of one at the 10th.
- The McLoone and Verstegen indices look at each half of learners. A McLoone index of 0.816 means the elementary learners below the median get 81.6% of what they would at the median; a Verstegen index of 1.220 means those above it get 22.0% more.
Elementary money per learner runs from ₱19,281 in the Division of Antipolo City to ₱92,653 in the Division of Batanes. Junior high runs from ₱20,655 in General Trias City to ₱112,024 in Batanes, and senior high from ₱23,175 in Taguig and Pateros to ₱61,675 in Batanes.
Do smaller divisions get more per learner?
If every learner got the same, a division with twice the learners would get twice the money. Fitting a line through the 218 divisions on logarithmic scales measures how far that holds:
| Level | Fitted line (95% interval) | R² | Median line (95% interval) | Weighted by learners (95% interval) |
|---|---|---|---|---|
| Elementary | 0.926 (0.887 to 0.966) | 0.923 | 0.976 (0.928 to 1.025) | 0.959 (0.913 to 1.005) |
| Junior high | 0.931 (0.896 to 0.967) | 0.961 | 0.946 (0.915 to 0.976) | 0.951 (0.923 to 0.978) |
| Senior high | 0.961 (0.939 to 0.983) | 0.982 | 0.973 (0.953 to 0.992) | 0.985 (0.970 to 0.999) |
Table: the logarithm of each division’s level line on the logarithm of its learners, 218 divisions. Fitted line: ordinary least squares with heteroskedasticity-robust (HC3) intervals. Median line: median (quantile) regression. Weighted: least squares weighting each division by its learners, HC3 intervals.
A slope below 1 means the money grows more slowly than the learners: on the fitted line, a division with 10% more elementary learners has about 9.2% more elementary money. For junior and senior high, every way of fitting the line gives a slope below 1 with an interval that excludes 1: smaller divisions get more per learner. For elementary, the fitted line’s slope rests mostly on a few small divisions far above it. The median line, which those few cannot pull, has a slope of 0.976 with an interval that includes 1, and so does the line weighted by learners: the elementary data do not rule out money that keeps pace with learners. On the logarithmic scale, learner numbers alone account for 92.3% of the variation in elementary lines and 98.2% in senior high lines.
The divisions furthest from the elementary line show what the line leaves out. Above it are small, mountainous or island divisions: Batanes at 2.36 times what its size predicts, then Mt. Province (2.01), Abra (1.98), Kalinga (1.92) and Apayao (1.79). Below it are large city divisions in Cavite, Laguna and Metro Manila: General Trias City and Cabuyao City at 0.63, Sta. Rosa City at 0.63, Marikina at 0.65, and San Pedro City at 0.65. Personnel services make up most of every elementary line (₱28,465 of the ₱31,308 per learner), and they pay for the positions a division has. The NEP gives no reason for any division’s amount.
Teachers, principals and other positions in 2027
Money for positions sits in two places in the NEP: in DepEd’s own lines, and in the Miscellaneous Personnel Benefits Fund, ₱55.87 billion that pays, among other things, “Personnel Services requirements for filling of, and creation of positions” of national government personnel, without naming an agency (NEP FY 2027, Volume III, Miscellaneous Personnel Benefits Fund, p. 944, Special Provision 1). The President’s Budget Message names counts that DepEd’s chapter does not. The ledger below sets each figure beside its source.
Ledger
The money for positions in the 2027 proposal, and where each figure comes from
Each row says whether the NEP itself shows it, or only the President's Budget Message, a DBM or DepEd statement, a request DepEd made, or EDCOM 2.
School Principal I positions: four counts
Pay for teaching positions to be filledIn the NEP
₱31,220,074,00064,530 teaching positions: 31,614 vacant on April 24, 2026 and 32,916 created in May 2026
Where in the NEP: New School Personnel Positions, held at the Central Office
DBM and DepEd gave ₱31.22 billion for the 64,530 positions; the Central Office line is that amount to the thousand.
Source: DBM, NEP FY 2027 data, DepEd; DepEd-DBM joint statement, September 10, 2026 (as reported by SunStar)
Lump sum for filling positions (every title)In the NEP
₱33,732,376,000
Where in the NEP: Object of expenditure: Lump-sum for filling of Positions - Civilian
₱29,725,463,000 in 2026.
Source: NEP FY 2027, DepEd, Obligations by Object of Expenditures (pp. 595-597)
Newly created teaching positions to be filled in 2027 (target)In the NEP
0 positions
Where in the NEP: Performance Information, Basic Education Inputs Program, output indicator 3
The 2026 target is 32,916. For 2025 the NEP gives a target of 20,000 and 18,684 filled.
Source: NEP FY 2027, DepEd, Performance Information (pp. 598, 600)
More teaching positions DepEd asked forRequested, not funded
₱4,290,000,00014,274 teaching positions
An estimated amount, reported as not in the proposal.
Source: DepEd-DBM joint statement, September 10, 2026 (as reported by SunStar)
Substitute teachersIn the NEP
₱7,582,112,000
Where in the NEP: Object 5010103000, Salaries and Wages - Substitute Teachers
Source: DBM, NEP FY 2027 data, DepEd; DepEd-DBM joint statement, September 10, 2026 (as reported by the Daily Tribune)
Teaching allowance, ₱10,000 for each teacherIn the NEP
₱10,364,150,0001,036,415 teachers (about)
Where in the NEP: Implementation of the Grant of Cash Allowance, Hardship Pay, and Reclassification of Positions, Central Office
Source: DBM, NEP FY 2027 data, DepEd; NEP FY 2027, DepEd, Special Provisions (pp. 345-349); President's Budget Message FY 2027, p. 20
Special Hardship AllowanceIn the NEP
₱5,795,358,000
Where in the NEP: Implementation of the Grant of Cash Allowance, Hardship Pay, and Reclassification of Positions, regional offices
Special Provision 7 sets it at 25% of the basic monthly salary.
Source: DBM, NEP FY 2027 data, DepEd; NEP FY 2027, DepEd, Obligations by Object of Expenditures (pp. 595-597)
World Teachers' Day Incentive Benefit, ₱1,000 for each teacherIn the NEP
₱1,039,893,000
Where in the NEP: World Teachers' Day Incentive Benefits
Source: DBM, NEP FY 2027 data, DepEd; NEP FY 2027, DepEd, Special Provisions (pp. 345-349)
New positions for school leadership and administrationDBM or DepEd statement
₱840,589,0002,135 positions: 1,000 School Principal I, 1,000 Project Development Officer I, 135 Administrative Officer II
DBM's release gives ₱840.59 million for 2,135 positions; the split by title is the joint statement's.
Source: DBM news release, September 5, 2026; DepEd-DBM joint statement, September 10, 2026 (as reported by the Daily Tribune)
School Principal I positions created for 2026DBM or DepEd statement
6,000 School Principal I positions
EDCOM 2 reported that DepEd had filled 843 of them as of September 30, 2026.
Source: DepEd at the Senate Finance Committee hearing, October 16, 2026 (as reported by GMA News); EDCOM 2, November 12, 2026
School Principal I positions DepEd asked forRequested, not funded
₱10,520,000,00014,126 School Principal I positions
At the Senate hearing on October 16, 2026, DepEd put it at more than 14,000 positions and about ₱10.5 billion.
Source: DepEd's request, as reported by the Philippine Daily Inquirer, September 8, 2026; DepEd at the Senate Finance Committee hearing, October 16, 2026 (as reported by GMA News)
New School Principal I positions EDCOM 2 says are proposedEDCOM 2 figure
3,000 School Principal I positions
Neither the NEP, the Budget Message nor House Bill No. 10858 gives 3,000; the Budget Message gives 1,000.
Source: EDCOM 2, November 12, 2026
New positions, every title: 1,800 School Counselor Associate I and 221 School Division CounselorIn the NEP
₱801,583,0002,021 positions: 1,800 School Counselor Associate I and 221 School Division Counselor
Where in the NEP: Object of expenditure: Creation of New Positions
The NEP's Creation of New Positions names no title. The DepEd-DBM joint statement gives this amount for the 2,021 counselor positions; the Budget Message rounds it to ₱802 million.
Source: NEP FY 2027, DepEd, Obligations by Object of Expenditures (pp. 595-597); President's Budget Message FY 2027, p. 19; DepEd-DBM joint statement, September 10, 2026 (as reported by the Daily Tribune)
New School Personnel Positions held at the regional officesIn the NEP
₱519,400,000
Where in the NEP: New School Personnel Positions, the 17 regional offices
The regional amounts are in the region tables. DepEd gave ₱519 million for the 1,800 counselor associates at the October 16 hearing.
Source: DBM, NEP FY 2027 data, DepEd
Reclassification of positions (Expanded Career Progression)In the NEP
₱12,089,952,000135,063 reclassifications
Where in the NEP: Implementation of the Grant of Cash Allowance, Hardship Pay, and Reclassification of Positions, regional offices
₱6,148,433,000 in 2026.
Source: DBM, NEP FY 2027 data, DepEd; NEP FY 2027, DepEd, Obligations by Object of Expenditures (pp. 595-597); President's Budget Message FY 2027, p. 19
Authorized permanent positions (filled: 1,043,192)In the NEP
1,088,053 positions
Where in the NEP: Staffing Summary
The NEP's staffing summary prints the same counts for 2026 and 2027 (1,088,096 authorized in 2025). They leave out positions created during 2026, such as the 32,916 teaching positions DBM approved in May 2026.
Salaries of permanent positionsIn the NEP
₱492,971,596,000
Where in the NEP: Object of expenditure: Basic Salary
₱449,520,117,000 in 2026.
Source: NEP FY 2027, DepEd, Obligations by Object of Expenditures (pp. 595-597); DBM, NEP FY 2027 data, DepEd
Medical AllowanceIn the NEP
₱7,302,344,000
Where in the NEP: Object of expenditure: Medical Allowance
None in 2025 or 2026.
Source: NEP FY 2027, DepEd, Obligations by Object of Expenditures (pp. 595-597)
Retirement and life insurance premiums (automatic appropriation)In the NEP
₱59,156,379,000
Where in the NEP: Object of expenditure: Retirement and Life Insurance Premiums
Source: NEP FY 2027, DepEd, Obligations by Object of Expenditures (pp. 595-597)
NEP FY 2027 (DBM's data and the printed DepEd chapter); the President's Budget Message FY 2027; DBM and DepEd statements; EDCOM 2. Amounts in the strip's rows are in the ledger below it.
Teachers
The proposal pays to fill teaching positions DBM has already created. ₱31,220,074,000 at the Central Office, under New School Personnel Positions, is the ₱31.22 billion that DepEd and DBM said would fill 64,530 teaching positions: 31,614 vacancies as of April 24, 2026, and 32,916 positions created in May 2026 (DepEd-DBM joint statement, September 10, 2026). The NEP’s lump sum for filling positions of every title is ₱33,732,376,000.
The proposal does not fund new teaching positions. The NEP’s target for “newly-created teaching positions filled up” is 0 for 2027, against 32,916 for 2026 (p. 600), and DepEd’s request for 14,274 more teaching positions, an estimated ₱4.29 billion, is not in the proposal (DepEd-DBM joint statement). Special Provision 11 would have DepEd “take all appropriate measures to fill its existing vacant teaching and non-teaching positions before December 31, 2027”, and report on it to the Senate and House basic education committees every quarter.
Other money for teachers:
- Substitute teachers: ₱7,582,112,000.
- Teaching allowance: ₱10,364,150,000, at ₱10,000 for each qualified public school teacher (Special Provision 8, under Republic Act No. 11997); the Budget Message counts about 1,036,415 teachers (p. 20).
- Special Hardship Allowance: ₱5,795,358,000. Special Provision 7 sets it at 25% of the basic monthly salary, and no one may receive it under two or more categories.
- World Teachers’ Day Incentive Benefit: ₱1,039,893,000, at ₱1,000 for each teacher (Special Provision 15).
- Teaching overload: paid from honoraria (₱648,095,000 in all) to teachers who teach more than six hours a day (Special Provision 9).
School principals
The Budget Message says the proposal continues “working toward attaining a one principal, one school ratio through its Php 513 million funding, which includes the creation of 1,000 new School Principal I positions, the promotion of acting school heads, and the reclassification of existing Head Teachers” (p. 20). DBM’s news release of September 5, 2026 gave ₱840.59 million for 2,135 additional positions, “including School Principal I, Project Development Officer I, and Administrative Officer II positions”, which the joint statement split as 1,000, 1,000 and 135.
Neither amount is a line in DepEd’s chapter of the NEP. DepEd’s own “Creation of New Positions”, ₱801,583,000, is the amount the joint statement gives for the counselor positions, and DepEd’s staffing summary lists only School Principal IV by title (2 positions); School Principal I to III are inside its 1,032,568 “Technical” positions. The Miscellaneous Personnel Benefits Fund, which pays for new positions in every agency as one sum, is the likely place for the principals’ money, though the NEP does not say so.
The four counts of School Principal I positions in public statements are:
- 6,000 secured for 2026 (DepEd at the Senate, October 16, 2026, as reported by GMA News), of which DepEd had filled 843 as of September 30, 2026 (EDCOM 2, November 12, 2026);
- 1,000 in the 2027 proposal (President’s Budget Message, p. 20);
- 3,000 that EDCOM 2 described on November 12, 2026 as “proposed for FY 2027”, a figure that neither the NEP, the Budget Message nor House Bill No. 10858 gives;
- 14,126 that DepEd asked for, at ₱10.52 billion (DepEd’s request, as reported by the Philippine Daily Inquirer, September 8, 2026); at the Senate on October 16, 2026, DepEd put it at more than 14,000 positions and about ₱10.5 billion (GMA News).
The reclassification of Head Teachers and teachers-in-charge into principal positions runs through the Expanded Career Progression system; Principal Reclassification under the ECP explains how, and Principals and Head Teachers, SY 2023-2024 counts the schools with and without one.
Counselors
The Budget Message gives ₱802 million “for the creation of 1,800 School Counselor Associate (SCA) I in DepEd elementary and secondary schools and 221 School Division Counselor plantilla positions in DepEd Schools Division Office” (p. 19). The DepEd-DBM joint statement gives “P801.583 million” for the same 2,021 positions (September 10, 2026), which is the NEP’s Creation of New Positions for DepEd, ₱801,583,000, to the thousand. The NEP’s New School Personnel Positions held by the 17 regional offices come to ₱519,400,000, which matches the ₱519 million DepEd gave for the 1,800 counselor associates at the Senate hearing on October 16, 2026 (GMA News). Career Guidance and Counseling in DepEd covers what the counselors do.
Reclassification and career progression
₱12,089,952,000 pays for reclassifying positions under the Expanded Career Progression system, against ₱6,148,433,000 in 2026; the Budget Message says its ₱12.1 billion “will support the promotion of 135,063 qualified educators” (p. 19). It sits in the regional offices’ lines. The Expanded Career Progression System explains who qualifies.
How many positions DepEd has
The NEP’s staffing summary counts 1,088,053 authorized permanent positions in DepEd’s Office of the Secretary for both 2026 and 2027, 1,043,192 of them filled, a gap of 44,861; for 2025 it counts 1,088,096 (NEP FY 2027, Vol. I, p. 344). The counts leave out positions created during 2026, such as the 32,916 teaching positions DBM approved in May 2026 and the 6,000 School Principal I positions for 2026. DBM’s Staffing Summary lists the key positions by title for 2027:
| Position | Positions, 2027 | Salaries, 2027 |
|---|---|---|
| Schools Division Superintendent | 217 | ₱357,616,000 |
| Assistant Schools Division Superintendent | 257 | ₱374,928,000 |
| Chief Education Supervisor | 526 | ₱675,387,000 |
| Director IV | 44 | ₱91,743,000 |
| Director III | 32 | ₱59,613,000 |
| Chief Administrative Officer | 49 | ₱62,917,000 |
| School Principal IV | 2 | ₱2,050,000 |
| All other positions (administrative, support to technical, technical) | 1,086,847 | ₱507,540,123,000 |
Table: DBM, Staffing Summary FY 2027, Department of Education, Office of the Secretary, p. 29. Nineteen more key positions, from the Secretary and the Undersecretaries to the Vocational School Administrators, are in the staffing CSV under “Download the data”.
What DepEd promises to deliver in 2027
The NEP sets a target for each program. Some of the 2027 targets fall sharply from 2026, in step with the money:
| Indicator | 2026 target | 2027 target |
|---|---|---|
| New classrooms constructed | 4,869 | 700 |
| New classrooms under construction | 0 | 5,887 |
| Textbooks and learning materials procured | 135,614,186 | 25,996,563 |
| Newly created teaching positions filled | 32,916 | 0 |
| Learners in the School-Based Feeding Program | 3,002,284 | 3,699,423 |
| Grantees of Educational Service Contracting | 989,471 | 947,059 |
| Grantees of the Senior High School Voucher | 1,475,264 | 1,259,234 |
| Teachers and teaching-related staff trained | 486,967 | 486,967 |
| Grade 6 learners at least nearly proficient in the NAT | 67% | 67% |
| Grade 10 learners at least nearly proficient in the NAT | 50% | 50% |
| Grade 12 learners at least nearly proficient in the NAT | 28% | 28% |
Table: NEP FY 2027, Volume I, Department of Education, Performance Information, pp. 599-600. The NAT targets are for SY 2025-2026 (2026) and SY 2026-2027 (2027).
A target is not a result. The NEP’s own accomplishment table for 2025 shows how far apart they can be: 6,000 new classrooms targeted and 99 constructed; 20,000 newly created teaching positions to be filled and 18,684 filled (p. 598).
The conditions that come with the money
The special provisions in the NEP set rules for how DepEd uses its 2027 money. The ones a school head is most likely to meet:
| Provision | What it says |
|---|---|
| 1 and 2. Revolving funds of national elementary and secondary schools | Income from fees, charges and assessments may augment the school’s instructional programs and MOOE; income from manufacturing and production programs may cover those programs’ costs, scholarships of learners in them, and student loans. Spending in violation is void. |
| 4. Quick Response Fund | A stand-by fund to replace, rebuild or repair school buildings after calamities in the last quarter of the previous year or the current year; never for pre-disaster activities such as training or insurance. |
| 5. Basic Education Facilities | ₱30,551,016,000 for building, replacing, repairing and completing school buildings in eight components, from low-rise buildings and Last Mile Schools to ALS Community Learning Centers. |
| 7. Special Hardship Allowance | 25% of the basic monthly salary, for personnel in hardship posts, multigrade schools and ALS areas; never under two categories at once. |
| 8. Teaching Allowance | ₱10,000 for each qualified public school teacher, for teaching supplies and incidental expenses. |
| 9. Teaching Overload | Honoraria only for teachers whose actual classroom teaching exceeds six hours a day. |
| 10. Creation of Teaching Positions | Positions created against the EBEIS and LIS standards as of SY 2026-2027; teachers chosen from the Registry of Qualified Applicants; vacancies posted on each SDO’s website; appointments posted for at least 15 calendar days. |
| 11. Filling of Vacant Positions | Take all appropriate measures to fill existing vacant teaching and non-teaching positions before December 31, 2027; quarterly reports to the Senate and House basic education committees. |
| 13. Learners with Disabilities | ₱100,000,000 for learning resources for learners with disabilities in the formal system and ALS. |
| 14. In-Service Training | ₱1,863,593,000 for training teachers, principals and other school personnel. |
| 17. School-Based Non-Teaching Positions | Non-teaching positions created against standards DepEd and DBM agree on, requested with a deployment report before the school year. |
| 18. School-Based Feeding Program | Food for all incoming kindergarten learners; wasted, severely wasted, stunted and severely stunted learners in Grades 1 to 6; pupils at risk of dropping out; Indigenous Peoples learners; and learners from indigent families. Up to 1.5% of the cost may pay for related costs such as cooking and eating utensils, delivery, monitoring software, minor kitchen repairs and administration. |
Table: NEP FY 2027, Volume I, Department of Education, Special Provisions, pp. 345-349. The provisions are the President’s proposal; Congress may change them in the General Appropriations Act. House Bill No. 10858 changes Provisions 5 and 16 and adds two (see “Where the proposal stands in Congress”).
Where the proposal stands in Congress
The NEP is the President’s proposal. Congress changes it before it becomes the General Appropriations Act (GAA). The House of Representatives passed its version, House Bill No. 10858, on third reading on October 12, 2026. It gives the Office of the Secretary ₱908,073,975,000 in new appropriations, ₱6,170,775,000 less than the NEP:
| Program | NEP | House Bill No. 10858 | Change |
|---|---|---|---|
| Basic Education Inputs (without foreign-assisted projects) | ₱80,535,869,000 | ₱74,276,869,000 | −₱6,259,000,000 |
| Foreign-assisted projects | ₱13,694,399,000 | ₱11,350,399,000 | −₱2,344,000,000 |
| Education Human Resource Development (without foreign-assisted projects) | ₱3,017,970,000 | ₱2,517,970,000 | −₱500,000,000 |
| Support to Schools and Learners (without foreign-assisted projects) | ₱763,602,626,000 | ₱766,034,851,000 | +₱2,432,225,000 |
| Education Policy Development | ₱13,525,792,000 | ₱13,875,792,000 | +₱350,000,000 |
| Inclusive Education | ₱5,360,270,000 | ₱5,510,270,000 | +₱150,000,000 |
| General Administration and Support, and Support to Operations | ₱34,507,824,000 | ₱34,507,824,000 | No change |
Table: NEP FY 2027 data; House Bill No. 10858, third reading, Volume I-A, Department of Education.
The House changed MOOE and capital outlays only. Personnel services are the same in both versions, program by program, so the House version leaves the money for DepEd’s positions as the NEP proposed it. Its changes for schools:
- A new Academic Recovery and Accessible Learning (ARAL) Program line of ₱350,000,000 at the Central Office, the whole Education Policy Development increase, with a new Special Provision 20 for learning recovery programs.
- Less for buildings and computers. Basic Education Facilities falls to ₱27,453,016,000 (Special Provision 5) and the Computerization Program to ₱2,626,584,000, against ₱30,551,016,000 and ₱5,787,584,000 in the NEP.
- More for vouchers and subsidies. Government Assistance and Subsidies rises to ₱40,054,719,000 (Special Provision 16), against ₱38,122,494,000.
- A new Special Provision 19 lets DepEd engage security services for schools.
In the Senate, the Finance Committee approved DepEd’s budget on October 16, 2026. At that hearing DepEd asked for ₱147.93 billion more, including ₱15.63 billion for the ARAL Program, which has no line of its own in the NEP; DBM says ARAL is funded under textbooks and instructional materials (GMA News, October 16, 2026). The House and Senate versions are reconciled in a bicameral conference before the President signs the GAA.
What this means for school heads
- Plan at the FY 2026 amount until DepEd issues its FY 2027 allocation list. The NEP line repeats the FY 2026 amount, but DepEd says it will allocate 2027 MOOE under its Simplified Normative Funding Formula, with higher per-learner rates. Check the school’s line in the finder above, keep the FY 2026 allocation list beside the school improvement plan’s annual implementation plan, and update the plan when the FY 2027 list comes out.
- Know which route your school’s money takes. An implementing unit receives its allotment directly, and the printed NEP names every FY 2026 implementing unit; the money of a non-implementing school sits in the division office’s line and reaches the school as a cash advance that it liquidates (how each route works).
- Expect few new positions. DepEd’s own lines fill teaching positions already created and add counselors, and the Budget Message adds 1,000 School Principal I positions. A school short of teachers should press for the filling of existing vacancies (Special Provision 11).
- Read the provisions that touch your staff. Hardship allowance (25% of basic monthly salary, one category only), teaching overload pay (beyond six hours a day of actual teaching), and the ₱10,000 teaching allowance each have their rule in the special provisions.
- Watch the GAA, not only the NEP. Congress may still move money between programs. The House version already takes ₱6.26 billion from school buildings and computers, adds ₱350 million for the ARAL Program, and raises Government Assistance and Subsidies.
- Use the budget to ground the school’s plans in evidence. Managing school finances is part of the PPSSH domain on managing school operations and resources: a school head who can read the division’s line, the school’s line and the special provisions can explain to the School Governance Council and stakeholders what the school will and will not receive.
Frequently asked questions
How much is DepEd’s budget for 2027?
The President’s proposal gives DepEd ₱975,962,852,000: ₱973,401,129,000 for the Office of the Secretary and ₱2,561,723,000 for six attached agencies. The Office of the Secretary’s new appropriations are ₱914,244,750,000, against ₱958,696,109,000 for 2026 (NEP FY 2027, Volume I, p. 343). The House version cuts the new appropriations to ₱908,073,975,000 (House Bill No. 10858).
Will my school’s MOOE increase in 2027?
In the NEP, almost every high school’s MOOE line equals its FY 2026 allocation to the peso (DBM, NEP FY 2027 data; DepEd, School MOOE Allocation, FY 2026). But DepEd says it will allocate 2027 school MOOE under its Simplified Normative Funding Formula, with per-learner rates of ₱2,982 for elementary, ₱2,744 for junior high and ₱3,558 for senior high, against ₱2,792, ₱2,631 and ₱3,264 in 2026, so a school’s amount is the one in DepEd’s FY 2027 allocation list (Daily Tribune, September 24, 2026). Congress may still change the total.
How many new teachers and principals does the 2027 budget fund?
DepEd’s own lines pay to fill 64,530 teaching positions already created and create 2,021 counselor positions; the NEP’s target for newly created teaching positions filled in 2027 is zero (NEP FY 2027, p. 600; President’s Budget Message, p. 19). The Budget Message adds 1,000 new School Principal I positions, which no line of DepEd’s chapter carries (p. 20). DepEd had asked for 14,274 more teaching positions (DepEd-DBM joint statement, September 10, 2026) and 14,126 School Principal I positions (Philippine Daily Inquirer, September 8, 2026).
Where can I see my school’s 2027 budget?
Use the finder in “Find your region, division or school”: type part of the school’s name. A school with junior or senior high has its own lines in DBM’s NEP data; an elementary school’s money is in its division’s elementary line. The full list of 11,001 schools is in the schools CSV under “Download the data”, and DBM’s own data file is linked in Sources (DBM, NEP FY 2027 data). The NEP line is the proposal’s; the amount a school receives in 2027 is in DepEd’s FY 2027 School MOOE allocation list.
Is the NEP the final budget?
No. The NEP is the President’s proposal to Congress. The House passed its version on October 12, 2026 (Philippine Star, October 13, 2026), and the Senate passes its own; both are reconciled in a bicameral conference, and the budget takes effect when the President signs the General Appropriations Act.
Download the data
- Regions (CSV): each region’s 2027 lines by expense class, its learners in SY 2025-2026, and the amount per learner. Source: DBM, NEP FY 2027 data; DepEd enrollment.
- Divisions (CSV): all 221 divisions’ 2027 lines by level and expense class, the division office’s and the schools’ shares, learners, per-learner amounts, ranks among 218, and the ratio to the size line. Source: DBM, NEP FY 2027 data; DepEd enrollment.
- Schools (CSV): the 11,001 schools with lines of their own, their junior and senior high lines, their DepEd school ID, whether the printed NEP names them, their FY 2026 MOOE, and their learners. Source: DBM, NEP FY 2027 data; DepEd, School MOOE Allocation, FY 2026; DepEd enrollment.
- Programs and activities (CSV): every program, activity and project of the Office of the Secretary, with personnel services, MOOE, capital outlays, premiums, loan proceeds and GOP counterpart. Source: DBM, NEP FY 2027 data.
- Positions (CSV): the personnel and position figures in the ledger, each with its source. Source: NEP FY 2027; President’s Budget Message; DBM and DepEd statements.
- Staffing (CSV): DepEd’s key positions by title, and its position totals, 2025 to 2027. Source: DBM, Staffing Summary FY 2027.
The CSVs and charts may be reused only with written permission: email support@nash.com.ph. The budget figures themselves come from DBM’s published NEP, which you can cite directly. The enrollment data are DepEd’s, released in cleaned form in Download Cleaned DepEd School Data.
Sources
Budget documents (Department of Budget and Management)
- National Expenditure Program FY 2027, Volume I, Department of Education, pp. 343-636: Appropriations and Obligations, Expenditure Program, Staffing Summary, Regional Allocation, Special Provisions, New Appropriations by Programs, Activities and Projects, Obligations by Object of Expenditures, Performance Information, and the attached agencies.
- National Expenditure Program FY 2027, data (NEP-FY2027.xlsx), from DBM’s NEP FY 2027 page: every line of the Department of Education by program, operating unit, region, division and object of expenditure.
- National Expenditure Program FY 2027, Miscellaneous Personnel Benefits Fund, Volume III, p. 944, Special Provision 1.
- The President’s Budget Message FY 2027, pp. 19-20.
- Staffing Summary FY 2027, Department of Education, p. 29.
- DBM news release, “Teachers at center of nearly P1-T DepEd budget in 2027”, September 5, 2026.
- DBM news release on the Sulu transition plan, February 9, 2026.
Congress
- House of Representatives, House Bill No. 10858, the General Appropriations Bill for FY 2027, as approved on third reading (October 12, 2026), Volume I-A, Department of Education, Office of the Secretary.
Other issuances
- Executive Order No. 64, s. 2024, which grants the medical allowance from 2025.
DepEd data
- DepEd, School MOOE Allocation, FY 2026: each school’s MOOE by level, its organization code, and whether it is an implementing unit.
- DepEd, enrollment by school, SY 2025-2026 (public schools DepEd manages, outside BARMM), as released in Download Cleaned DepEd School Data.
Statements and reports
- DepEd-DBM joint statement, September 10, 2026, as reported by SunStar and the Daily Tribune.
- DepEd at the Senate Finance Committee hearing on its 2027 budget, October 16, 2026, as reported by GMA News, on principals and counselors and on the committee’s approval.
- DepEd’s budget requests to Congress, as reported by the Philippine Daily Inquirer, September 8, 2026.
- DepEd on its proposed 2027 school MOOE and the Simplified Normative Funding Formula, as reported by the Daily Tribune, September 24, 2026.
- EDCOM 2, “Only 3,000 new principal posts funded so far in 2027 despite 26k shortage”, November 12, 2026.
- House of Representatives, third reading of House Bill No. 10858, October 12, 2026, as reported by the Philippine Star.
Written by Mark Anthony Llego for NASH Reviewer. Sources: NEP FY 2027 (DBM), the President’s Budget Message FY 2027, DBM’s Staffing Summary FY 2027, House Bill No. 10858, DepEd’s School MOOE Allocation FY 2026 and enrollment data for SY 2025-2026. Charts may be reused only with written permission from support@nash.com.ph.