The Department of Education (DepEd) judges how well schools keep learners with a short list of performance indicators: the enrollment rate, the cohort survival rate, the completion rate, the school leaver and dropout rates, the repetition and promotion rates, and the retention and transition rates. DepEd Order No. 52, s. 2016 defines them, and the Basic Education Development Plan 2030 (BEDP), adopted through DepEd Order No. 024, s. 2022, and the Quality Basic Education Development Plan 2025-2035 (Q-BEDP) set targets for several of them, including the completion rate; neither sets one for cohort survival. The Q-BEDP’s latest baseline, for SY 2023-2024, puts completion at 92% in elementary, 82% in junior high and 73% in senior high.
DepEd’s public school-level files cannot reproduce those rates, because they report enrollment by grade but not repeaters, leavers, graduates or population. They can show something close: how a grade’s enrollment compares with the enrollment of the same cohort years earlier. Across the Philippines, Grade 6 enrollment from SY 2022-2023 to SY 2025-2026 equaled 94.7% of Grade 1 enrollment five years before, and Grade 10 enrollment equaled 91.4% of Grade 7 enrollment three years before. In the 175 divisions whose boundaries and schools did not change, the junior high figure runs from 70.2% in Basilan to 100.8% in Iloilo City.
These are apparent ratios, not DepEd’s rates. The enrollment trends behind them are in DepEd Enrollment Trends SY 2017-2018 to SY 2025-2026, and each statistic is explained in the guide to reading DepEd data.
Key findings
- DepEd defines ten-odd indicators of access and internal efficiency. They include the cohort survival rate, “Percentage of enrolees at the beginning grade or year in a given school year who reached the final grade”, and the completion rate, “Percentage of grade/year 1 entrants who graduate” (DO 52, s. 2016, Performance Indicators).
- The official targets are high. The Q-BEDP aims to raise completion from 92% to 100% in elementary, 82% to 100% in junior high and 73% to 100% in senior high by its third basecamp in 2034 (Q-BEDP, Annex 6).
- Apparent cohort survival is higher in elementary than in junior high. Grade 6 enrollment equaled 94.7% of the Grade 1 cohorts five years earlier, and Grade 10 equaled 91.4% of the Grade 7 cohorts three years earlier, for cohorts finishing SY 2022-2023 to SY 2025-2026 (DepEd enrollment files, all sectors).
- Junior high is where enrollment falls between grades. From SY 2022-2023 to SY 2025-2026, each junior high grade kept 94.8% to 95.9% of the grade below it a year later, against 98.2% to 99.1% in elementary. Grade 12 kept 92.4% of Grade 11 (DepEd enrollment files, all sectors).
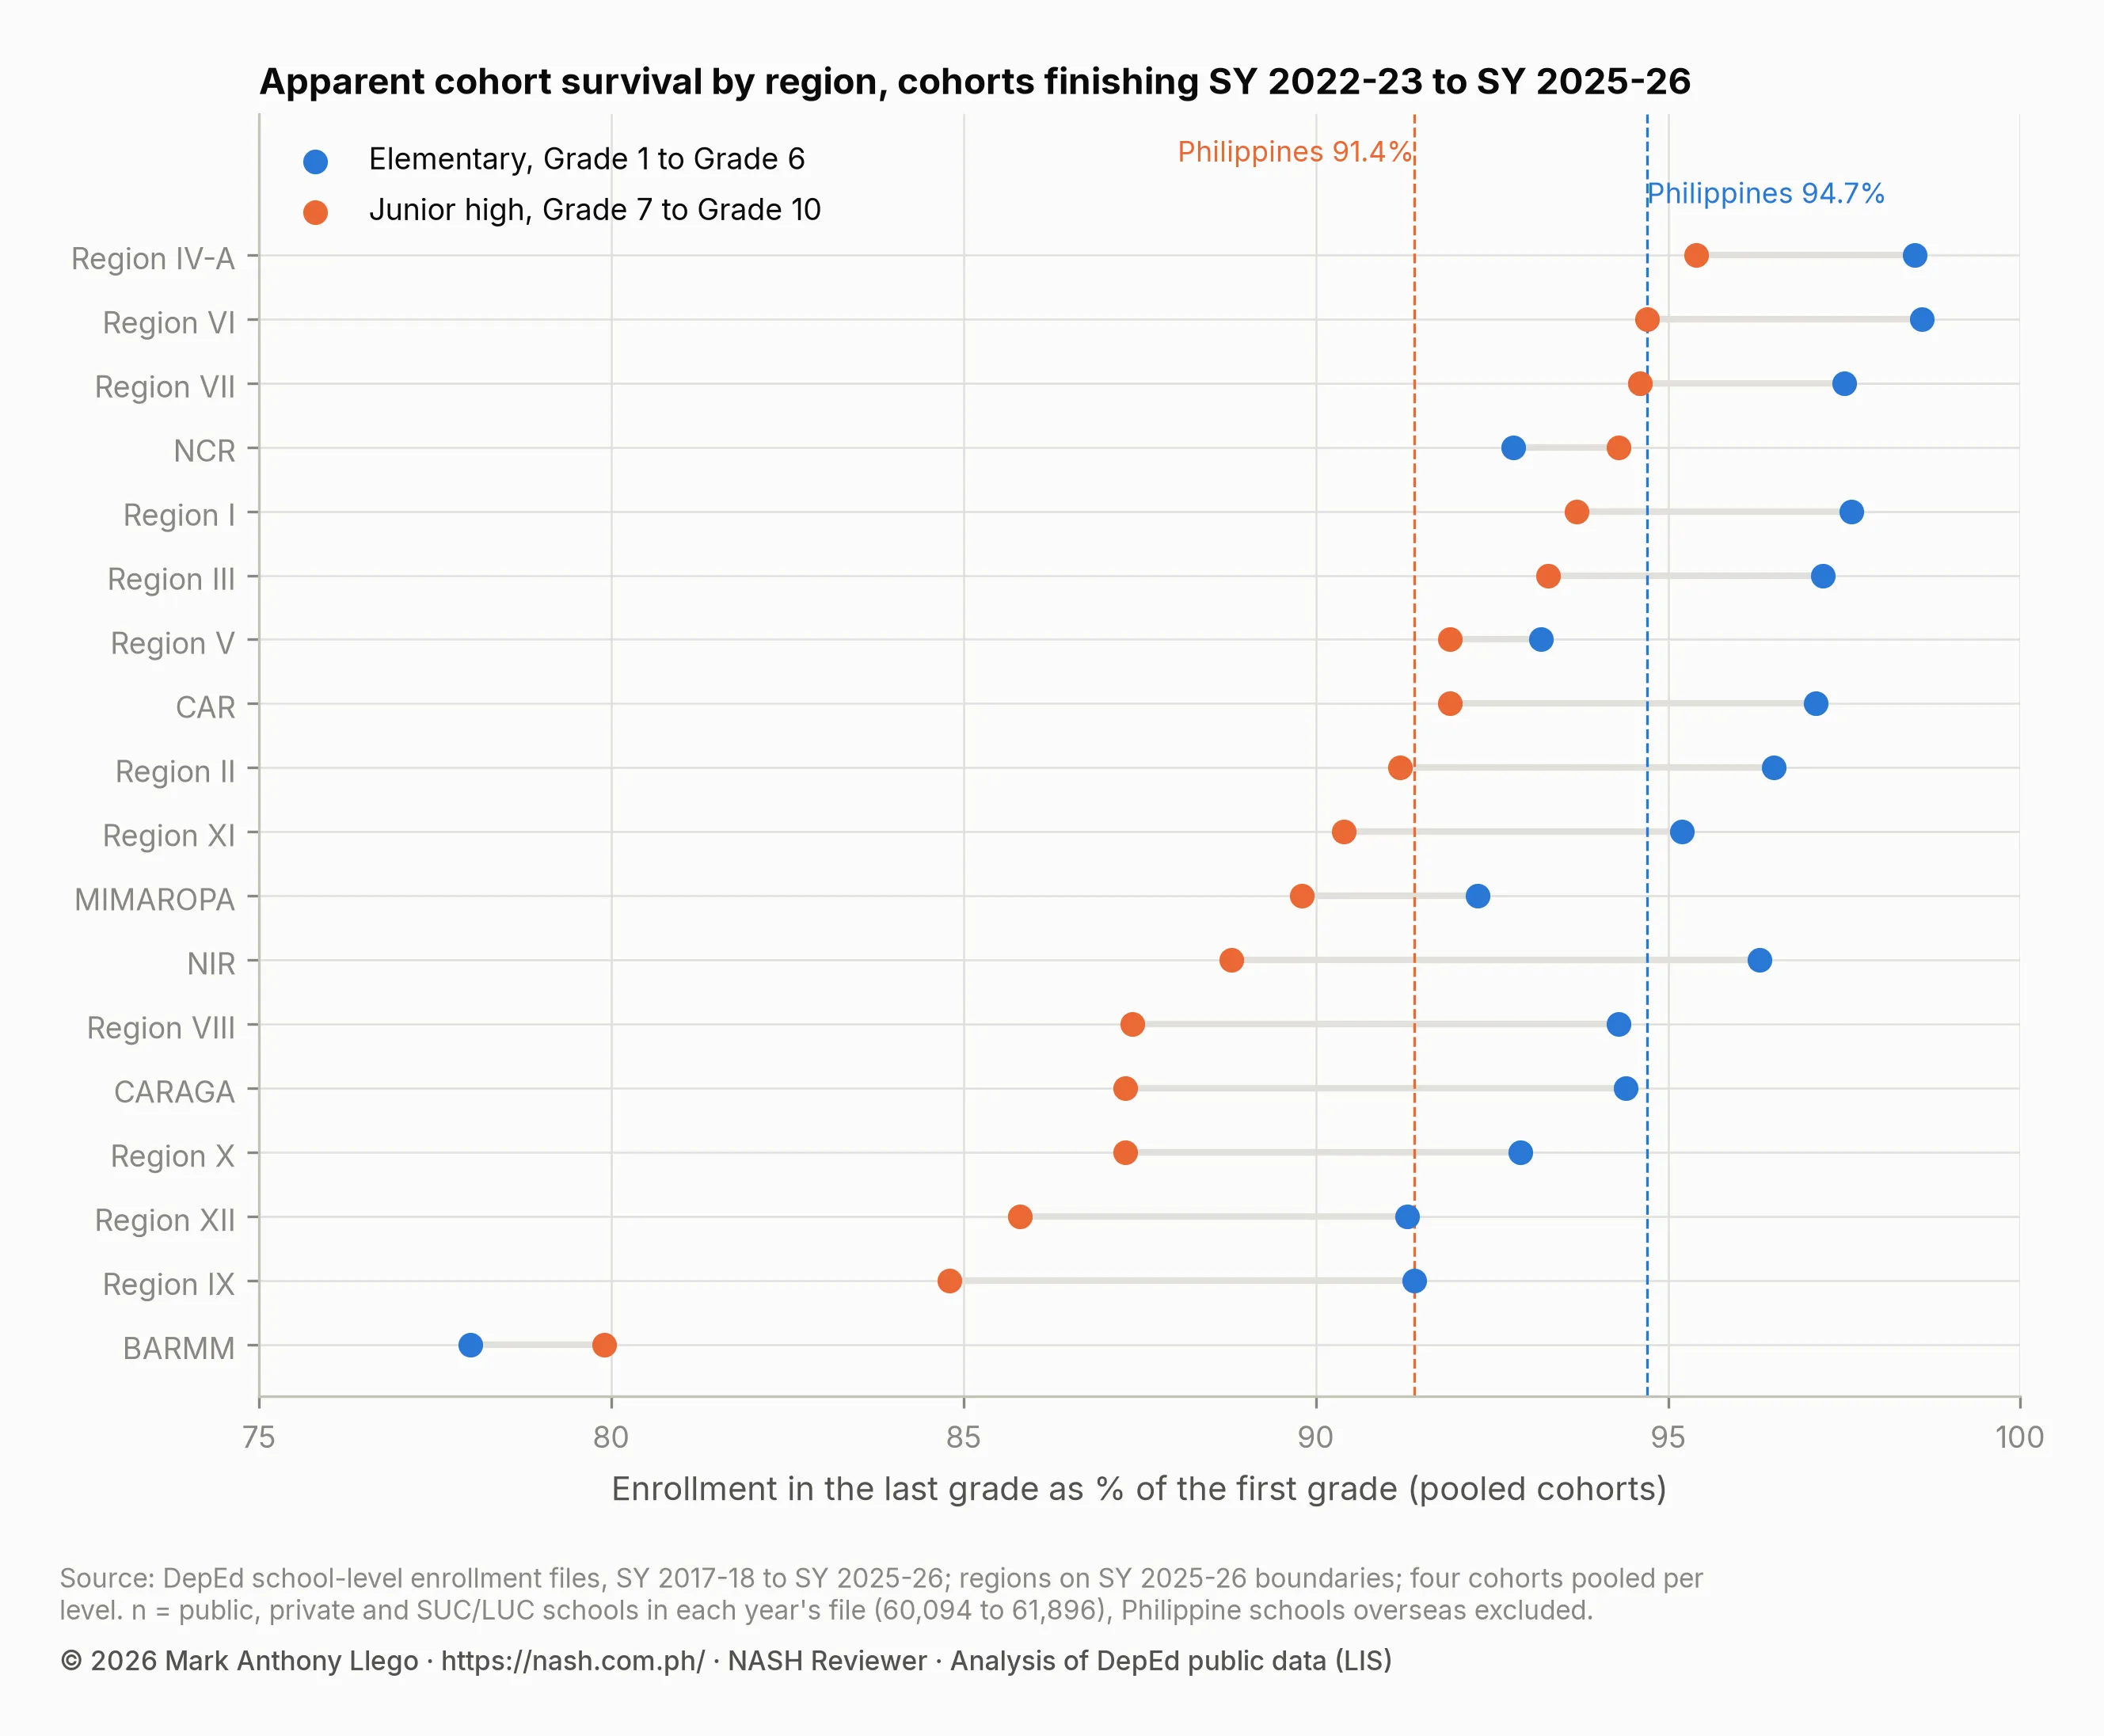
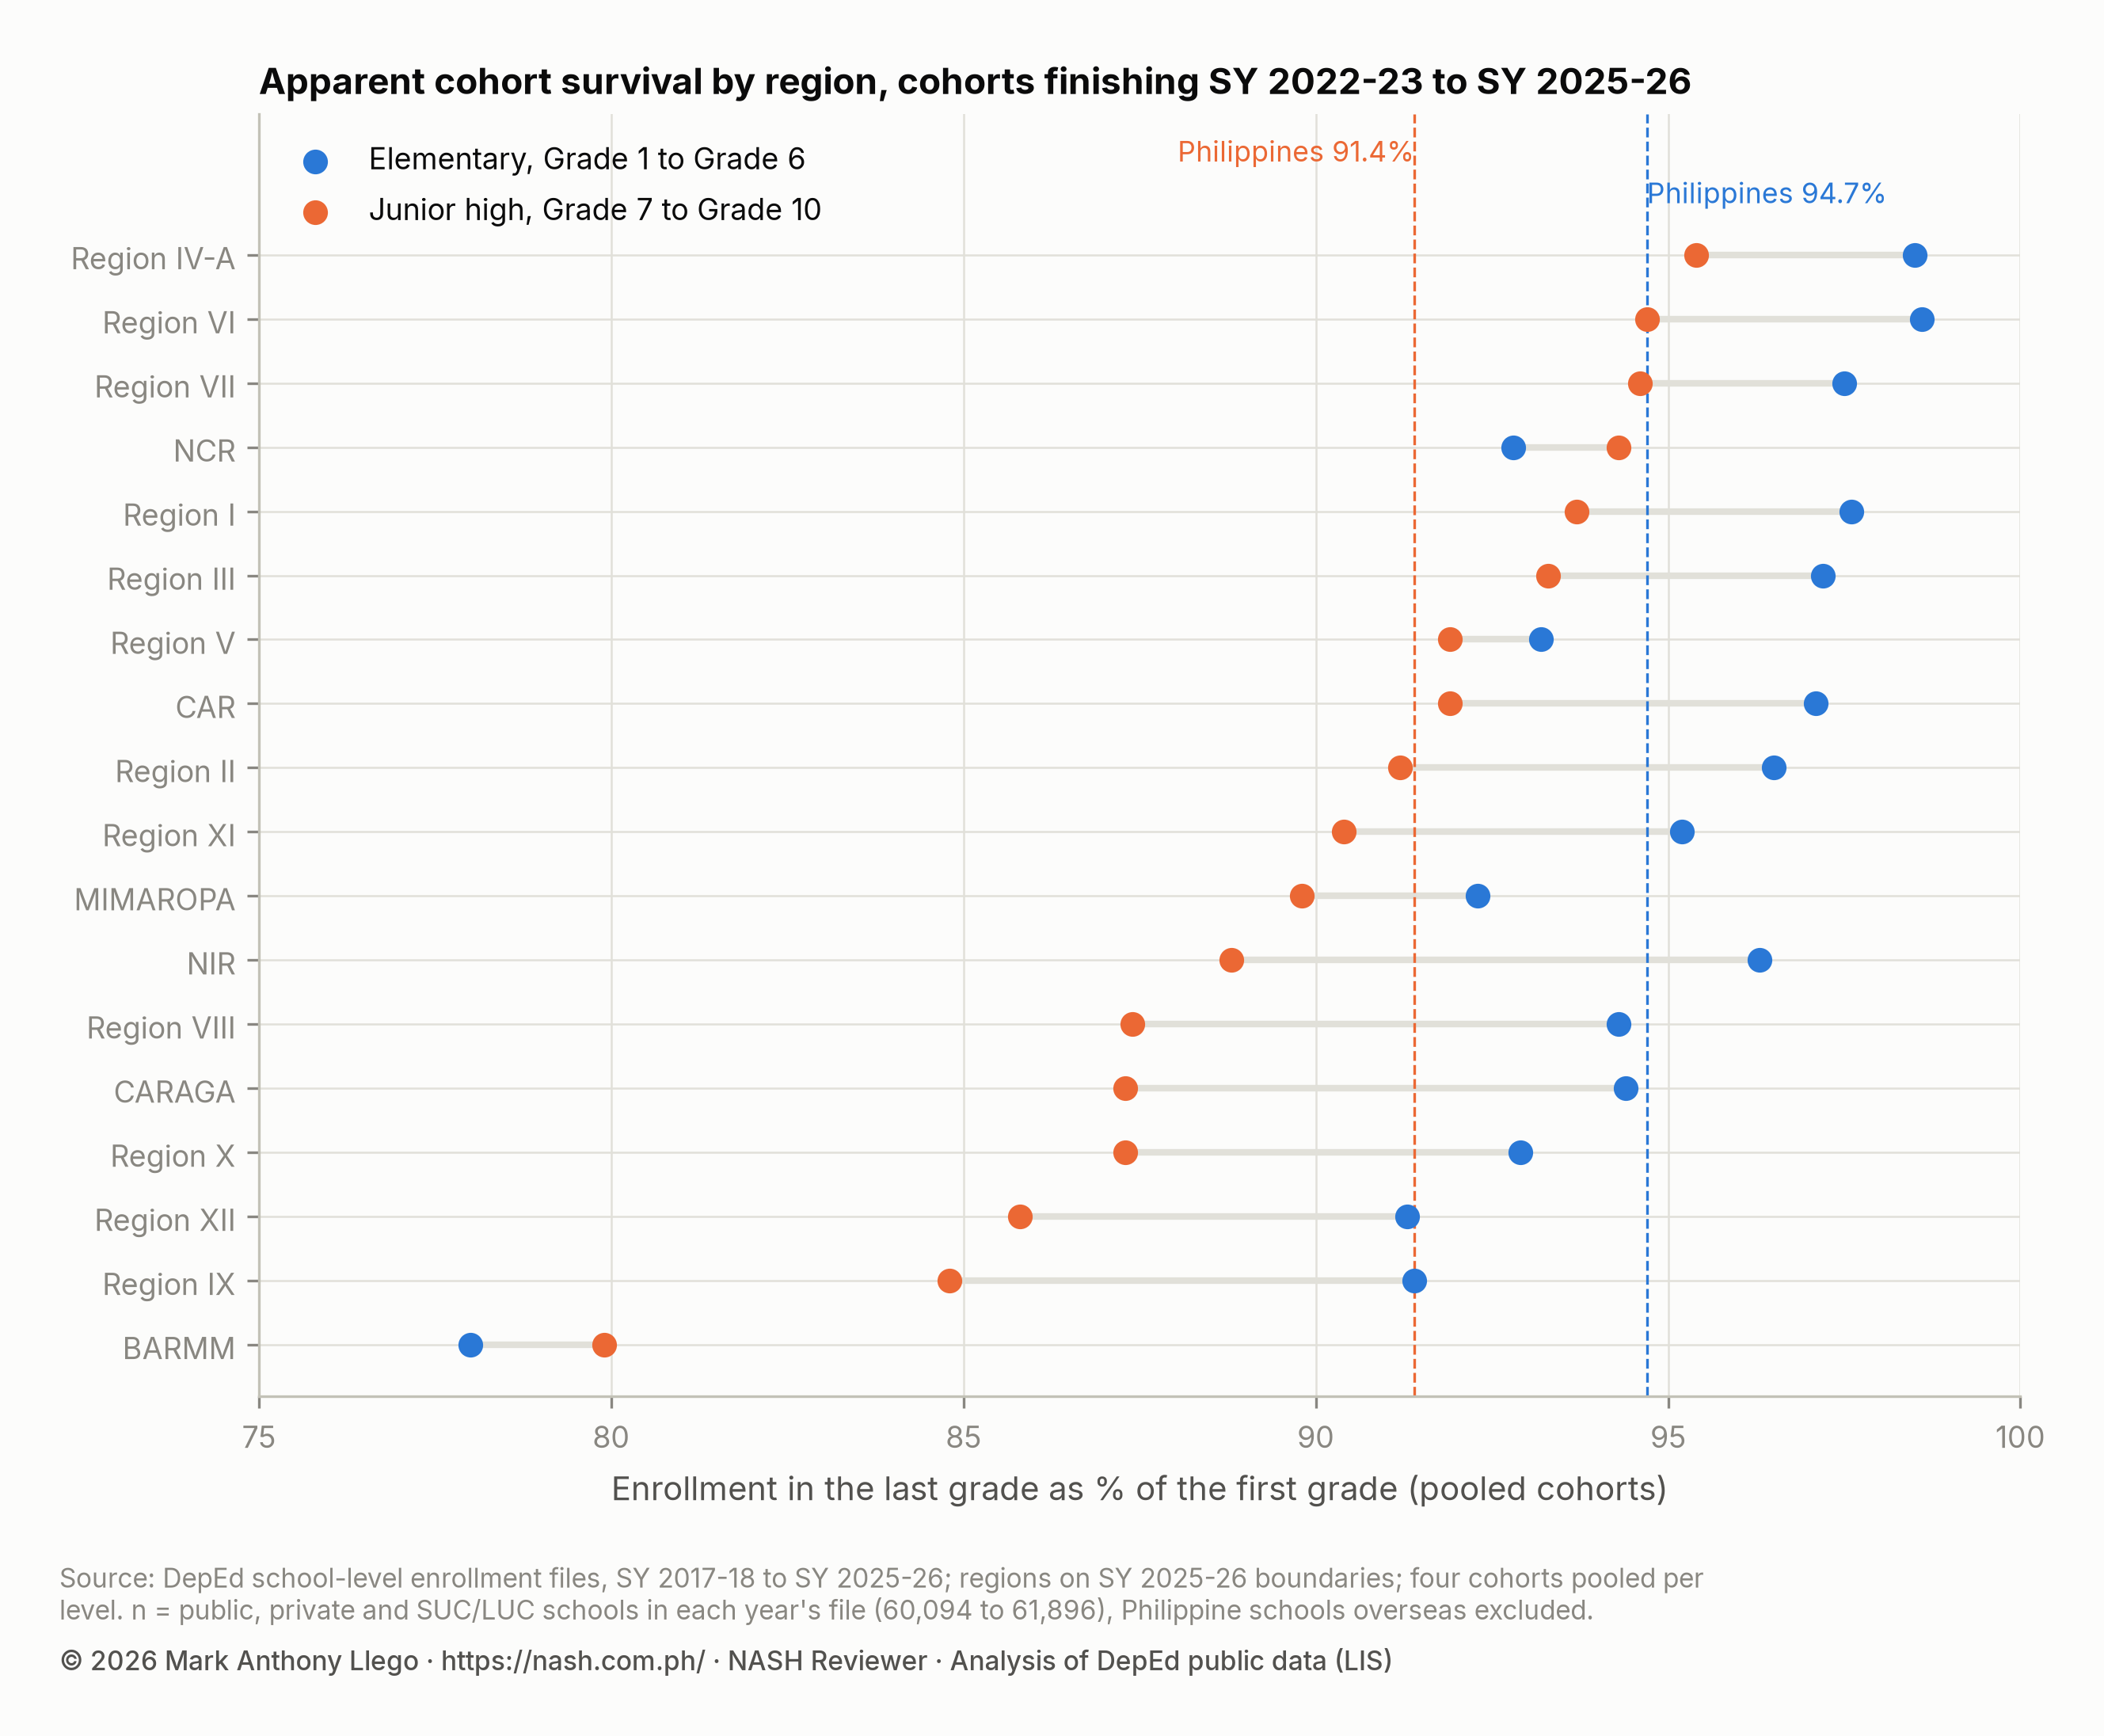
- BARMM is far below every other region. Its apparent survival is 78.0% in elementary and 79.9% in junior high; the next lowest are Region XII in elementary (91.3%) and Region IX in junior high (84.8%). The BEDP had already called BARMM “an outlier” in school leaving and completion (DepEd enrollment files; DO 024, s. 2022, Muslim Children and Youth).
- One division in three is below 90% in junior high. Of 175 divisions with stable boundaries, 60 kept less than 90% of their Grade 7 cohorts to Grade 10, including 11 in Eastern Visayas (Region VIII). In elementary, 17 were below 90% (DepEd enrollment files, all sectors).
- More than one Grade 5 learner in four had repeated a grade. In the 2024 Southeast Asia Primary Learning Metrics (SEA-PLM), “28% of Grade 5 students” had repeated a grade (EDCOM II Final Report, p. 150).
The performance indicators and how DepEd defines them
DO 52, s. 2016, which set the data collected in the Learner Information System (LIS) and the Enhanced Basic Education Information System (EBEIS), lists the “Performance Indicators” DepEd computes “for evaluating the educational system’s performance at various levels”. The main ones:
| Indicator | DepEd’s definition (DO 52, s. 2016) | What it needs |
|---|---|---|
| Gross enrollment rate | “Total enrolment in a given level of education, regardless of age, as a percentage of the population which according to national regulations should be enrolled at this level” | Enrollment and population by age |
| Net enrollment rate (participation rate) | “The ratio of the enrolment for the age group corresponding to the official school age in the elementary/ secondary level to the population of the same age group” | Enrollment by age and population |
| Cohort survival rate | “Percentage of enrolees at the beginning grade or year in a given school year who reached the final grade or year of elementary/ secondary level” | A cohort followed over the level |
| Completion rate | “Percentage of grade/year 1 entrants who graduate in elementary/secondary education” | Entrants and graduates |
| School leaver rate | Learners “who leave school during the year for any reason as well as those who complete the previous grade/year level but fail to the [sic] enrol in the next grade/year level the following school year”, as a share of the previous year’s enrollment | Leavers during and between years |
| Simple dropout rate | Learners “who do not finish a particular grade/year level”; it “does not capture” those who finish but do not enroll the next year | Leavers during the year |
| Repetition rate | “Proportion of pupils enrolled in a given grade in a given school-year who study in the same grade the following school-year” | Repeaters |
| Promotion rate | “the percentage of pupils/students promoted to the next grade/year level in the following school year” | Promotees |
| Retention rate | “The percentage of enrolees in the elementary/secondary level in a given school year who continue to be in school the following year” | Enrollment in two years |
| Transition rate | “The percentage of pupils who graduate from one level of education and move on to the next higher level” | Graduates and next-level entrants |
Two pairs are easy to confuse. The school leaver rate is wider than the simple dropout rate: it adds learners who finished a grade but did not come back the next school year. The cohort survival rate asks whether learners reached the last grade; the completion rate asks whether they graduated from it.
At the school level, the School Report Card of DepEd Order No. 44, s. 2015 reports two of these indicators to stakeholders: the “Number and rate of dropouts by cause” (item 7), drawn from School Forms 2 and 4, and the promotion rate (item 8), computed as the “Number of promoted learners over number of total learners x 100” from School Form 6 and EBEIS (Annex 11). The School Improvement Plan guide explains the report card.
The targets in the BEDP and the Q-BEDP
The BEDP set baselines for SY 2019-2020 and targets for two phases (DO 024, s. 2022, Tables 16 and 18):
| Indicator | Baseline, SY 2019-2020 | Phase 1 target (2022-2026) | Phase 2 target (2026-2030) |
|---|---|---|---|
| Net enrollment rate, elementary | 93.87% | 94.66% | 99% |
| Net enrollment rate, secondary | 83.27% | 91.13% | 98% |
| Retention rate, elementary | 98.94% | 98% | 98.50% |
| Retention rate, junior high | 94.63% | 96% | 97% |
| Dropout rate, elementary | 1.07% | 0% | 0% |
| Dropout rate, junior high | 2.42% | 0.63% | 0% |
| Dropout rate, senior high | 0.66% | 0% | 0% |
| Transition rate, Grade 6 to Grade 7 | 95.53% | 97% | 99% |
| Transition rate, Grade 10 to Grade 11 | 96.91% | 98% | 99% |
| Completion rate, elementary | 96.56% | 95% | 97% |
| Completion rate, secondary (Grade 12) | 76.71% | 86% | 90% |
The Q-BEDP, issued in July 2025, will “steer and begin to operationalize the BEDP (now extended to 2035 to better match the country’s demographic window of opportunity)” (p. 3). Its indicator list keeps two of these measures, with a SY 2023-2024 baseline and three “basecamps” in 2028, 2031 and 2034 (Annex 6):
| Indicator | Baseline, SY 2023-2024 | Basecamp 1 (2028) | Basecamp 2 (2031) | Basecamp 3 (2034) |
|---|---|---|---|---|
| Net enrollment rate, Kindergarten | 78% | 96% | 97% | 98% |
| Net enrollment rate, elementary | 86% | 89% | 92% | 97% |
| Net enrollment rate, junior high | 78% | 81% | 83% | 84% |
| Net enrollment rate, senior high | 67% | 69% | 71% | 71% |
| Completion rate, elementary | 92% | 96% | 98% | 100% |
| Completion rate, junior high | 82% | 88% | 94% | 100% |
| Completion rate, senior high | 73% | 84% | 92% | 100% |
The two plans use different baselines, so a change between them is not by itself a trend. The BEDP also traced a decade of improvement in internal efficiency: from SY 2009-2010 to SY 2019-2020, cohort survival rose from 74% to 97% in elementary and from 78% to 87% in junior high (DO 024, s. 2022, Table 6).
What the enrollment files can and cannot measure
DepEd’s school-level enrollment files for SY 2017-2018 to SY 2025-2026 give each school’s enrollment by grade and sex every year. They do not give learners’ ages, repeaters, leavers, graduates or the school-age population. So they cannot produce the enrollment rates, the completion rate, the school leaver rate or the repetition rate.
They can produce two ratios between grade totals:
- Apparent cohort survival: Grade 6 enrollment in a year divided by Grade 1 enrollment five years earlier, and Grade 10 enrollment divided by Grade 7 enrollment three years earlier.
- Apparent progression or transition: enrollment in a grade divided by enrollment in the grade below a year earlier, such as Grade 7 this year over Grade 6 last year.
These ratios count every learner in the later grade, including repeaters, late entrants, returning learners and transferees. A division that receives learners from elsewhere can pass 100%; one whose families move away can fall well below its true survival. They are therefore not DepEd’s cohort survival or transition rates. The figures below include public, private and state or local university schools, so that learners moving between public and private schools stay in the count. Philippine schools overseas are excluded.
Divisions need one more step. From SY 2017-2018 to SY 2025-2026, new city divisions were carved out of provinces and some schools moved between divisions. A ratio for a division whose territory changed compares different populations, so the division figures cover only the 175 divisions whose boundaries and schools stayed the same. Left out are 57: divisions created, abolished or redrawn in the period, divisions in a province where that happened, and divisions that sent or received schools with at least 1,000 learners in one year, such as Maguindanao I and II, between which 10 schools moved in SY 2023-2024.
Apparent cohort survival in the Philippines
| Cohort | First grade | Last grade | Ratio |
|---|---|---|---|
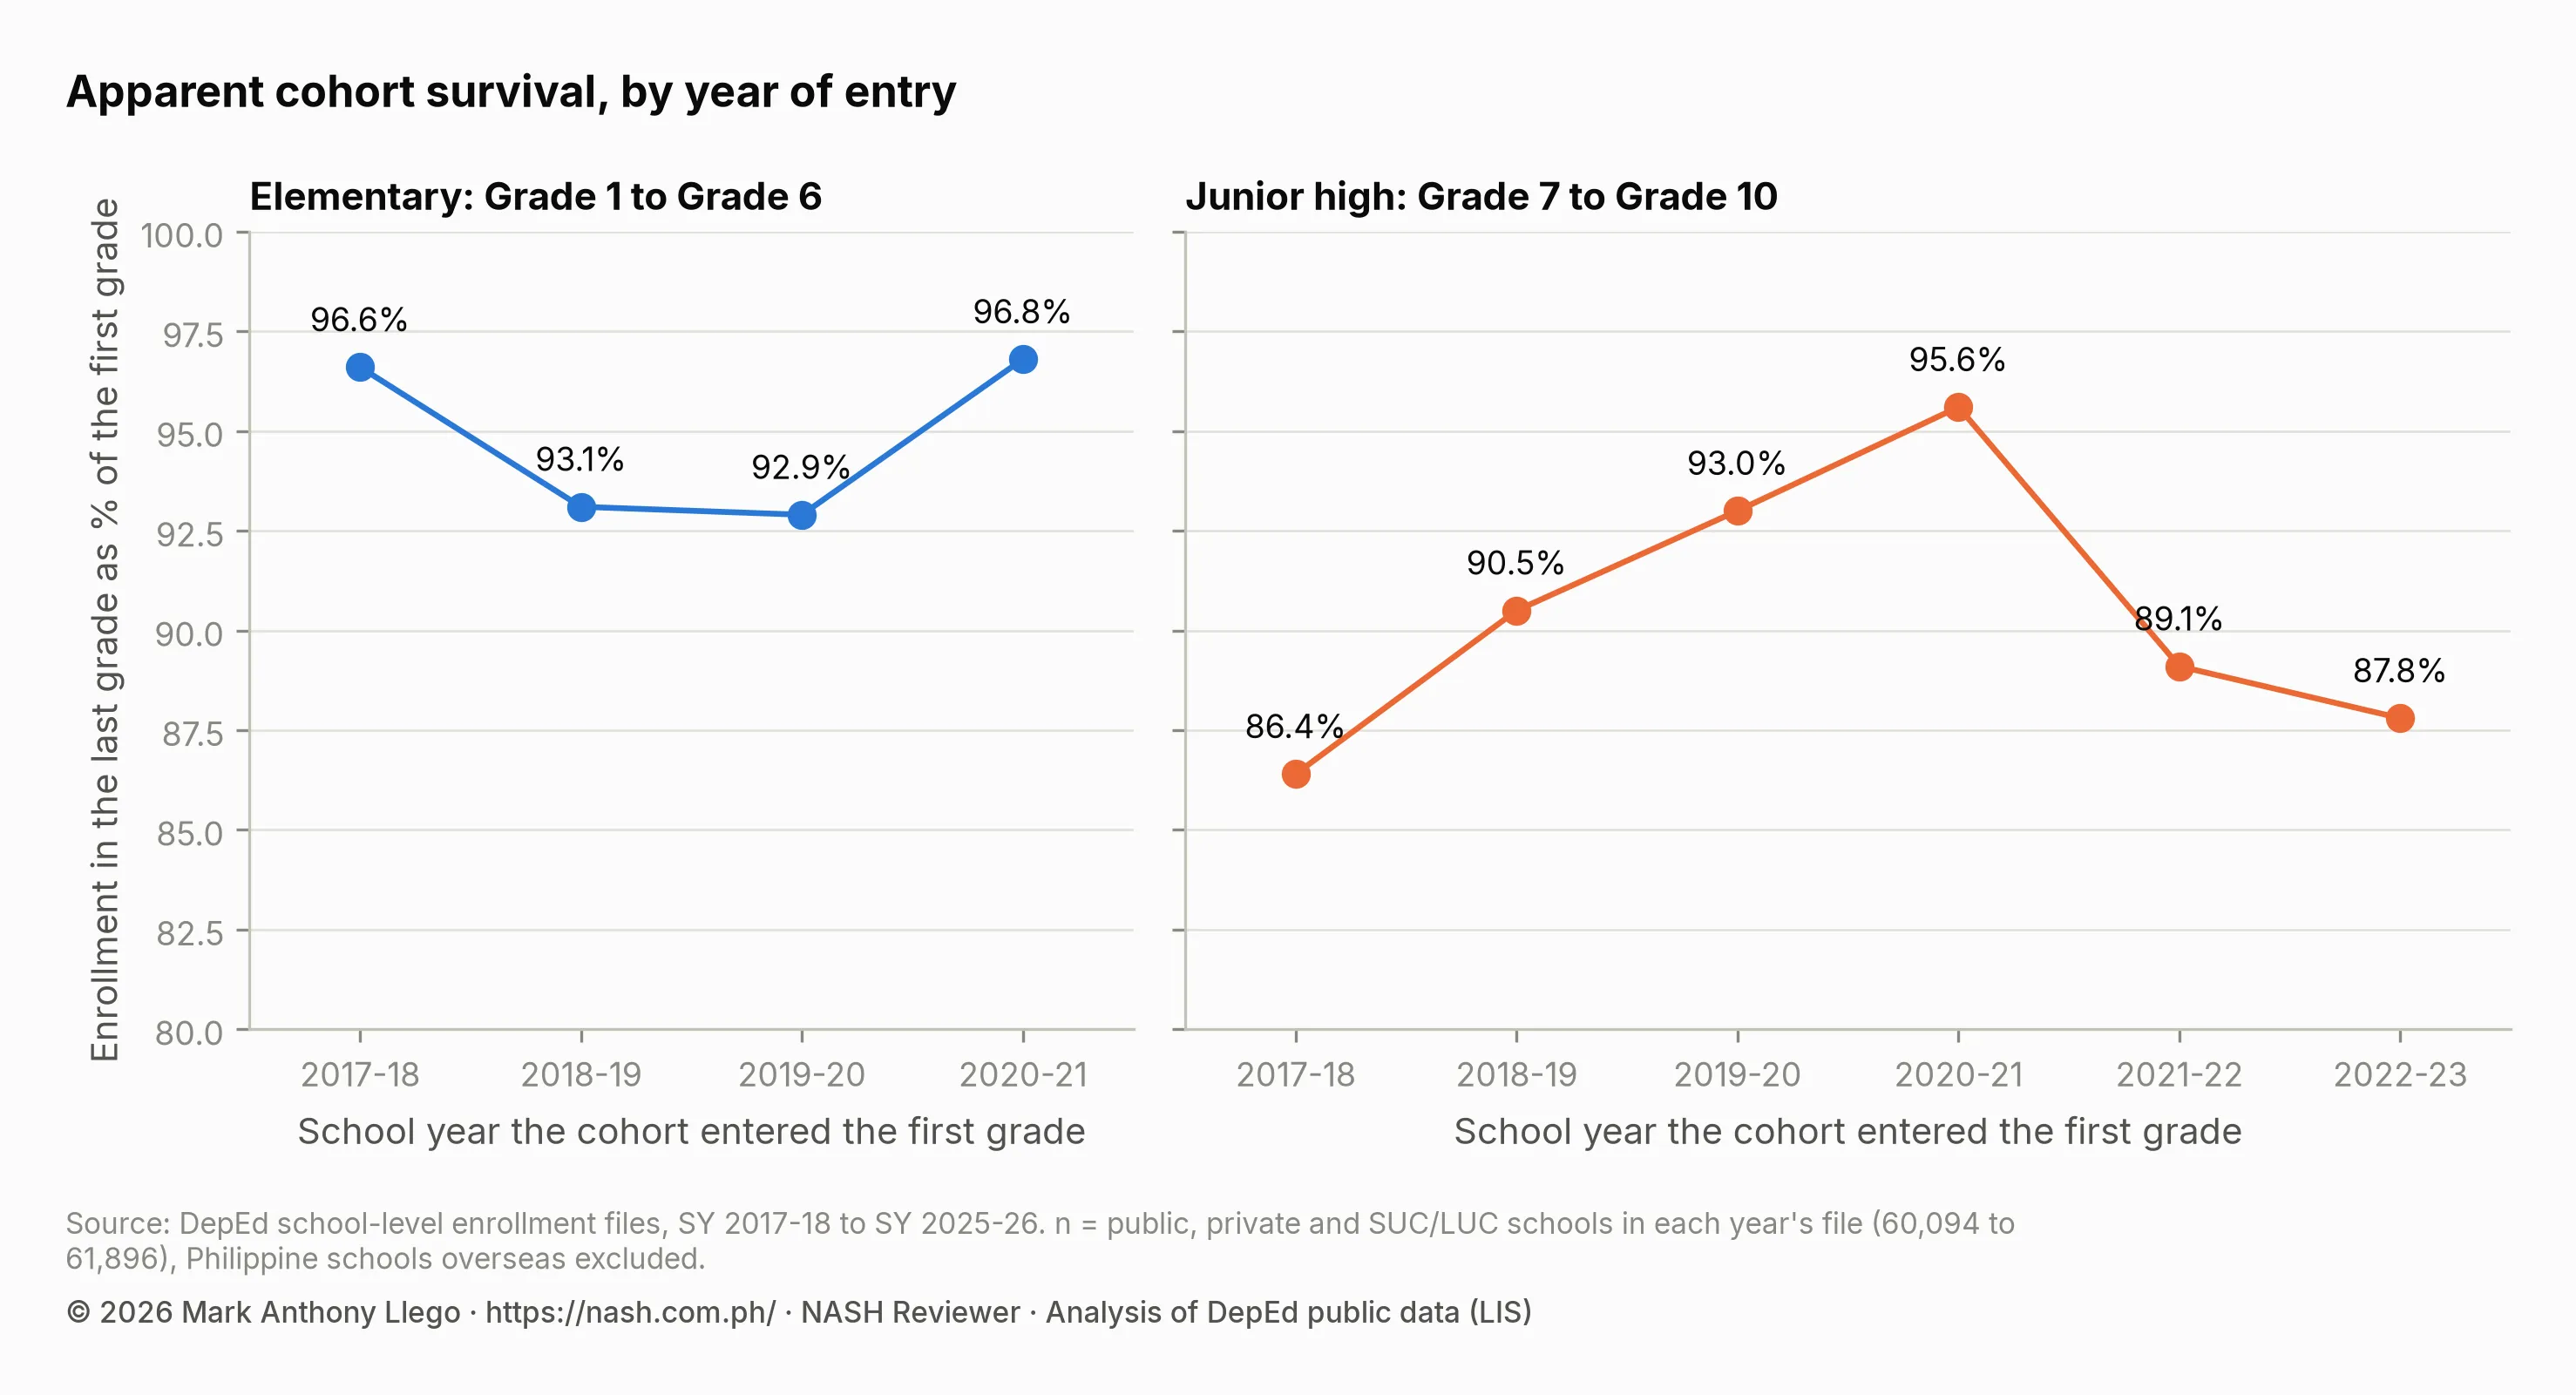
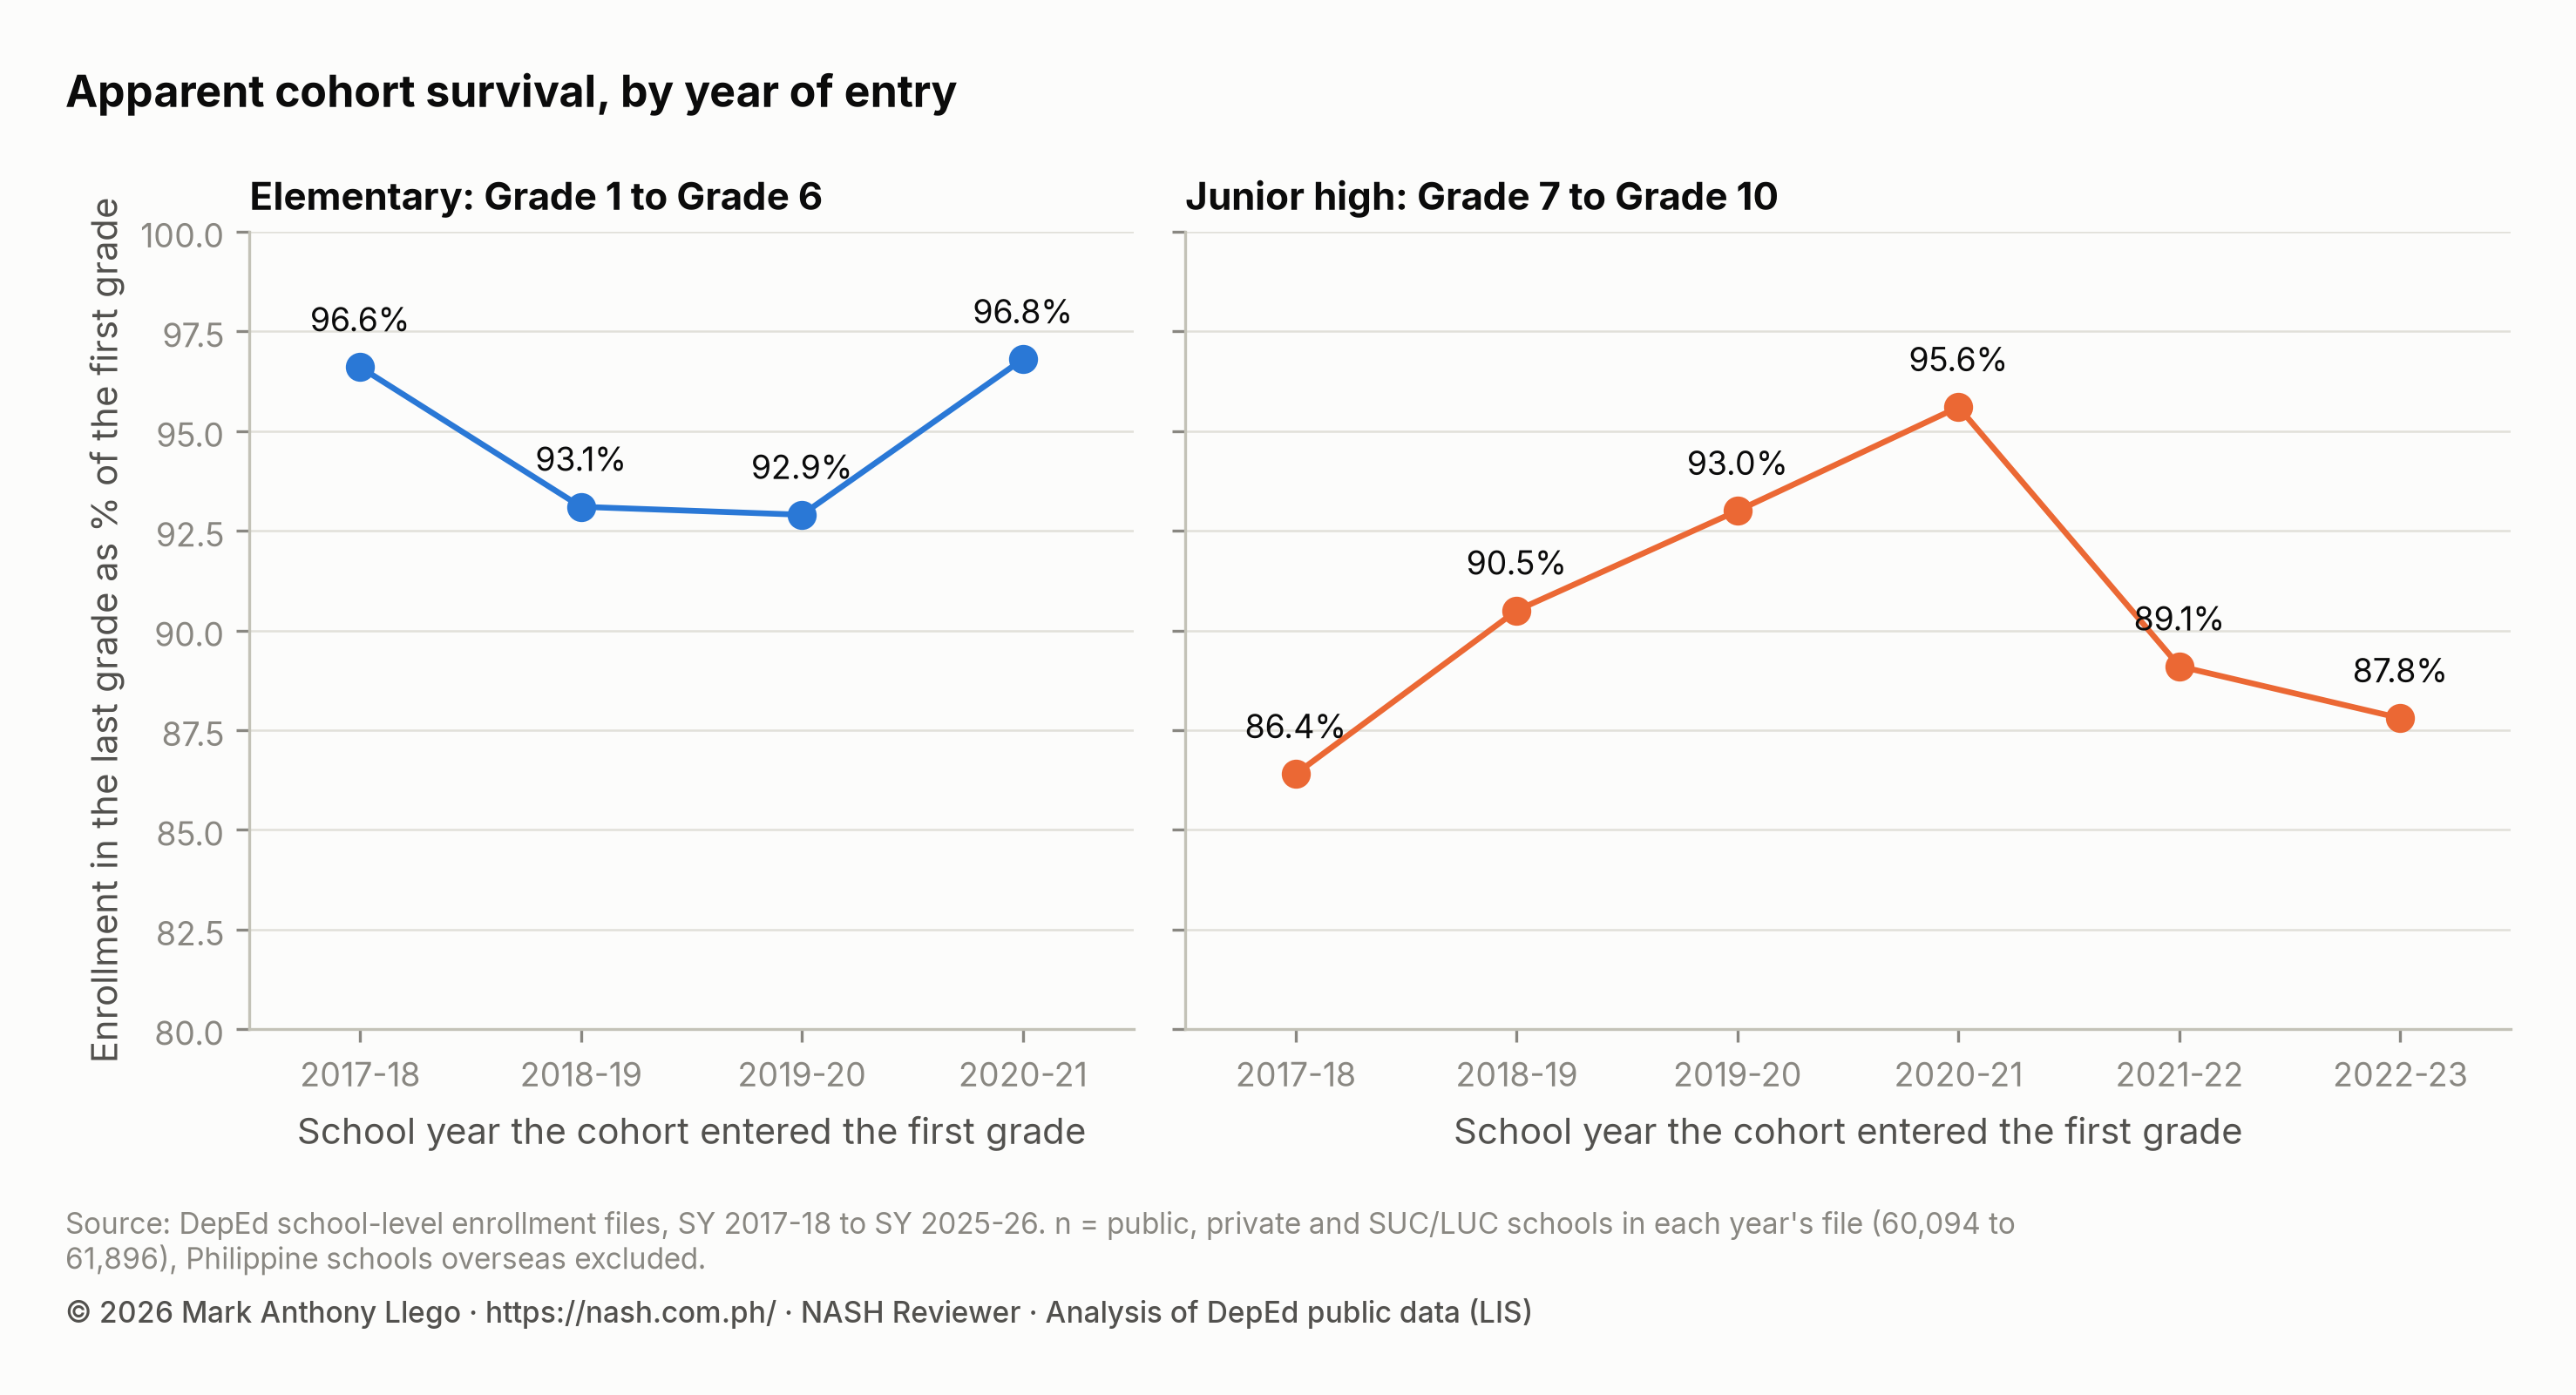
| Grade 1, SY 2017-18, to Grade 6, SY 2022-23 | 1,927,095 | 1,861,112 | 96.6% |
| Grade 1, SY 2018-19, to Grade 6, SY 2023-24 | 2,344,164 | 2,181,322 | 93.1% |
| Grade 1, SY 2019-20, to Grade 6, SY 2024-25 | 2,445,932 | 2,273,305 | 92.9% |
| Grade 1, SY 2020-21, to Grade 6, SY 2025-26 | 2,027,429 | 1,961,634 | 96.8% |
| Grade 7, SY 2017-18, to Grade 10, SY 2020-21 | 2,243,708 | 1,939,102 | 86.4% |
| Grade 7, SY 2018-19, to Grade 10, SY 2021-22 | 2,446,392 | 2,214,977 | 90.5% |
| Grade 7, SY 2019-20, to Grade 10, SY 2022-23 | 2,285,502 | 2,124,497 | 93.0% |
| Grade 7, SY 2020-21, to Grade 10, SY 2023-24 | 2,095,111 | 2,002,802 | 95.6% |
| Grade 7, SY 2021-22, to Grade 10, SY 2024-25 | 2,136,567 | 1,903,193 | 89.1% |
| Grade 7, SY 2022-23, to Grade 10, SY 2025-26 | 2,035,722 | 1,787,482 | 87.8% |
The size of the first grade moves the ratio. The SY 2020-2021 Grade 1 and Grade 7 classes, which enrolled at the start of the pandemic, were smaller than the classes before them, and both later show high ratios (96.8% and 95.6%). Learners who started late or returned later are counted in the last grade but were not in the small first grade, so these two cohorts probably look better than they were. The two most recent junior high cohorts, at 89.1% and 87.8%, are the lowest since the SY 2017-2018 entrants.
Public schools alone give different numbers. Counting only public schools, the elementary ratios run 95.3% to 99.4%, above the all-school figure for every cohort, and the junior high ratios 86.3% to 95.4%, higher than the all-school figure for cohorts that entered before SY 2020-2021 and lower for the three after. Moves between private and public schools during and after the pandemic would produce this pattern; the files do not record transfers.
The apparent figures sit near the official ones but are not the same measure. The Q-BEDP’s elementary completion baseline for SY 2023-2024 is 92%; the apparent survival of the Grade 1 class that reached Grade 6 that year is 93.1%. Its junior high completion baseline is 82%; the apparent survival of the Grade 7 class that reached Grade 10 that year, a pandemic-entry cohort, is 95.6%. Completion counts graduates, while the apparent ratio counts everyone enrolled in the last grade.
Where enrollment falls between grades
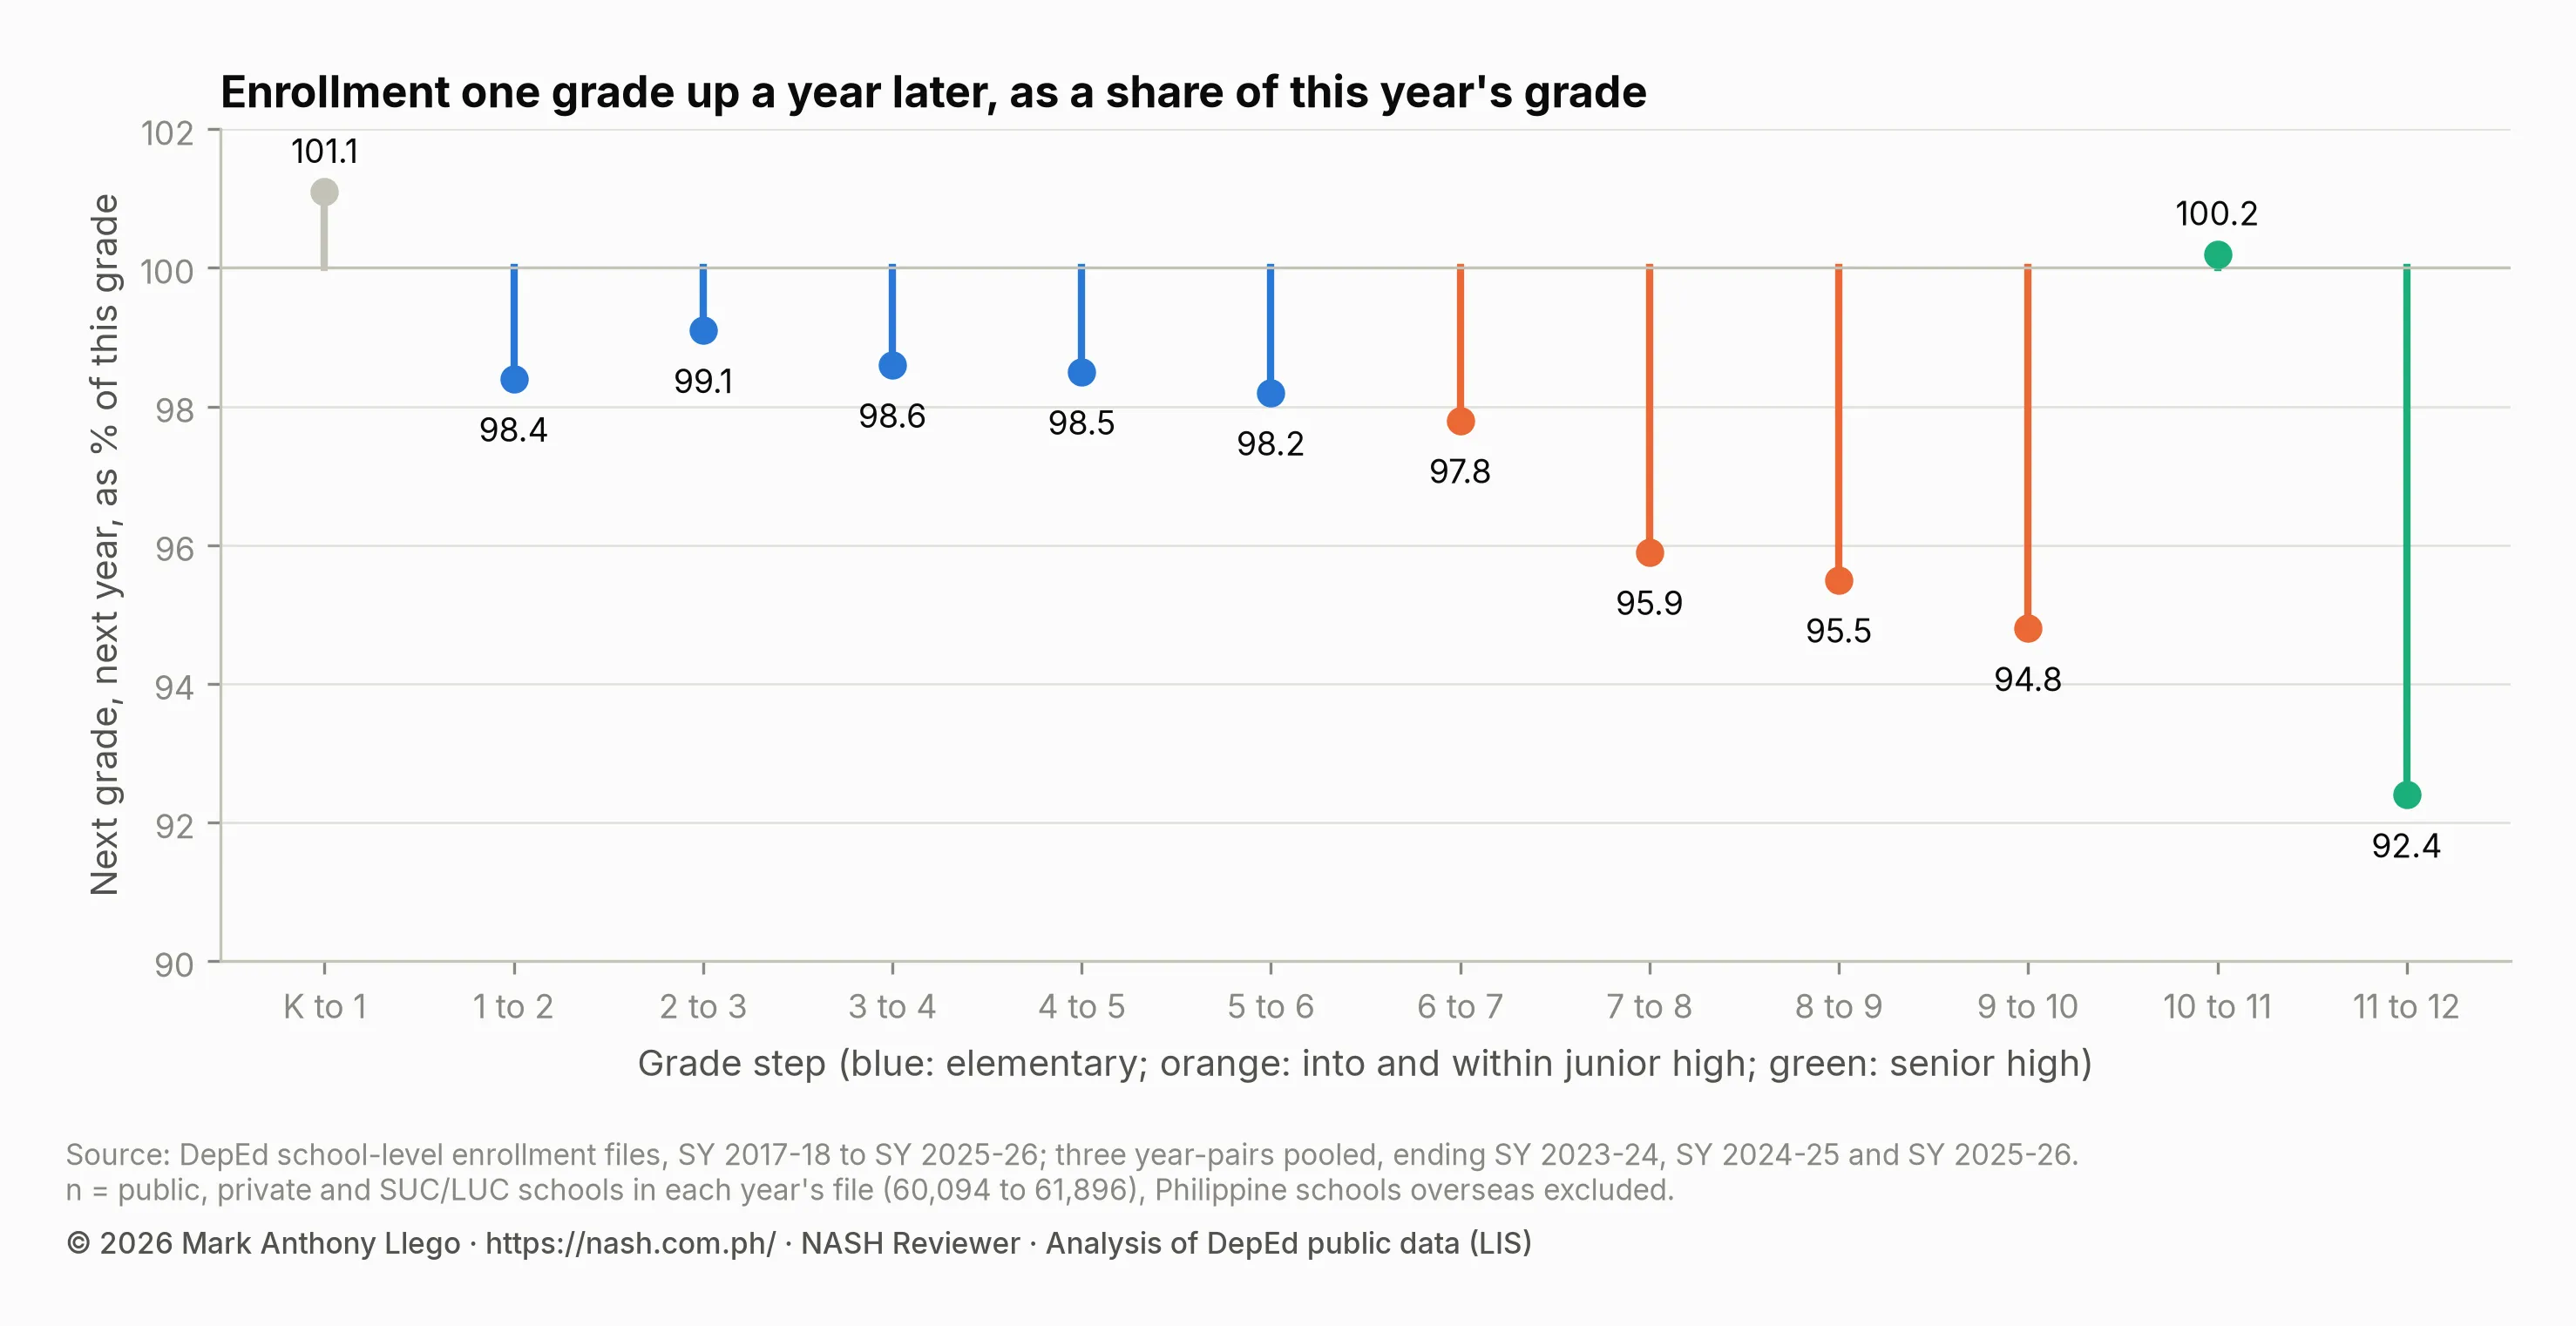
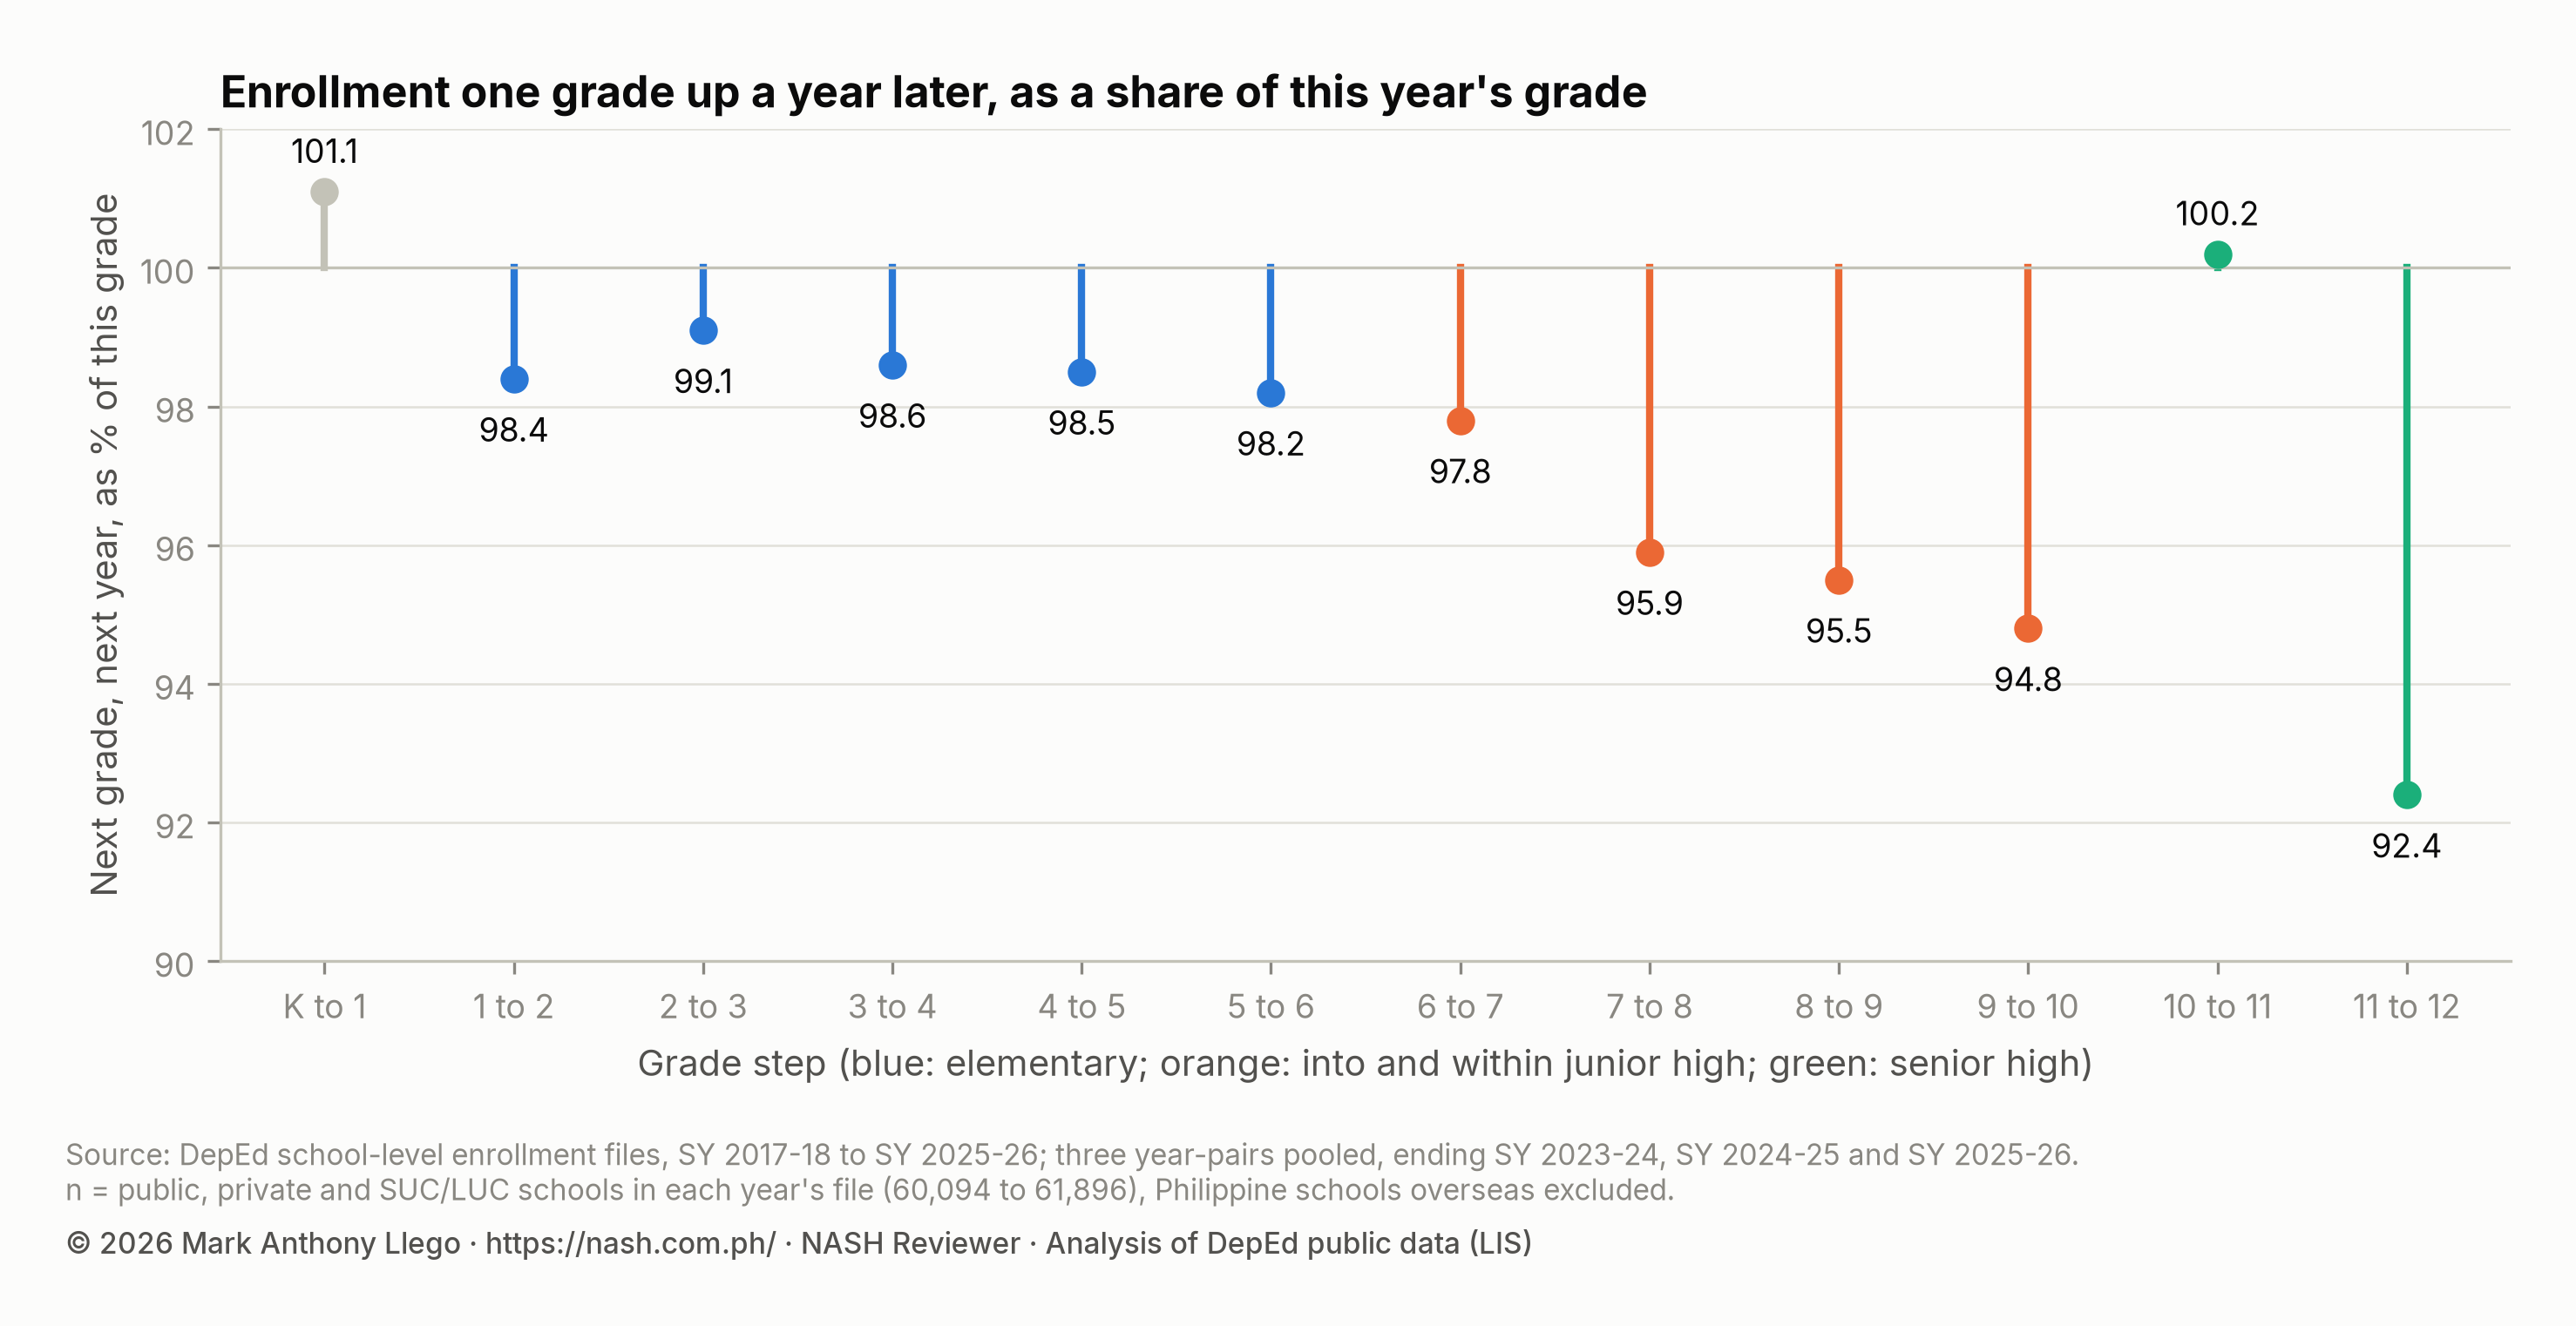
In elementary, each grade keeps 98.2% to 99.1% of the grade below it a year later. The step into Grade 7 keeps 97.8%. Inside junior high the ratio drops to 95.9% from Grade 7 to Grade 8, 95.5% from Grade 8 to Grade 9 and 94.8% from Grade 9 to Grade 10. That matches the BEDP’s reading of DepEd’s own dropout data: “the highest number of dropouts is in Grades 7-9”, which made up “45% of the total number of learners who dropped out of schooling in SY 2019-2020” (DO 024, s. 2022, Internal Efficiency).
Two steps pass 100%. Kindergarten to Grade 1 is 101.1%, because Grade 1 also counts repeaters and children who were not in kindergarten the year before. Grade 10 to Grade 11 is 100.2%: Grade 11 enrolls slightly more learners than Grade 10 had a year earlier, so newcomers at least replace the Grade 10 learners who do not continue; the files do not show where they come from. Grade 11 to Grade 12 then keeps only 92.4%, the largest loss of any step.
Year by year, the Grade 6 to Grade 7 step fell to 92.8% between SY 2019-2020 and SY 2020-2021, the first school year without face-to-face classes, then stayed between 97.1% and 101.1% from SY 2021-2022 on.
Apparent cohort survival by region
| Region | Elementary, Grade 1 to 6 | Junior high, Grade 7 to 10 | Grade 6 to 7 |
|---|---|---|---|
| Region IV-A | 98.5% | 95.4% | 99.1% |
| Region VI | 98.6% | 94.7% | 98.6% |
| Region VII | 97.5% | 94.6% | 99.9% |
| NCR | 92.8% | 94.3% | 100.7% |
| Region I | 97.6% | 93.7% | 98.0% |
| Region III | 97.2% | 93.3% | 97.8% |
| Region V | 93.2% | 91.9% | 97.2% |
| CAR | 97.1% | 91.9% | 98.0% |
| Region II | 96.5% | 91.2% | 97.6% |
| Region XI | 95.2% | 90.4% | 98.5% |
| MIMAROPA | 92.3% | 89.8% | 96.0% |
| NIR | 96.3% | 88.8% | 97.9% |
| Region VIII | 94.3% | 87.4% | 96.8% |
| CARAGA | 94.4% | 87.3% | 96.3% |
| Region X | 92.9% | 87.3% | 97.1% |
| Region XII | 91.3% | 85.8% | 99.5% |
| Region IX | 91.4% | 84.8% | 95.7% |
| BARMM | 78.0% | 79.9% | 84.2% |
| Philippines | 94.7% | 91.4% | 97.8% |
The Grade 6 to 7 column pools the three year-pairs ending SY 2023-24 to SY 2025-26.
Regions are on SY 2025-2026 boundaries in every year. Sulu, part of BARMM until SY 2024-2025, is counted in Region IX, and the Negros and Siquijor divisions in the Negros Island Region (NIR). Counted with Sulu, as in the years the BEDP describes, BARMM’s ratios would be 79.3% in elementary, 80.3% in junior high and 84.0% from Grade 6 to Grade 7.
BARMM stands apart on every measure. In the BEDP, BARMM was “an outlier in terms of Elementary School Leaver Rate (4.87%) and Completion Rate (72.94%) when the corresponding averages for other regions are 0.52% and 96.17%” (DO 024, s. 2022, Muslim Children and Youth). The enrollment files show the same pattern in later years: only 84.2% as many learners in Grade 7 as in Grade 6 a year earlier, and under 80% survival in both levels.
NCR is the reverse case in elementary. Its 92.8% sits below the national figure while its junior high figure, 94.3%, is above it, and its Grade 6 to 7 step exceeds 100%. Families leaving the capital during elementary and secondary schools drawing learners from outside NCR would both produce that pattern; the files do not record where learners go.
Apparent cohort survival by division
Across the 175 divisions with stable boundaries, the median division keeps 96.3% of its Grade 1 cohorts to Grade 6 and 92.0% of its Grade 7 cohorts to Grade 10. The tenth and ninetieth percentiles are 90.3% and 99.5% in elementary and 84.4% and 96.3% in junior high. Divisions that keep more learners in elementary usually keep more in junior high as well; the correlation between the two ratios is 0.65.
The ten divisions with the lowest junior high ratio:
| Division | Region | Elementary, Grade 1 to 6 | Junior high, Grade 7 to 10 |
|---|---|---|---|
| Basilan | BARMM | 81.8% | 70.2% |
| Davao Occidental | Region XI | 82.9% | 71.9% |
| Lamitan City | BARMM | 86.9% | 77.1% |
| Tawi-Tawi | BARMM | 79.4% | 78.7% |
| Sultan Kudarat | Region XII | 95.2% | 80.1% |
| Bukidnon | Region X | 89.5% | 80.4% |
| Zamboanga del Sur | Region IX | 92.6% | 81.4% |
| Agusan del Sur | CARAGA | 89.9% | 81.4% |
| Sarangani | Region XII | 93.3% | 81.7% |
| Masbate | Region V | 88.8% | 82.1% |
The ten with the highest:
| Division | Region | Elementary, Grade 1 to 6 | Junior high, Grade 7 to 10 |
|---|---|---|---|
| Iloilo City | Region VI | 100.4% | 100.8% |
| Baguio City | CAR | 97.3% | 100.2% |
| Muntinlupa City | NCR | 93.3% | 98.9% |
| Batanes | Region II | 102.2% | 98.9% |
| Tayabas City | Region IV-A | 99.6% | 98.5% |
| Davao City | Region XI | 98.4% | 98.3% |
| Albay | Region V | 94.7% | 98.0% |
| Siquijor | NIR | 101.6% | 97.8% |
| Bogo City | Region VII | 101.2% | 97.6% |
| Tuguegarao City | Region II | 98.5% | 97.4% |
In junior high, 60 of the 175 divisions are below 90%: 11 in Region VIII, 7 in Region X, 6 each in CARAGA and Region IX, and 5 each in Region III and Region XI. In elementary, 17 are below 90%, among them 4 in NCR and 3 in BARMM, and 12 reach 100% or more. City divisions near the top, such as Iloilo City and Baguio City, may draw high school learners from neighboring towns, and a single division’s figure cannot separate those learners from learners kept. Every division’s figures are in the division CSV.
The DepEd schools division rankings compare the same divisions on enrollment growth and school inputs.
Repetition, school leavers and completion: what the official figures show
Because the public files carry no repeaters, leavers or graduates, these three indicators come only from DepEd’s own computations and from studies:
- Completion. The Q-BEDP’s SY 2023-2024 baselines are in the table above. The BEDP adds that “When a cohort from Grade 1 to Grade 12 is followed, the completion rate is low with only 50% of Grade 1 cohorts completing Grade 12” (Internal Efficiency).
- Dropouts and school leavers. The BEDP’s SY 2019-2020 dropout baselines are in the table above. Around 75% of elementary dropouts in SY 2018-2019 and SY 2019-2020 were “between Kindergarten and Grade 4, with Kindergarten and Grade 1 accounting for almost 60%” of dropouts in the primary level.
- Repetition. In the 2024 SEA-PLM, “28% of Grade 5 students” had repeated a grade (EDCOM II Final Report, p. 150).
The BEDP aims for “zero dropouts and zero school leavers” (DO 024, s. 2022, Sec. 5.1, Sub-Intermediate Outcome 1.2), and its Table 16 dropout targets reach 0% at every level by 2030.
What this means for school heads
- Know your school’s own numbers. Compute the promotion rate and the dropout rate by cause each year from School Forms 2, 4 and 6, as the School Report Card requires (DO 44, s. 2015, Annex 11), and keep three years side by side.
- Read a ratio as a question, not a verdict. A school’s Grade 6 enrollment over its Grade 1 enrollment five years earlier mixes leavers, repeaters, transferees and late entrants. Before you report a low ratio as dropout, check School Form 4 for transfers in and out and for dropouts during the year, then compare last year’s School Form 5, the report on promotion, with this year’s School Form 1, the school register, to find learners who finished a grade but did not enroll (DepEd Order No. 58, s. 2017).
- Watch the junior high years and Grade 11 to 12. The national data show the largest losses there. A junior or senior high school head should track learners who are absent often or who finished a grade but have not enrolled, before the new school year starts.
- Use the indicators to find learners, not to hit a number. EDCOM II found that “promotion, completion, and dropout indicators are still used as headline metrics” in performance forms and report cards, which pushes schools toward mass promotion (Final Report, pp. 161-162), and it recommends that performance targets not be “linked, directly or indirectly, to student promotion or dropout rates” (p. 451). Under DepEd Order No. 015, s. 2026, promotion must consider “both achievement and participation in required interventions” (item 67). The mass promotion guide explains why.
- Compare like with like. Compare your school with schools of the same level, size and setting in your division, and with its own past years, not with the national rate.
These steps serve indicators of the Philippine Professional Standards for School Heads (PPSSH), adopted through DepEd Order No. 024, s. 2020: strand 1.7 on monitoring and evaluation processes and tools, and strand 3.4 on learner achievement and other performance indicators. The guides to Domain 1 and Domain 3 explain them.
How the NASH may test this
The items below are original practice items, scored 3 (Relational), 2 (Multistructural), 1 (Unistructural) or 0 (Prestructural). An option that breaks a rule scores 0.
Question 1
Indicator 1.7.1, Monitoring and evaluation processes and tools. Career Stage 1, Conceptual, Moderate.
DepEd reports both a school leaver rate and a simple dropout rate. Which statement best explains why a school’s school leaver rate can be higher than its simple dropout rate?
- A. It is computed against the previous year’s enrollment, so it covers a longer period of time than the simple dropout rate does.
- B. It counts learners who were retained in the same grade, so it rises every time the school fails learners at the end of the school year.
- C. It also counts learners who finished a grade but did not enroll in the next grade the next year, which the dropout rate leaves out.
- D. It is reported only at the end of the school year, after all transfers and dropouts have been recorded in the school forms.
Answer and explanation
Best answer: C. Points: A = 2, B = 0, C = 3, D = 1.
- A (2 points, Multistructural). The leaver rate does use the previous year’s enrollment and spans the break between school years, but the option does not name the learners it adds.
- B (0 points, Prestructural). A retained learner is still enrolled; repetition is a separate indicator, and the leaver rate counts learners who leave school.
- C (3 points, Relational). It names the group the leaver rate adds, learners who finished a grade but did not come back, and ties it to what the dropout rate misses.
- D (1 point, Unistructural). Timing matters for recording, but when a rate is reported does not explain why one rate is larger than the other.
Why. This aligns with Career Stage 1 expectations because indicator 1.7.1 asks an aspiring school head to understand the monitoring tools the school uses. DO 52, s. 2016 defines the school leaver rate as learners “who leave school during the year for any reason as well as those who complete the previous grade/year level but fail to the [sic] enrol in the next grade/year level the following school year”, and the simple dropout rate as one that “does not capture” those who finish a grade but do not enroll the next year. The option about the previous year’s enrollment is true but does not say which learners the leaver rate adds.
Indicator 1.7.1: Display knowledge and understanding of monitoring and evaluation processes and tools to promote learner achievement.
Sources: DepEd Order No. 52, s. 2016, Performance Indicators.
Question 2
Indicator 3.4.2, Learner achievement and other performance indicators. Career Stage 2, Situational, Moderate.
You are the school head of a junior high school in a fishing town. This year’s Grade 10 enrollment is 82 percent of the Grade 7 class three years ago. The division has asked schools to improve completion, and a teacher suggests promoting every Grade 7 to 9 learner this year so that fewer of them leave. What is the most appropriate action?
- A. Approve promoting every Grade 7 to 9 learner this year, since a higher promotion rate keeps more of them enrolled until Grade 10.
- B. Trace each learner who left through the school forms and advisers, separate transfers from leavers, and support those at risk.
- C. Ask advisers to visit learners with frequent absences and report the reasons monthly, and set a target to halve the number of leavers.
- D. Invite a guidance counselor from the division to talk to Grade 7 to 9 learners and their parents about the value of finishing school.
Answer and explanation
Best answer: B. Points: A = 0, B = 3, C = 2, D = 1.
- A (0 points, Prestructural). Promotion must follow achievement and participation in required interventions; promoting everyone to protect a rate is the mass promotion the grading rules and EDCOM II reject.
- B (3 points, Relational). It finds out what the 82 percent hides, separating learners who transferred from those who left school, and directs support to the learners who need it.
- C (2 points, Multistructural). Following up absences is useful and targets attendance, but it skips finding out who actually left and sets a number to hit instead of a plan for each learner.
- D (1 point, Unistructural). Encouragement can help, but a general talk does not identify the learners who left or why.
Why. This aligns with Career Stage 2 expectations because indicator 3.4.2 asks the school head to use learning outcomes and other indicators to design data-based interventions. A ratio of grade totals mixes leavers with transferees, repeaters and late entrants, so the school must trace its own learners; the School Report Card reports dropouts “by cause” from School Forms 2 and 4 (DO 44, s. 2015, Annex 11). DO 015, s. 2026 makes promotion consider “both achievement and participation in required interventions” (item 67): learners are promoted “upon satisfactorily passing all learning areas in the previous grade level”, and those “who fail in more than two (2) learning areas shall be retained in the same grade level” (items 67.a and 67.e). The option on absences acts on a sign of leaving but never establishes who left.
Indicator 3.4.2: Utilize learning outcomes in developing data-based interventions to maintain learner achievement and attain other performance indicators.
Sources: DepEd Order No. 44, s. 2015, Annex 11; DepEd Order No. 015, s. 2026, item 67; DepEd Order No. 52, s. 2016, Performance Indicators.
Nothing in this guide reproduces or predicts examination content.
Frequently asked questions
What is the cohort survival rate in DepEd?
It is the “Percentage of enrolees at the beginning grade or year in a given school year who reached the final grade or year of elementary/ secondary level” (DO 52, s. 2016). The BEDP reported 97% for elementary and 87% for junior high in SY 2019-2020 (DO 024, s. 2022, Table 6).
What is the difference between the dropout rate and the school leaver rate?
The simple dropout rate counts learners “who do not finish a particular grade/year level”. The school leaver rate also counts learners who “complete the previous grade/year level but fail to the [sic] enrol in the next grade/year level the following school year” (DO 52, s. 2016). The leaver rate is therefore the wider measure.
What is DepEd’s completion rate now?
The Q-BEDP gives a SY 2023-2024 baseline of 92% in elementary, 82% in junior high and 73% in senior high, with a target of 100% for all three by 2034 (Annex 6).
Why can a division’s apparent cohort survival be above 100%?
Because the ratio compares grade totals, not the same learners. Repeaters, late entrants, returning learners and learners who move in from other divisions are all counted in the later grade. In the enrollment files, 12 of 175 divisions reach 100% or more in elementary and 2 in junior high.
Download the data
- National cohort survival (CSV): Grade 1 and Grade 7 cohorts, their sizes and the later Grade 6 and Grade 10 enrollment, all sectors. Source: DepEd school-level enrollment files, SY 2017-18 to SY 2025-26.
- Grade-to-grade progression (CSV): enrollment in the next grade a year later as a share of each grade, pooled over three year-pairs. Same source.
- Regional cohort survival (CSV): pooled elementary and junior high ratios with their first-grade and last-grade totals for the 18 regions. Same source.
- Division cohort survival (CSV): the same ratios for the 175 divisions with stable boundaries. Same source.
The CSVs and charts may be reused only with written permission: email support@nash.com.ph. The rules themselves come from DepEd’s issuances, which you can cite directly. The cleaned school-level files are documented in Download Cleaned DepEd School Data.
Sources
DepEd issuances and plans
- DepEd Order No. 52, s. 2016, Data Collection of Basic Education Statistics in the Learner Information System and Enhanced Basic Education Information System for Beginning of School Year 2016-2017, June 30, 2016, glossary of performance indicators.
- DepEd Order No. 024, s. 2022, Adoption of the Basic Education Development Plan 2030, May 30, 2022: Internal Efficiency (Table 6), Muslim Children and Youth, and the MEA Framework (Tables 16 and 18).
- DepEd, Quality Basic Education Development Plan 2025-2035, July 29, 2025, p. 3 and Annex 6.
- DepEd Order No. 44, s. 2015, Guidelines on the Enhanced School Improvement Planning Process and the School Report Card, September 29, 2015, Annex 11.
- DepEd Order No. 015, s. 2026, Revised Guidelines on Classroom Assessment, Grading System, and Awards and Recognition for the K to 12 Basic Education Program, June 4, 2026, item 67.
- DepEd Order No. 024, s. 2020, National Adoption and Implementation of the Philippine Professional Standards for School Heads, September 7, 2020, strands 1.7 and 3.4.
- DepEd Order No. 58, s. 2017, Adoption of New School Forms, November 27, 2017, list of forms (School Forms 1, 4 and 5).
Reports
- Second Congressional Commission on Education, Turning Point: A Decade of Necessary Reform (2026-2035), EDCOM II Final Report, January 2026, pp. 150, 161-162 and 451.
Data
- DepEd school-level enrollment files, SY 2017-2018 to SY 2025-2026, as cleaned in Download Cleaned DepEd School Data: public, private and state or local university schools, Philippine schools overseas excluded; regions on SY 2025-2026 boundaries.
Written by Mark Anthony Llego for NASH Reviewer. Sources: DepEd Orders No. 52, s. 2016, No. 024, s. 2022, No. 44, s. 2015, No. 58, s. 2017, No. 015, s. 2026 and No. 024, s. 2020; the Quality Basic Education Development Plan 2025-2035; the EDCOM II Final Report; DepEd school-level enrollment files, SY 2017-2018 to SY 2025-2026. Charts may be reused only with written permission from support@nash.com.ph.