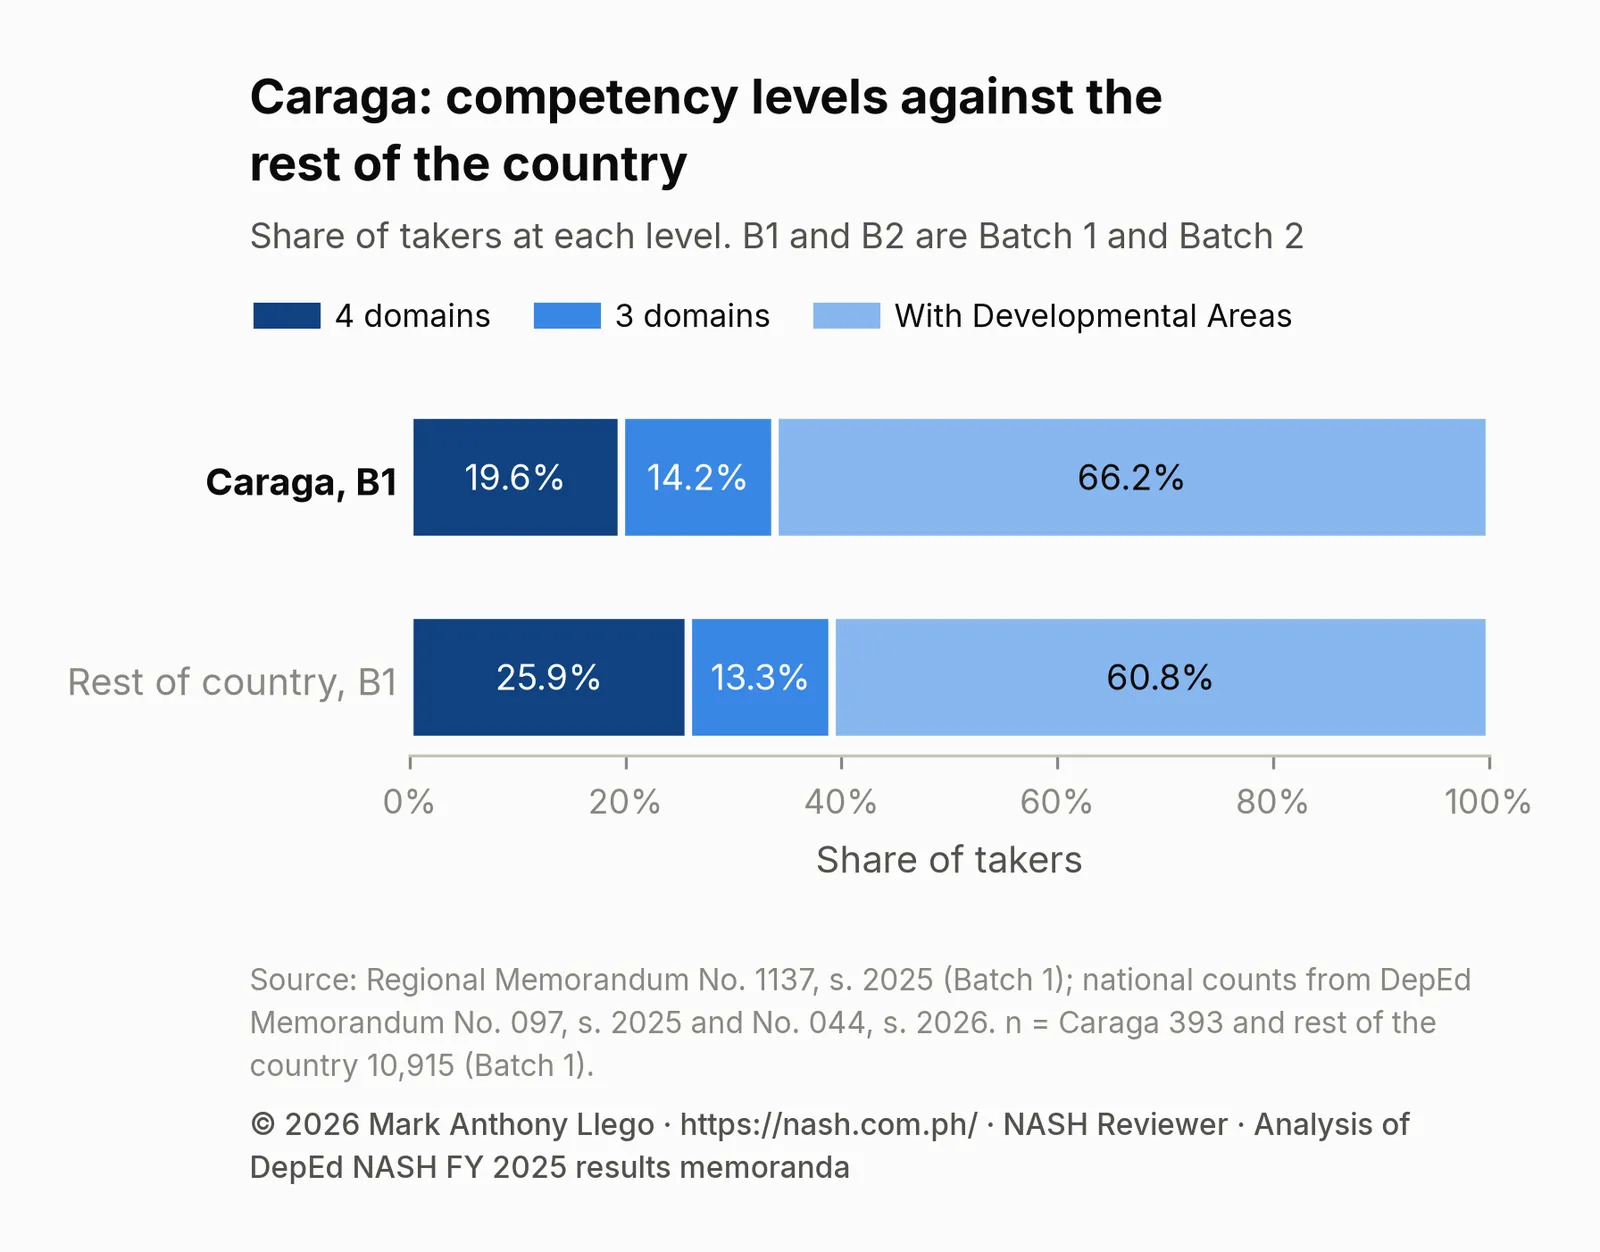
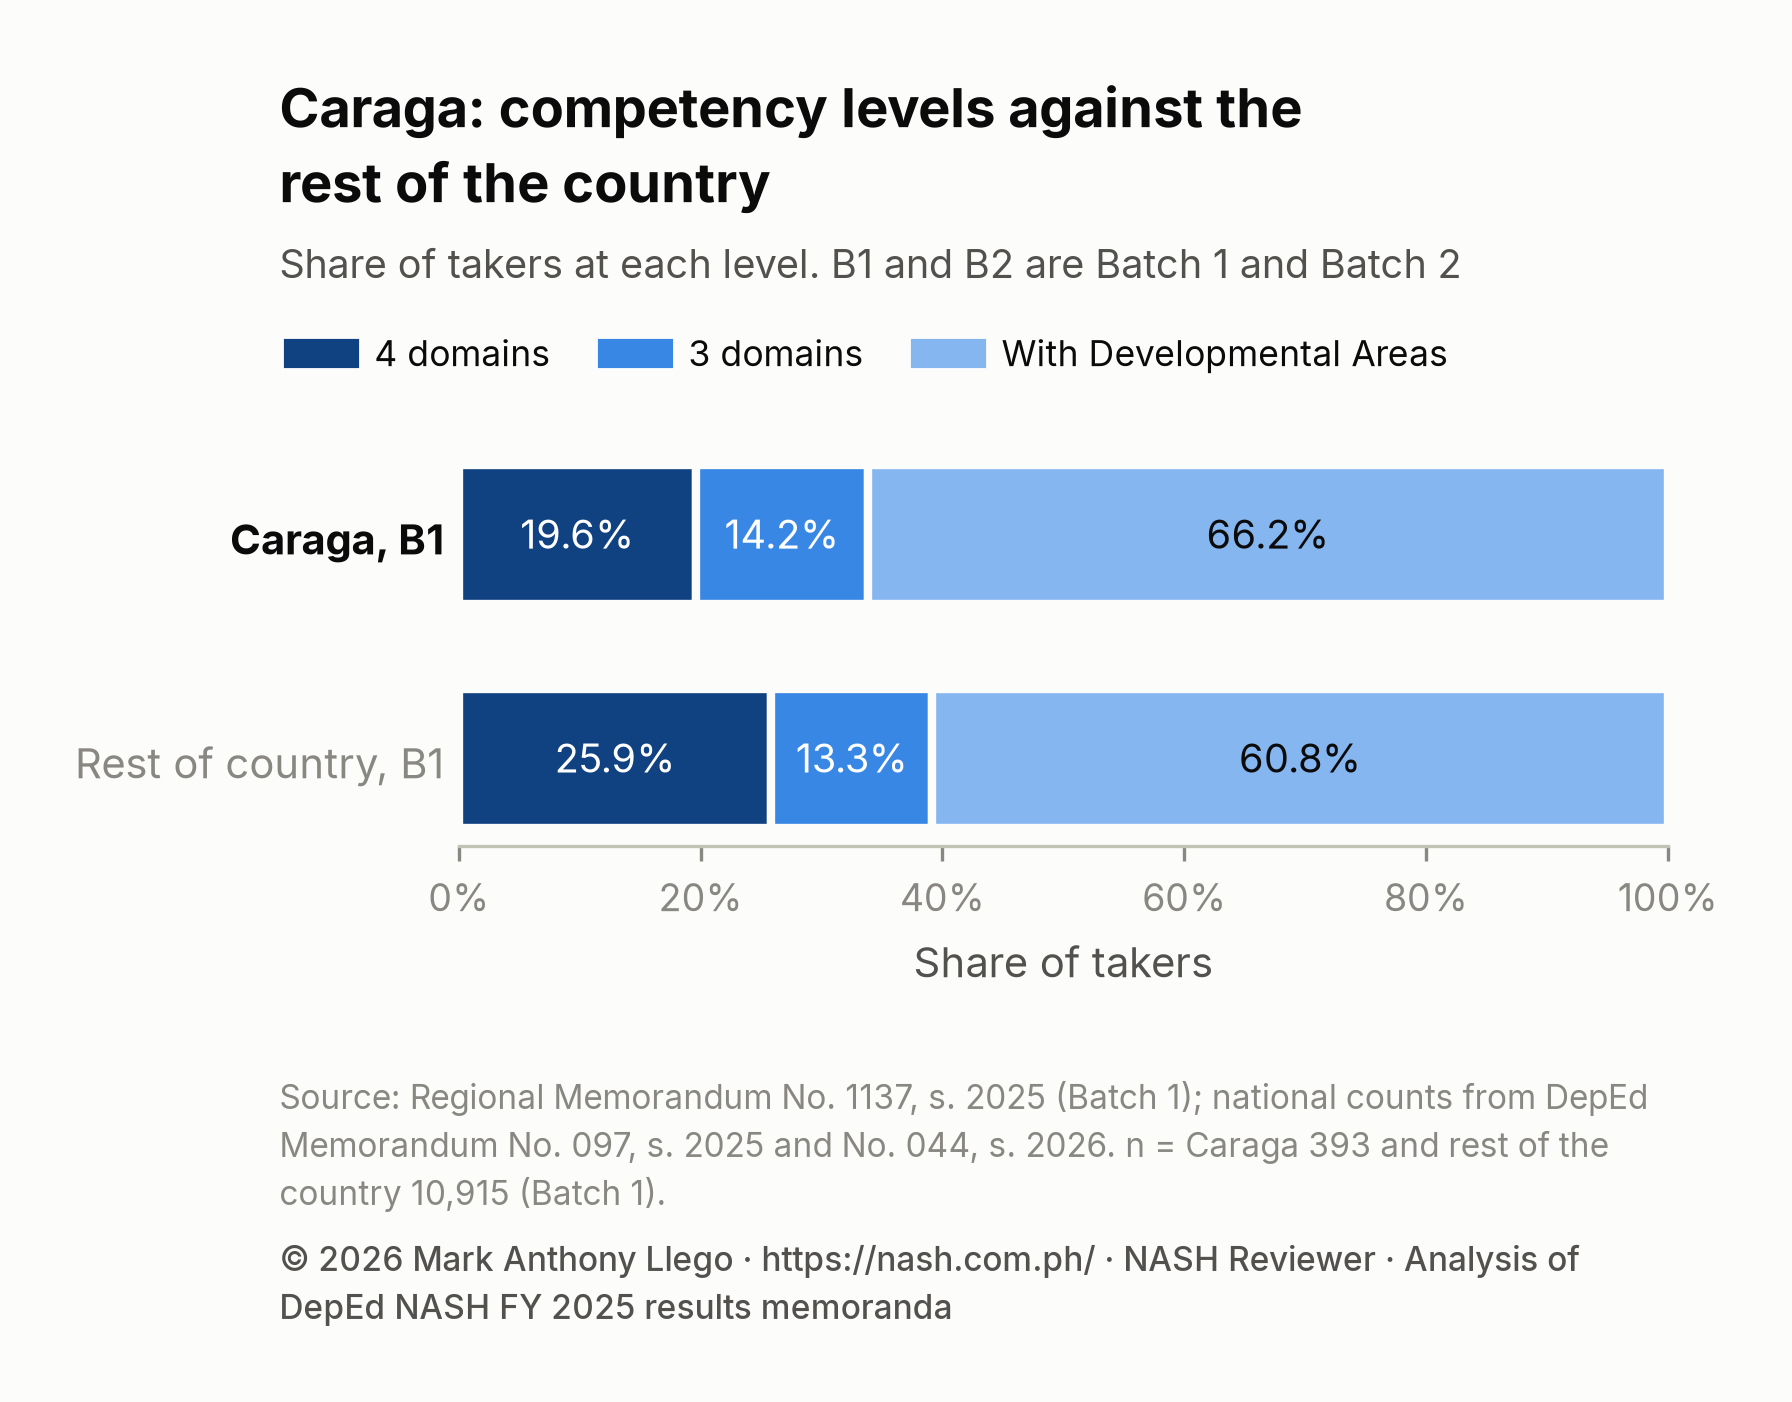
Region XIII (Caraga), also written Region 13, published its own results of the FY 2025 National Assessment for School Heads (NASH, formerly NQESH). In Batch 1, 77 of 393 takers (19.6%) met the Philippine Professional Standards for School Heads (PPSSH) in four domains, against 25.9% in the rest of the country.
DepEd’s national memoranda, DepEd Memorandum No. 097, s. 2025 for Batch 1 and DepEd Memorandum No. 044, s. 2026 for Batch 2, report the results for the whole country only. For the national picture and what a score of 65 means, read NASH Results 2025 Explained. As in that post, “pass” here means reaching one of the two “Meeting PPSSH standards” levels, which make a taker a prospective candidate for School Principal I.
Key points
- 77 of 393 Batch 1 takers (19.6%) met the PPSSH standards in four domains. That is 6.3 percentage points below the rest of the country (25.9%), a gap that is not conclusive when Region I is left out of the comparison.
- Counting both “Meeting PPSSH standards” levels, Caraga’s pass rate was 33.8% in Batch 1. That is 133 prospective candidates for School Principal I in Batch 1.
- Schools divisions. In Batch 1, the 12 divisions differ no more than chance would explain.
- The Regional Top Performer lists name 34 in Batch 1 (44.2% of the region’s four-domain takers). The lists are a selection, not a ranking of divisions or a list of everyone who passed.
- 38.9% of Caraga’s takers scored 65 or higher overall, more than the 33.8% who passed, because 20 takers reached 65 overall but not in three domains.
Where the Caraga figures come from
- Batch 1: Regional Memorandum No. 1137, s. 2025 of DepEd Caraga, “Official Results of Batch 1 Test Takers of the National Assessment for School Heads (NASH) FY 2025”, dated October 24, 2025. It gives its Regional Top Performers and the list of takers at each level with their schools division, which this post counts.
- Batch 2: As of October 2026, no Caraga results memorandum for Batch 2 had been published, so this post covers Batch 1 only.
The comparison group throughout is the rest of the country: the national counts in DepEd Memorandum No. 097, s. 2025 and DepEd Memorandum No. 044, s. 2026 minus Caraga’s own. The regional lists name every taker and give each one’s result. This post uses only the counts. To find a name, use the app’s NASH results page; your own result is on your certificate of rating in the DepEd Learning Management System (LMS).
NASH results in Caraga by competency level
| Competency level | Batch 1 takers (share, 95% interval) |
|---|---|
| Meeting PPSSH standards in four domains | 77 (19.6%, 16.0 to 23.8) |
| Meeting PPSSH standards in three domains | 56 (14.3%, 11.1 to 18.1) |
| With Developmental Areas | 260 (66.2%, 61.3 to 70.7) |
| Passed (either “Meeting” level) | 133 (33.8%, 29.3 to 38.7) |
| All takers | 393 |
These are complete counts of the region’s takers, not a sample. The 95% interval shows how far a share could move by chance in a process like this one, where who took the assessment, how they prepared and the day itself could all have turned out differently. It does not include the measurement error in each score, which DepEd does not publish.
No memorandum says that all takers in a batch were scored on one scale, but the Region IX scores are consistent with it, so the region can be compared with the rest of the country within the batch.
Caraga’s list splits the takers With Developmental Areas into two groups: 20 whose overall score was 65 or higher and 240 whose overall score was below 65. That makes Caraga one of two regions whose published results give the exact share of takers at 65 or higher overall. In Caraga, 153 of 393 takers (38.9%) scored 65 or higher overall, against 33.8% who passed. A taker can reach 65 overall and still be With Developmental Areas, because the level is decided domain by domain.
How Caraga compares with the rest of the country
| Batch | Measure | Caraga | Rest of the country | Difference, points (95% interval) |
|---|---|---|---|---|
| 1 | Four domains | 19.6% | 25.9% | −6.3 (−10.0 to −2.0) |
| 1 | Passed (either level) | 33.8% | 39.2% | −5.3 (−9.9 to −0.4) |
Batch 1. Caraga’s share at the four-domain level is 6.3 percentage points lower than the rest of the country’s (95% interval −10.0 to −2.0; adjusted p = 0.031; Cohen’s h = −0.15, below the usual threshold for a small effect). The pass rate differs from the rest of the country’s by −5.3 points (95% interval −9.9 to −0.4). The interval excludes zero, but after adjusting for the 14 comparisons made in this batch the difference is not conclusive (adjusted p = 0.13). Across all three levels, the region’s spread differs from the rest of the country’s (chi-square = 7.8 with 2 degrees of freedom, adjusted p = 0.040; Cramér’s V = 0.026, below the usual threshold for a small difference).
Takers in the same division tend to do alike, which makes intervals like the one above too narrow. Allowing for that with a division-cluster interval, the four-domain difference is −12.2 to −0.3 points, so the difference still holds. No single division drives it: leaving out the division that moves it most, Agusan del Sur, the difference is still −4.6 points. The four-domain share comparison also depends on Region I, whose shares are far above every other region with published counts. With Region I left out of the comparison group, the difference is −4.0 points (adjusted p = 0.25), which is no longer conclusive.
These differences describe the people who took the assessment in each region. The memoranda do not explain them. They may reflect who was approved to take the NASH (Head Teachers, Assistant School Principals, teachers, and takers repeating from Batch 1), how takers prepared, or conditions on the day. They say nothing on their own about the quality of the region’s schools or school heads.
NASH results by schools division in Caraga
| Schools division | Takers | Four domains | Three domains | Developmental | Four-domain share (95% interval) |
|---|---|---|---|---|---|
| Surigao del Sur | 115 | 18 | 19 | 78 | 15.7% (10.1 to 23.4) |
| Agusan del Sur | 64 | 7 | 8 | 49 | 10.9% (5.4 to 20.9) |
| Agusan del Norte | 52 | 12 | 5 | 35 | 23.1% (13.7 to 36.1) |
| Surigao del Norte | 42 | 5 | 8 | 29 | 11.9% (5.2 to 25.0) |
| Butuan City | 23 | 7 | 2 | 14 | 30.4% (15.6 to 50.9) |
| Surigao City | 23 | 7 | 3 | 13 | 30.4% (15.6 to 50.9) |
| Dinagat Islands | 20 | 3 | 2 | 15 | 15.0% (5.2 to 36.0) |
| Siargao | 17 | 7 | 3 | 7 | 41.2% (21.6 to 64.0) |
| Bayugan City | 16 | 6 | 2 | 8 | 37.5% (18.5 to 61.4) |
| Bislig City | 10 | 3 | 1 | 6 | 30.0% (10.8 to 60.3) |
| Tandag City | 7 | 1 | 2 | 4 | 14.3% (2.6 to 51.3) |
| Cabadbaran City | 4 | 1 | 1 | 2 | 25.0% (4.6 to 69.9) |
The four-domain shares across the 12 divisions differ no more than chance would explain (random-reallocation test, p = 0.059; adjusted for the 12 region-batches tested, p = 0.24). No single division differs from the rest of the region by more than chance would explain. Eight of the 12 divisions had fewer than 30 takers, so their shares are uncertain, as the wide intervals show.
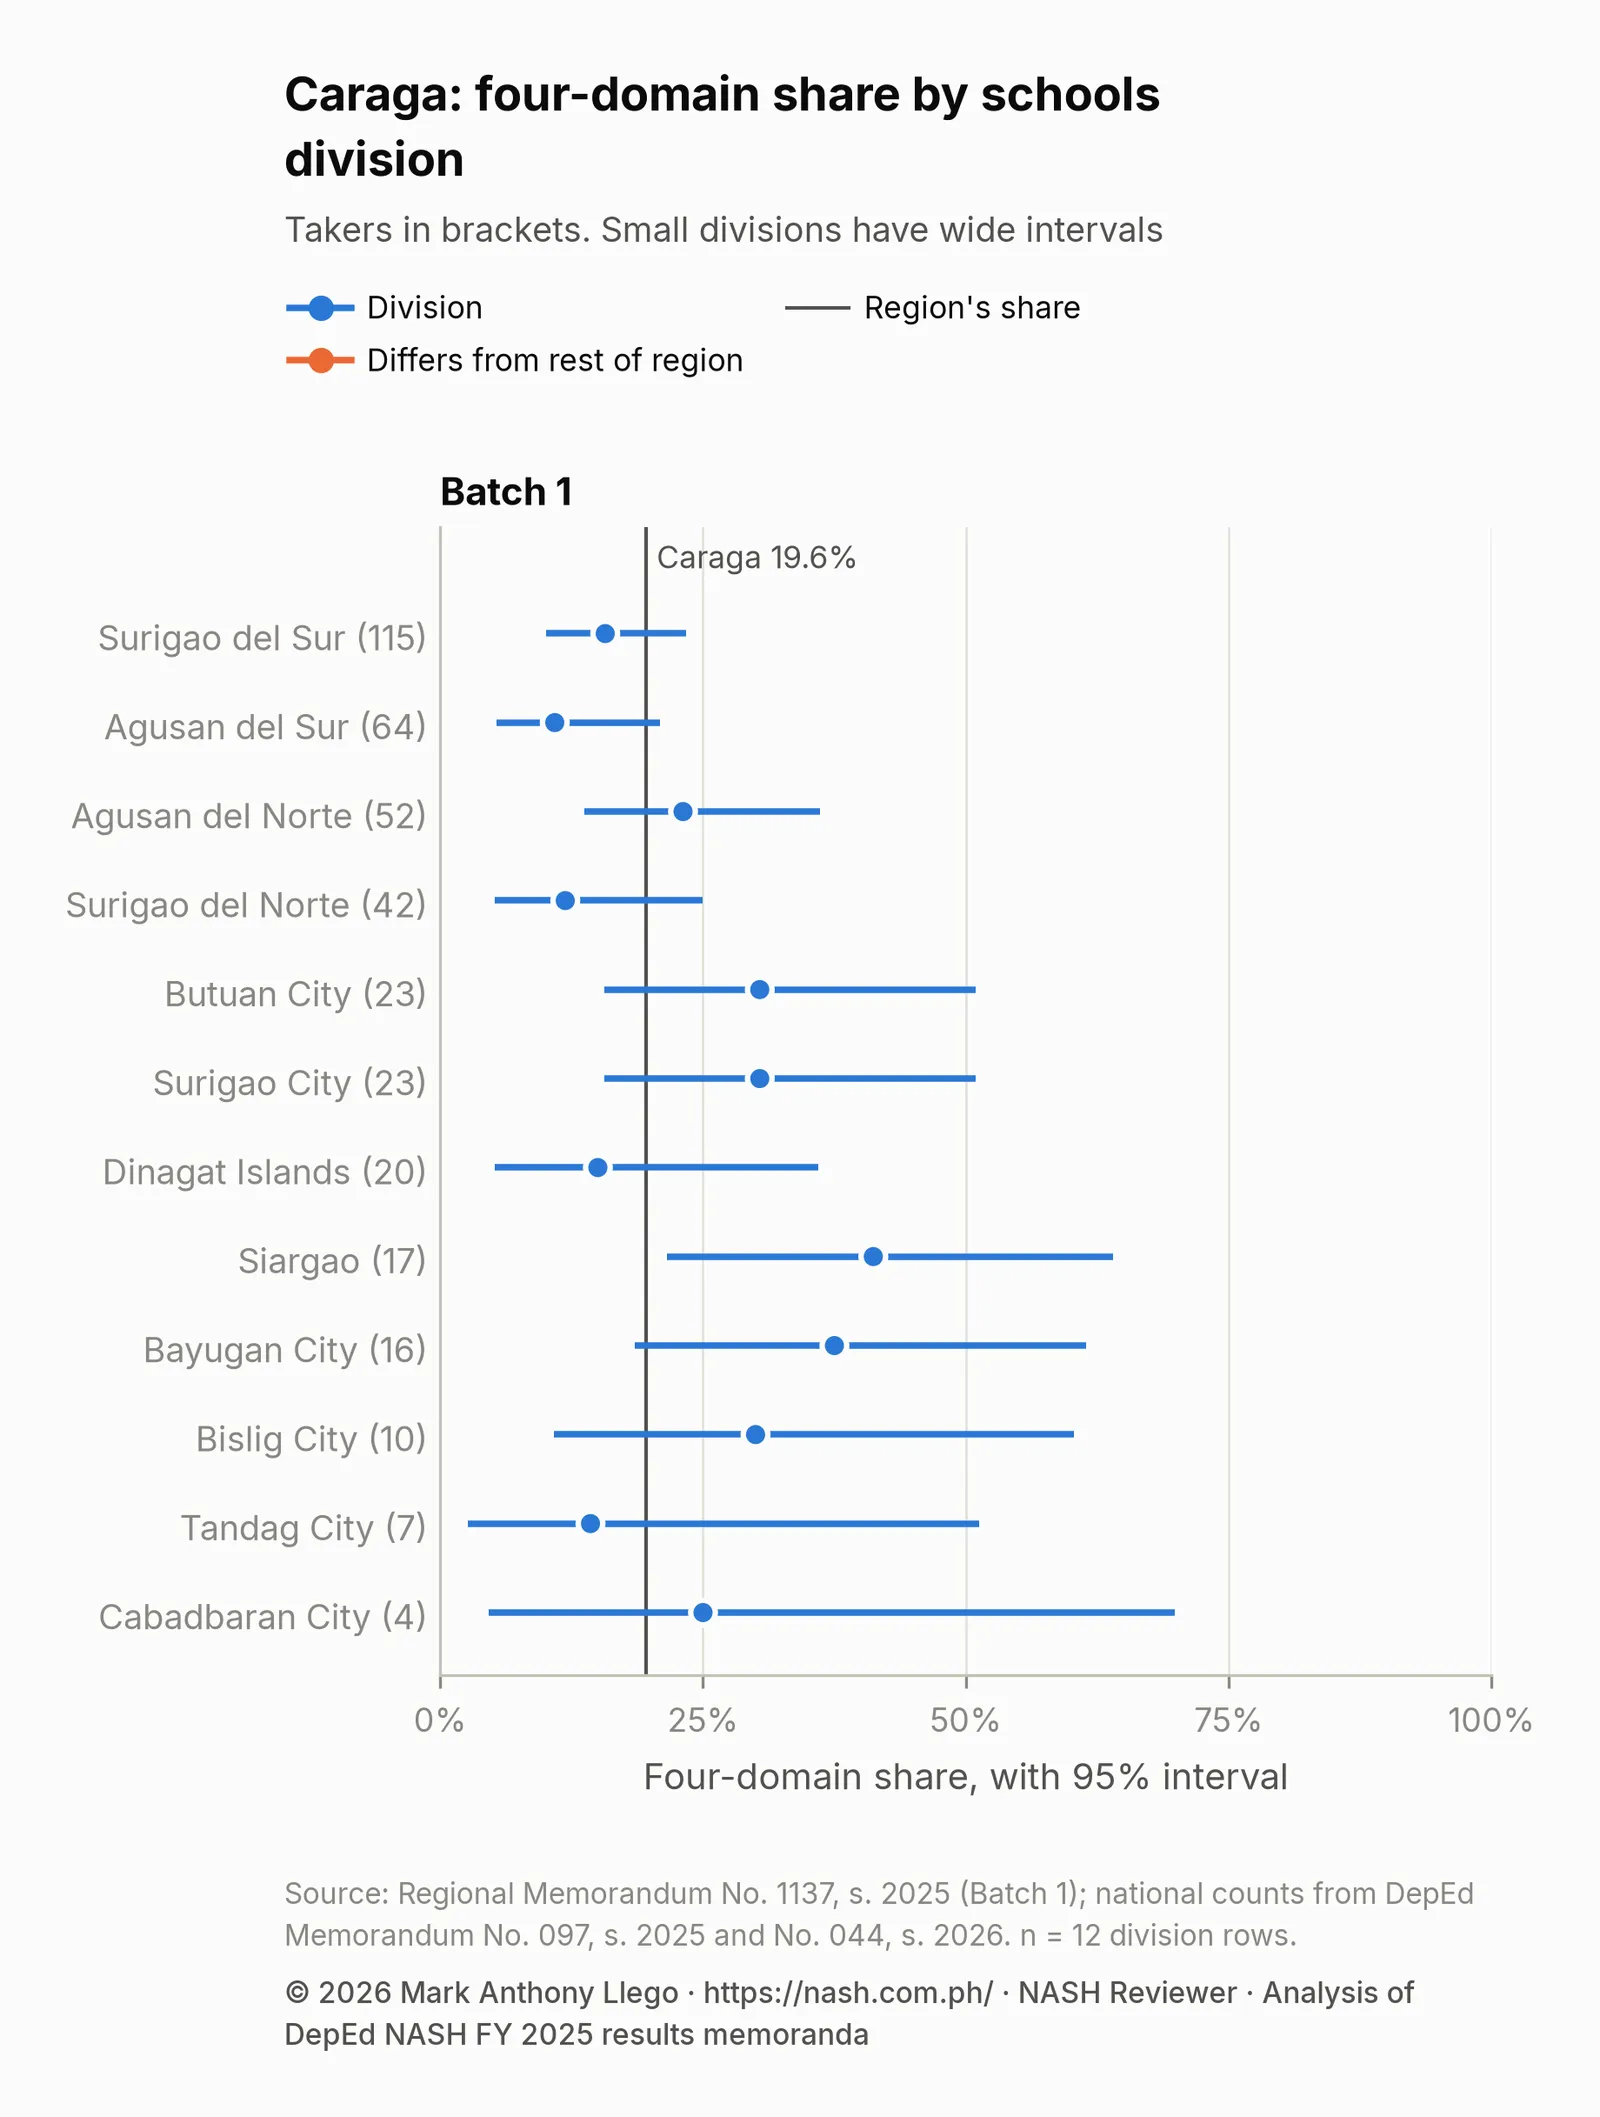
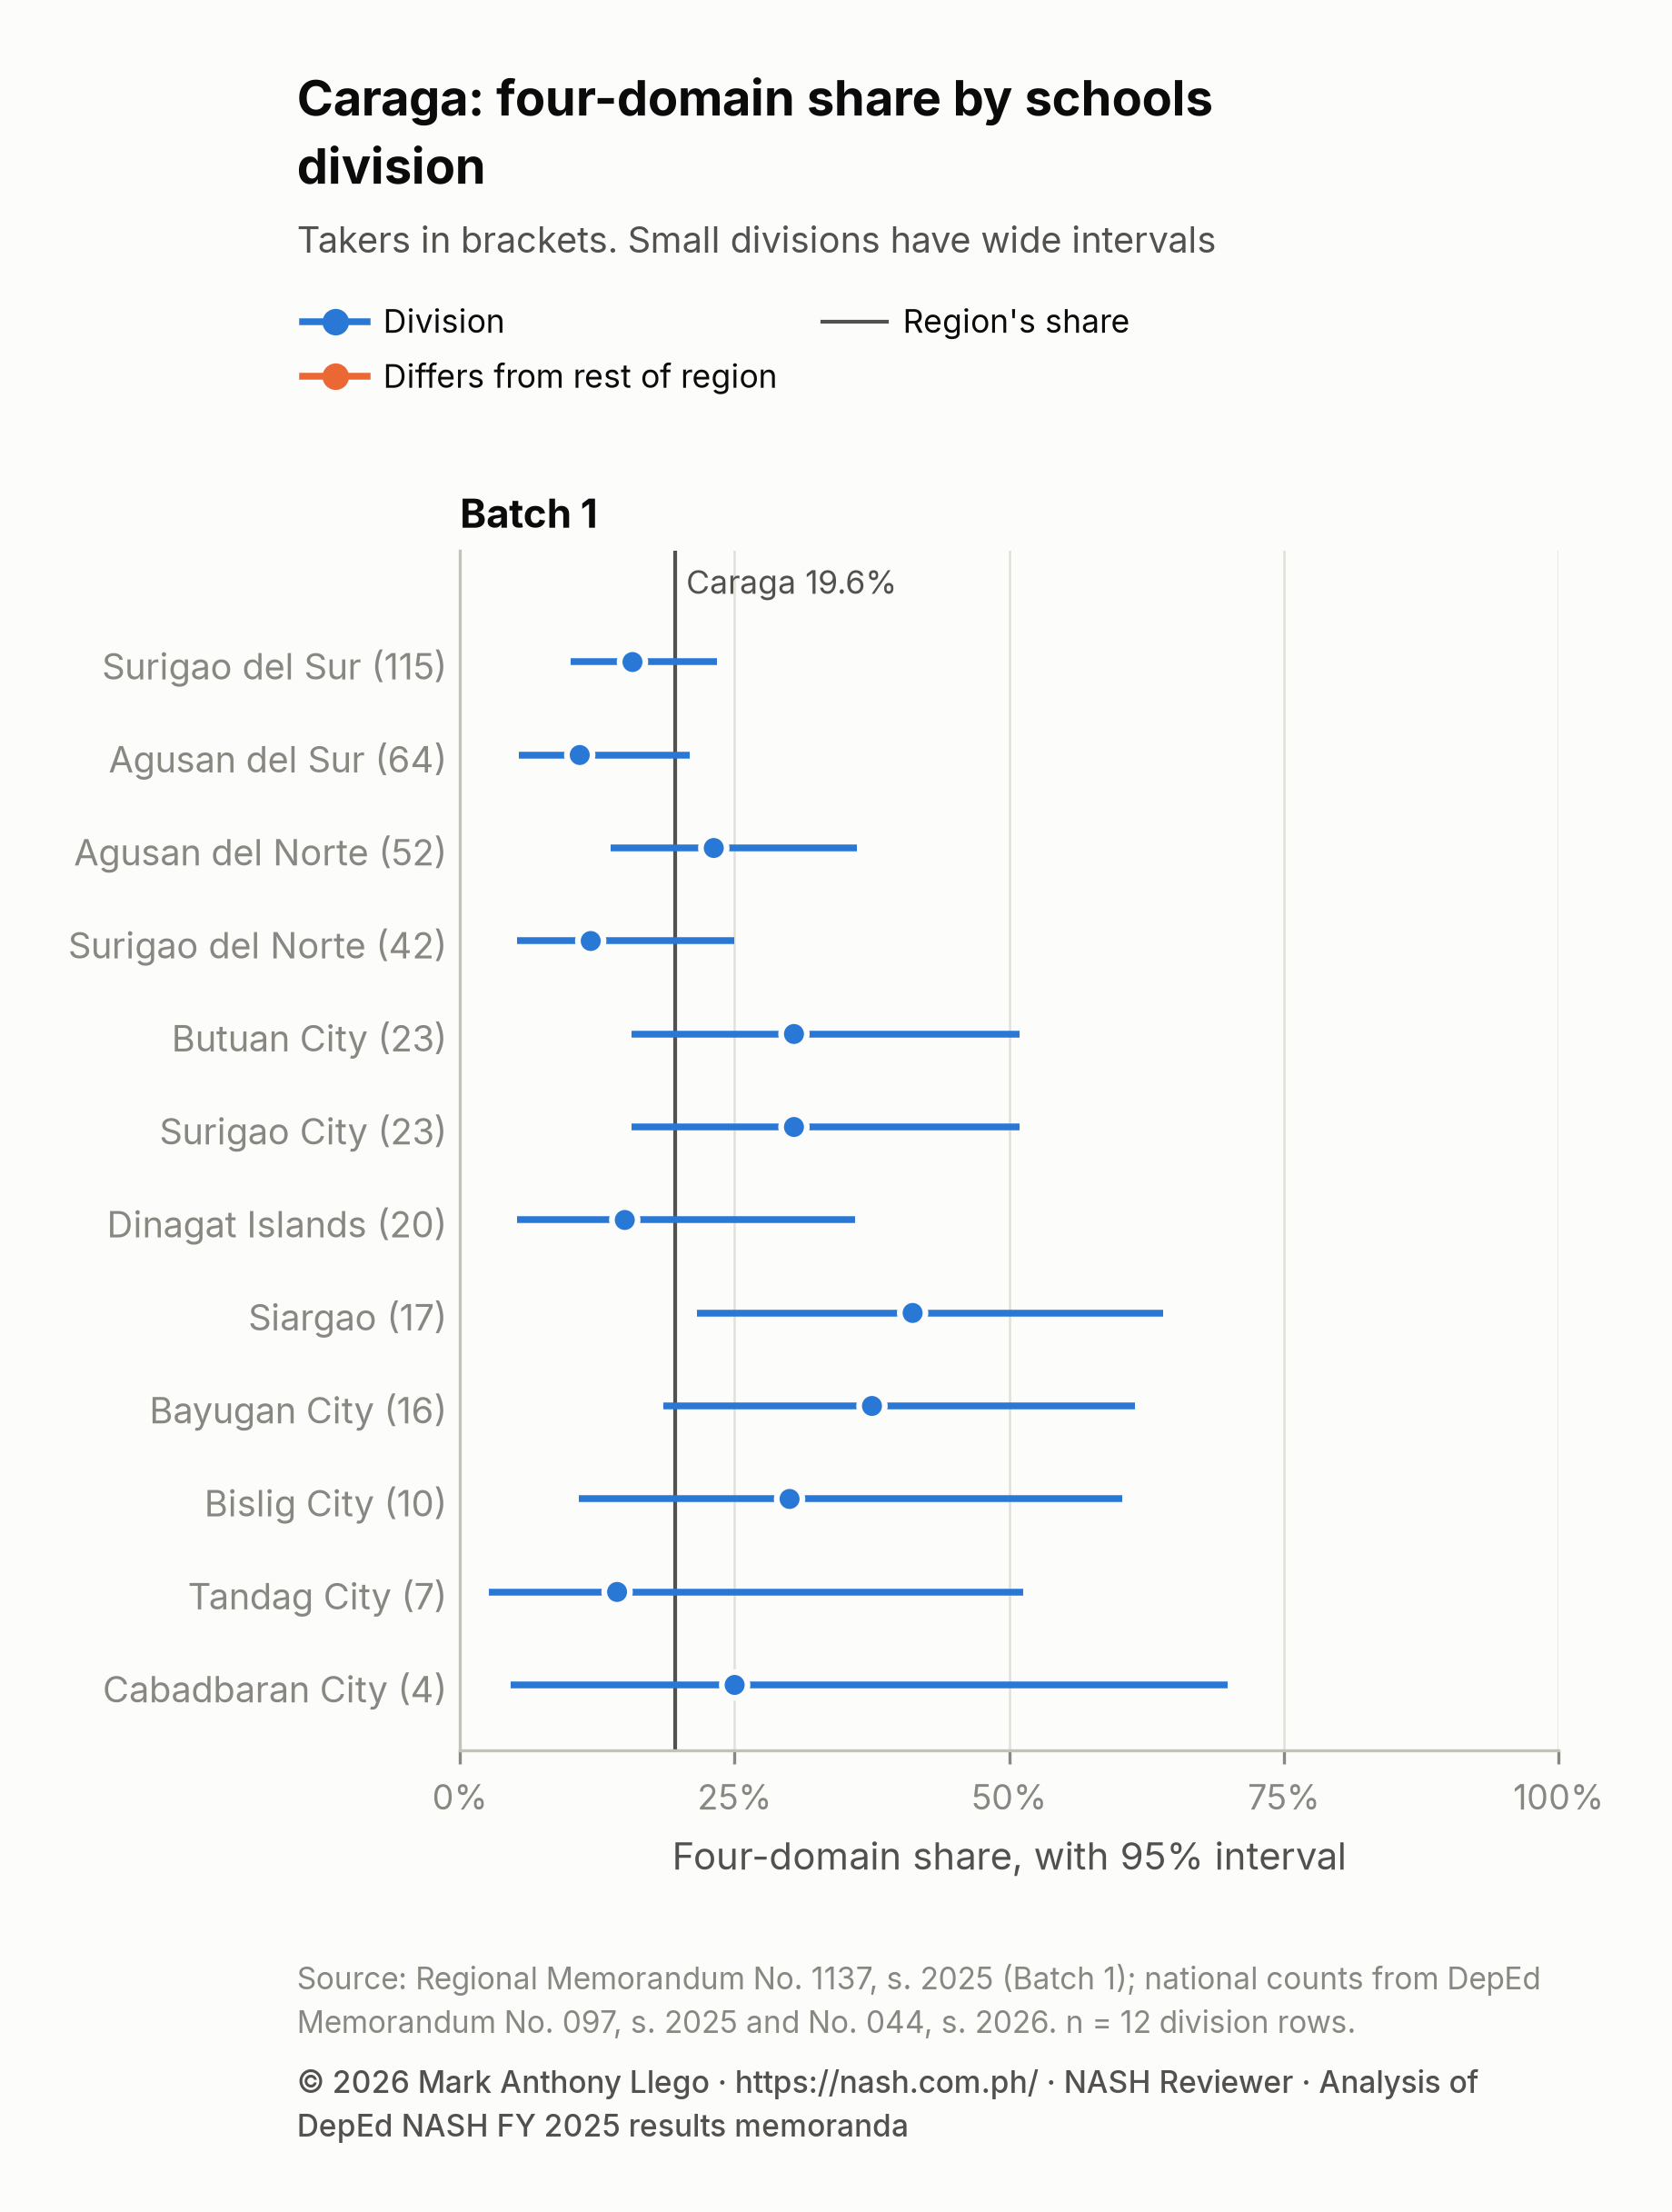
Do not read the table as a ranking. Divisions with few takers can land high or low by chance, and like the regional figures, the division shares describe who took the assessment, not how good a division’s schools are.
Regional Top Performers in Caraga
In Batch 1, the national enclosure names 34 Regional Top Performers from Caraga, which is 44.2% of the region’s 77 takers who met the standards in four domains. Surigao del Sur has 8 of them.
Caraga’s own memorandum lists the same 34 top performers, and all 34 appear in its list of takers who met the standards in four domains. One of them is placed in a different division in the two documents: the regional list has 2 in Agusan del Norte and 5 in Siargao, and the national list has 3 and 4.
Across the regions with published regional counts, the Batch 1 lists hold between 26% and 44% of each region’s four-domain takers, while the Batch 2 lists range from 0.7% to 43%. Neither memorandum states how top performers were chosen, and the spread suggests that each region applied its own rule in Batch 2. The lists are therefore not a ranking of divisions, and they are not the list of everyone who passed. If your name is not on a list, you have not failed. The app’s NASH results page holds the Batch 1 and Batch 2 lists.
What the results mean for aspiring school heads in Caraga
- Start from your own result. Your level is on your certificate of rating in the DepEd LMS. The Individual Development Report that Batch 1’s memorandum describes names the domains to work on, and the level is decided domain by domain.
- Read the regional share as a description, not a forecast. Caraga’s share tells you how its takers did as a group. It does not change the standard you must meet, which is the same for every region.
- Do not judge a division by its share alone. Many divisions had few takers, and their shares can move a long way by chance.
- Study by domain. The PPSSH guides for Domain 1, Domain 2, Domain 3, Domain 4 and Domain 5 cover the five domains, and the practice questions with answers show the situational item style.
- Follow the next steps for your level. Takers meeting the standards in three domains take a Targeted Development Program within three months of appointment; takers With Developmental Areas complete the Professional Development Interventions and a Work Application Plan. The NASH study guide explains what the assessment covers.
How this analysis was done
Division counts add up to the printed regional totals.
The counts cover every taker in the region who completed the assessment, so they are a census, not a sample. The intervals and tests treat each result as the outcome of a process that could have turned out differently: who was approved to take the assessment, how takers prepared, and conditions on the day. They ask whether a difference is larger than such a process would produce by chance.
Shares carry 95% intervals by the Wilson score method. Each comparison with the rest of the country gives the difference in percentage points with a Newcombe score interval, a Miettinen-Nurminen score test, and Cohen’s h, a standardized difference between two shares (0.2 is conventionally small, 0.5 medium and 0.8 large). The p-values are adjusted by the Holm method for every region comparison reported in the batch: 14 in Batch 1 and 12 in Batch 2, the four-domain share and the pass rate for each region. The share With Developmental Areas is not tested separately, because it is the pass rate turned around. The test across all three levels is a chi-square test, with Cramér’s V as its effect size.
Three checks test whether each comparison holds up. Takers in the same division tend to do alike, so a division-cluster interval, which treats divisions rather than takers as the independent units and uses Student’s t, shows how much wider the uncertainty is; because the rest of the country’s divisions are not published, even that interval is a lower bound. The comparison is repeated with each division left out in turn, to see whether a single division drives it. And it is repeated with Region I, the region furthest from the others, left out of the comparison group.
Two tests look at the divisions. The first asks whether the four-domain share differs across the region’s divisions at all. It compares the observed spread with 20,000 random reallocations of the region’s four-domain takers across its divisions, holding each division’s number of takers fixed, which stays valid for small divisions, and its p-value is adjusted for the 12 region-batches tested. The second compares each division with the rest of its region by Fisher’s exact test, Holm-adjusted within the region. When a large division (one with 30% or more of the region’s four-domain takers) is itself above the rest, the other divisions are tested again against the region without it, because a dominant division pulls the rest of the region toward itself.
Limits of the data
- The counts describe completers. “Takers” in the regional tables are the people who received a level. The tables do not say how many were approved but did not take the assessment.
- Batches are not compared. The two batches may not share a score scale, so their figures sit side by side without a test between them.
- The rest of the country includes regions with no regional data. Regional counts are available for 7 of the 17 regions in Batch 1 and 6 in Batch 2, so the comparison group mixes regions with and without published counts.
- Takers are grouped. Takers in the same division resemble each other, so the plain intervals understate the uncertainty. The division-cluster checks above show where that changes a conclusion.
- Causes are unknown. The data cannot say why a region or division differs. They describe takers, not schools.
- Measurement error is not published. DepEd gives no reliability figure, so no one can say how many takers near 65 could change level on a retest.
Frequently asked questions
What is the NASH passing rate in Caraga for 2025?
In Batch 1, 133 of 393 Caraga takers (33.8%) met the PPSSH standards in three or four domains, the two levels that make a taker a prospective candidate for School Principal I. Nationally, the pass rate was 39.0% in Batch 1 and 36.8% in Batch 2.
How many Caraga takers met the PPSSH standards in four domains?
77 of 393 in Batch 1 (19.6%). Nationally, 25.6% of Batch 1 and 25.9% of Batch 2 completers reached that level.
Which schools division in Caraga did best in the NASH?
Neither DepEd nor this post ranks divisions, and shares from small divisions are uncertain. No division’s four-domain share is above the rest of the region’s by more than chance would explain. The division tables above give every division’s figures with their intervals.
Is the Caraga Regional Top Performers list the list of passers?
No. In Batch 1, the list names 34 people, while 133 Caraga takers passed. Not being on the list does not mean you failed.
Where can I check my NASH result?
Sign in to the DepEd LMS with the account you used for the assessment to get your certificate of rating. To find a name on the Regional Top Performer lists, use the app’s NASH results page.
NASH results in other regions
- NASH Results 2025 Explained: the national results and what a score of 65 means
- Region I (Ilocos Region)
- Region V (Bicol Region)
- Region VII (Central Visayas)
- Region VIII (Eastern Visayas)
- Region IX (Zamboanga Peninsula)
- Region XII (SOCCSKSARGEN)
- The Negros Island Region (NIR)
Sources
- Regional Memorandum No. 1137, s. 2025, DepEd Caraga, “Official Results of Batch 1 Test Takers of the National Assessment for School Heads (NASH) FY 2025”, dated October 24, 2025.
- DepEd Memorandum No. 097, s. 2025, Results of the National Assessment for School Heads for Fiscal Year 2025 (Batch 1).
- DepEd Memorandum No. 044, s. 2026, Results of the National Assessment for School Heads for Fiscal Year 2025 (Batch 2).
- DepEd Order No. 024, s. 2020, National Adoption and Implementation of the Philippine Professional Standards for School Heads.
- NASH Reviewer, independent statistical review of the FY 2025 NASH results memoranda and the regional results memoranda, 2026.
Written by Mark Anthony Llego for NASH Reviewer. Sources: Regional Memorandum No. 1137, s. 2025; DepEd Memorandum No. 097, s. 2025 and No. 044, s. 2026. NASH Reviewer is not affiliated with DepEd.